| Param | Original file | Final file |
|---|---|---|
| Filename | modeM0/AS1T03_257T01_9000003976_27663cztM0_level2.evt | modeM0/AS1T03_257T01_9000003976_27663cztM0_level2_quad_clean.evt |
| Size (bytes) | 492,923,520 | 81,858,240 |
| Size | 470.1 MB | 78.1 MB |
| Events in quadrant A | 3,178,685 | 522,253 |
| Events in quadrant B | 3,469,654 | 542,289 |
| Events in quadrant C | 3,209,938 | 503,921 |
| Events in quadrant D | 4,638,377 | 466,419 |
| Mode M9 | |||
|---|---|---|---|
| Quadrant | BADHDUFLAG | Total packets | Discarded packets |
| A | 0 | 20 | 0 |
| B | 0 | 21 | 0 |
| C | 0 | 21 | 0 |
| D | 0 | 21 | 0 |
| Mode M0 | |||
|---|---|---|---|
| Quadrant | BADHDUFLAG | Total packets | Discarded packets |
| A | 0 | 13265 | 0 |
| B | 0 | 14051 | 0 |
| C | 0 | 13264 | 0 |
| D | 0 | 17887 | 0 |
| Quadrant | Total seconds | Saturated seconds | Saturation percentage |
|---|---|---|---|
| A | 6357 | 34 | 0.534843% |
| B | 6357 | 84 | 1.321378% |
| C | 6357 | 56 | 0.880919% |
| D | 6357 | 289 | 4.546170% |
Noise dominated data is calculated using 1-second bins in cleaned event files. If a bin has >2000 counts, and if more than 50% of those come from <1% of pixels, then it is considered to be noise-dominated and hence unusable.
| Quadrant | # 1 sec bins | Bins with >0 counts | Bins with >2000 counts | High rate bins dominated by noise | Noise dominated (total time) | Noise dominated (detector-on time) | Marked lightcurve |
|---|---|---|---|---|---|---|---|
| A | 7617 | 6357 | 5 | 5 | 0.07% | 0.08% | 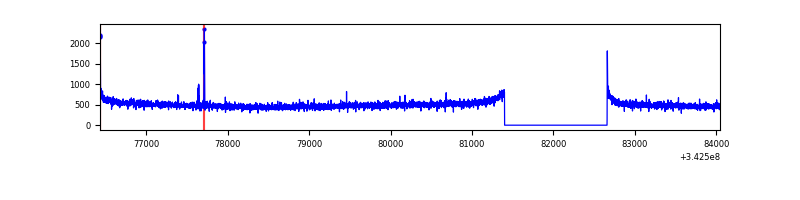 |
| B | 7617 | 6358 | 26 | 26 | 0.34% | 0.41% | 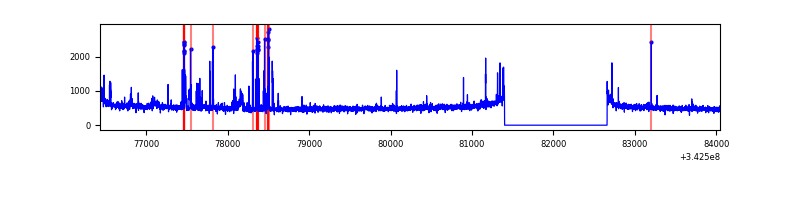 |
| C | 7617 | 6358 | 0 | 0 | 0.00% | 0.00% | 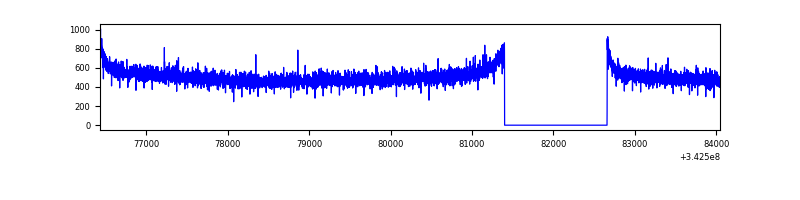 |
| D | 7617 | 6358 | 232 | 232 | 3.05% | 3.65% | 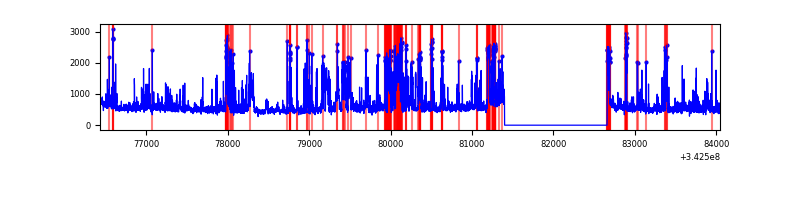 |
Top three noisy pixels from each quadrant. If the there are fewer than three noisy pixels in the level2.evt file, extra rows are filled as -1
| Pixel properties | Quadrant properties | ||||||
|---|---|---|---|---|---|---|---|
| Quadrant | DetID | PixID | Counts | Sigma | Mean | Median | Sigma |
| A | 15 | 174 | 15129 | 87.76 | 817 | 801 | 163.3 |
| A | 8 | 192 | 12220 | 69.94 | 817 | 801 | 163.3 |
| A | 13 | 254 | 10931 | 62.05 | 817 | 801 | 163.3 |
| B | 10 | 245 | 215559 | 1385.07 | 823 | 802 | 155.1 |
| B | 0 | 230 | 21658 | 134.51 | 823 | 802 | 155.1 |
| B | 12 | 111 | 18171 | 112.02 | 823 | 802 | 155.1 |
| C | 14 | 238 | 127834 | 689.77 | 788 | 795 | 184.2 |
| C | 3 | 233 | 6509 | 31.02 | 788 | 795 | 184.2 |
| C | 13 | 61 | 5237 | 24.12 | 788 | 795 | 184.2 |
| D | 1 | 52 | 1565189 | 8586.78 | 765 | 745 | 182.2 |
| D | 2 | 250 | 103273 | 562.75 | 765 | 745 | 182.2 |
| D | 11 | 176 | 39095 | 210.49 | 765 | 745 | 182.2 |
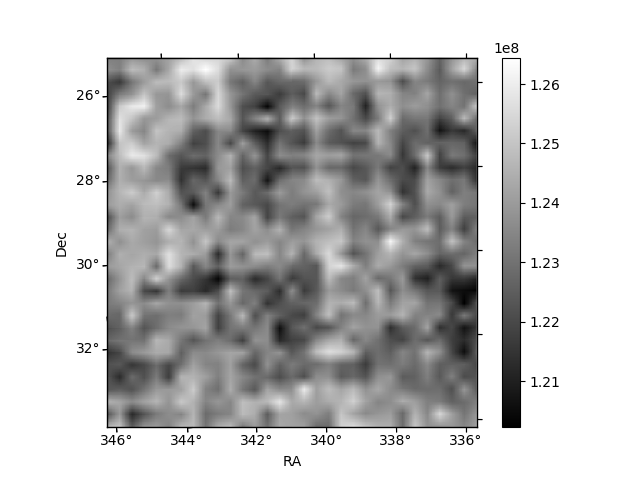
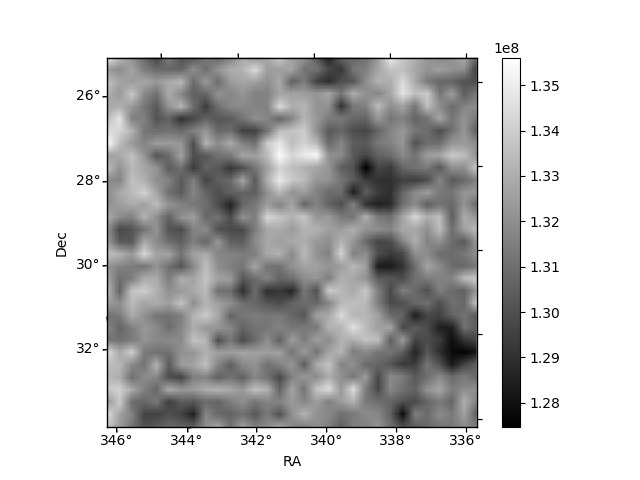
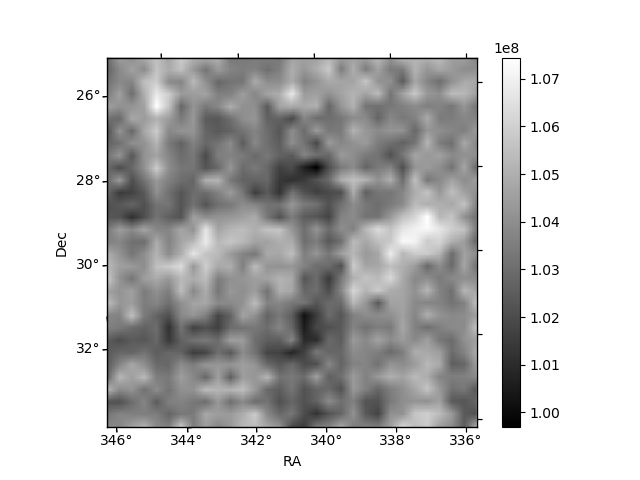
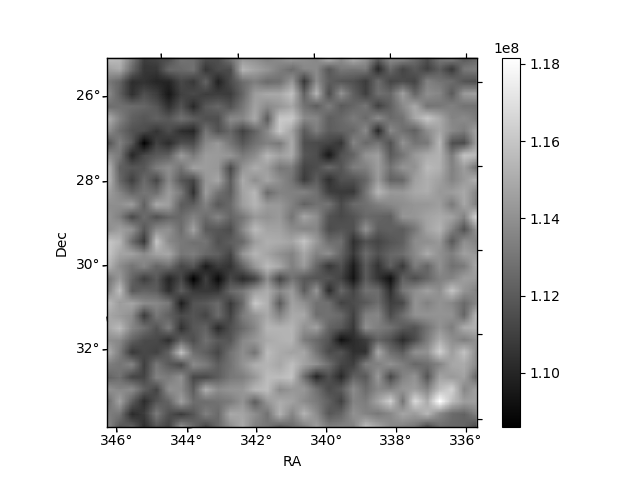
Histogram calculated using DETX and DETY for each event in the final _common_clean file
| Quadrant A | 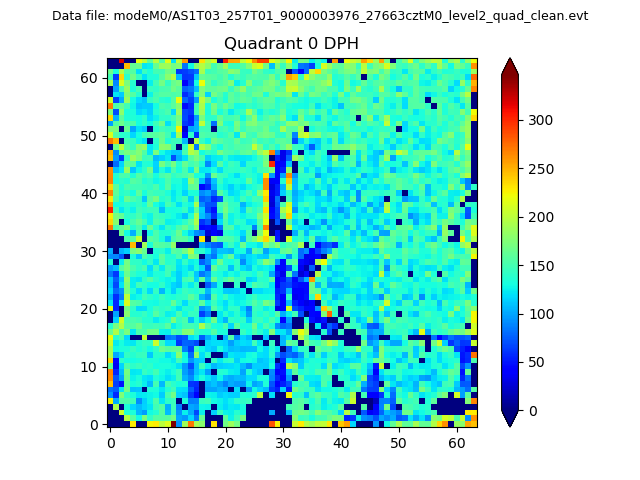 |
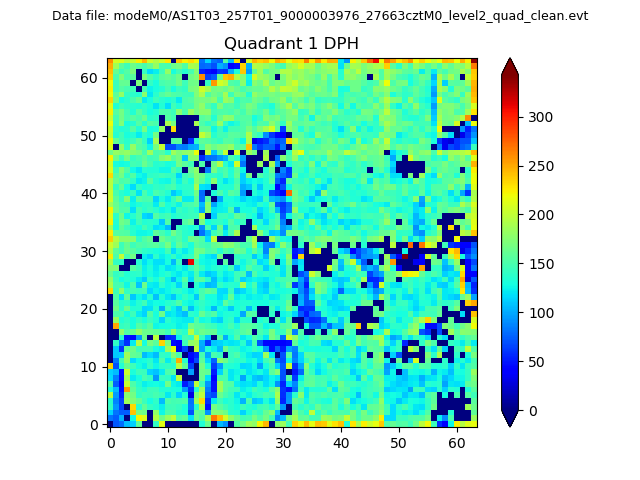 |
Quadrant B |
|---|---|---|---|
| Quadrant D | 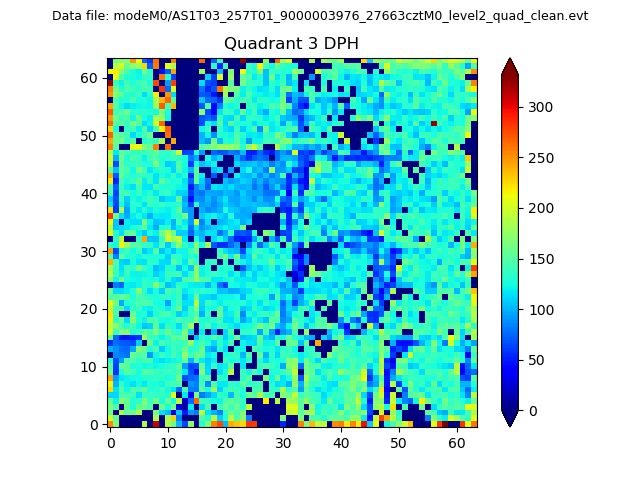 |
 |
Quadrant C |
| Plot type | Count rate plots | Images |
|---|---|---|
| Comparison with Poisson distribution Blue bars denote a histogram of data divided into 1 sec bins. Red curve is a Poisson curve with rate = median count rate of data. |
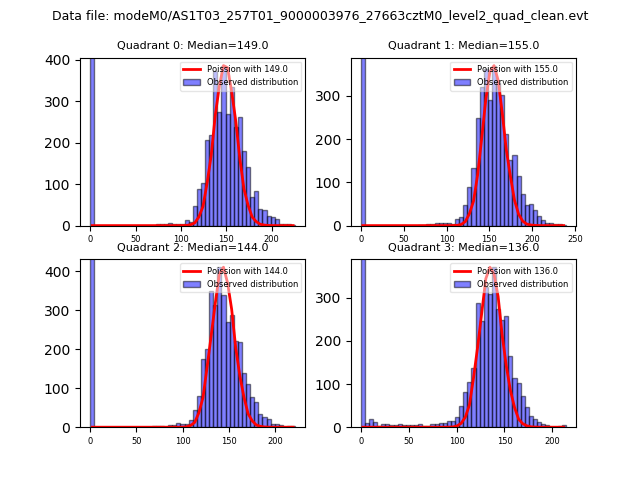 |
 |
| Quadrant-wise count rates Data is divided into 100 sec bins |
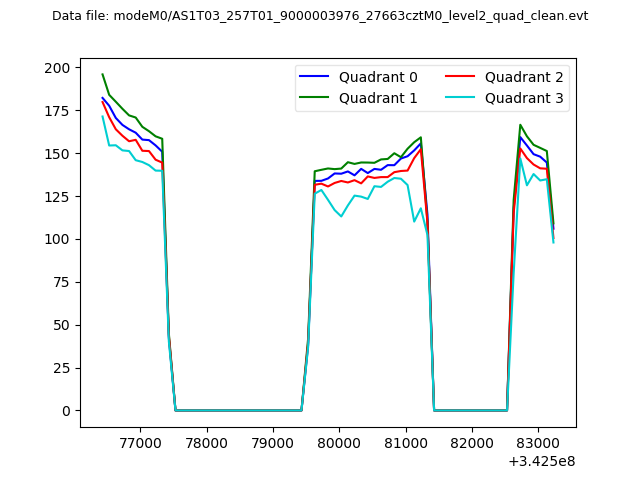 |
|
| Module-wise count rates for Quadrant A Data is divided into 100 sec bins |
 |
 |
| Module-wise count rates for Quadrant B Data is divided into 100 sec bins |
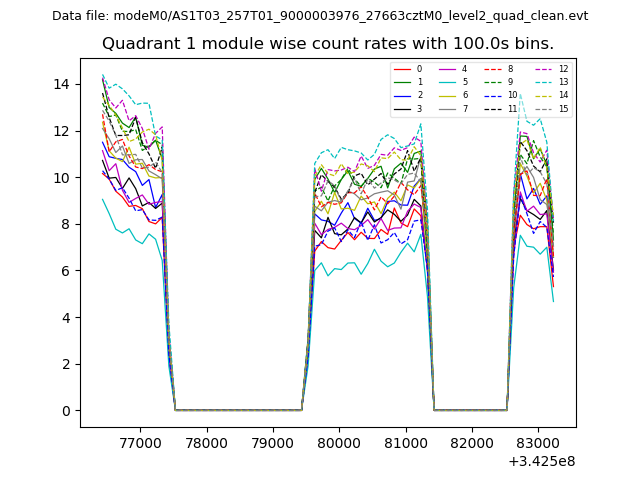 |
 |
| Module-wise count rates for Quadrant C Data is divided into 100 sec bins |
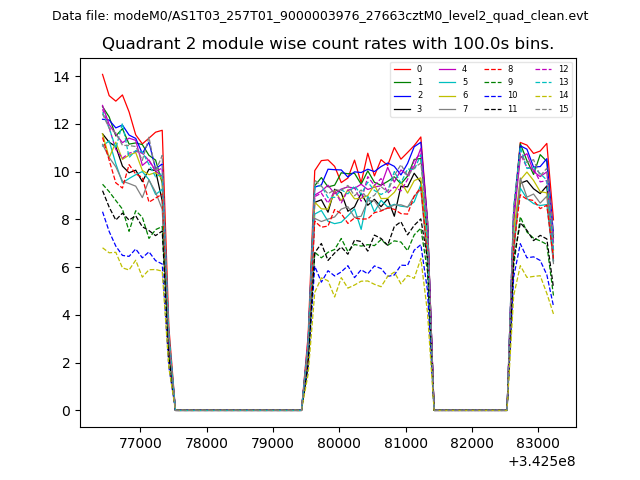 |
 |
| Module-wise count rates for Quadrant D Data is divided into 100 sec bins |
 |
 |
| Parameter | Plot |
|---|---|
| CZT HV Monitor | 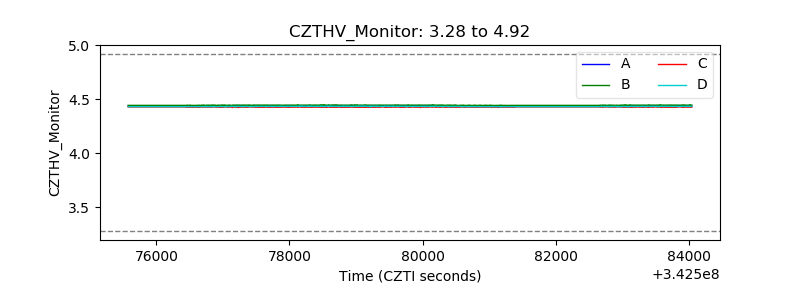 |
| D_VDD | 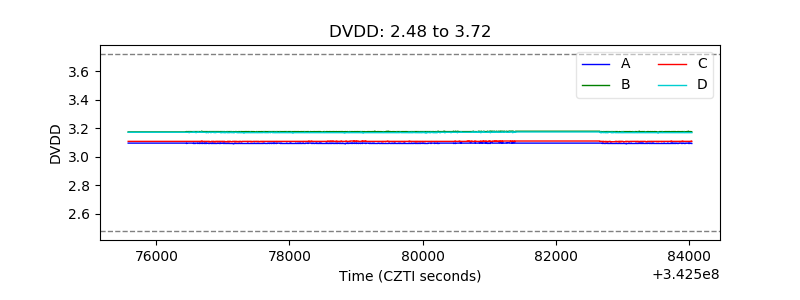 |
| Temperature 1 | 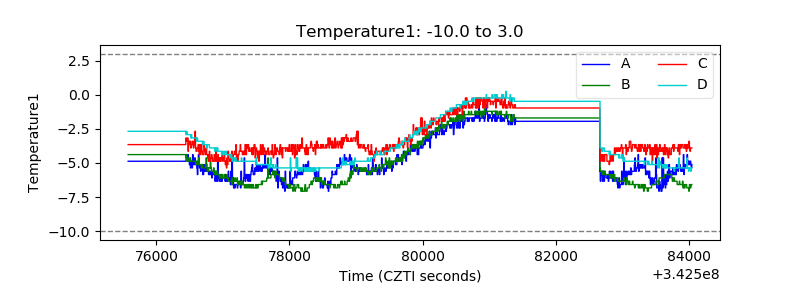 |
| Veto HV Monitor | 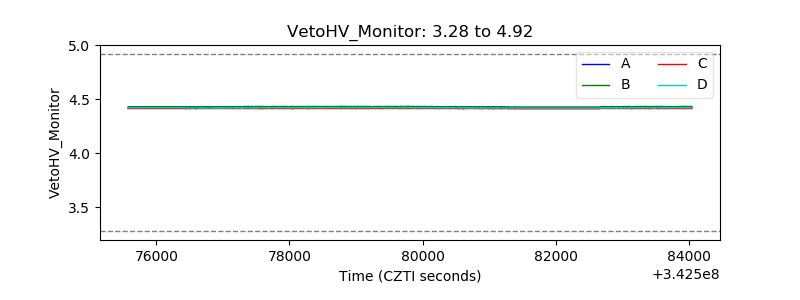 |
| Veto LLD | 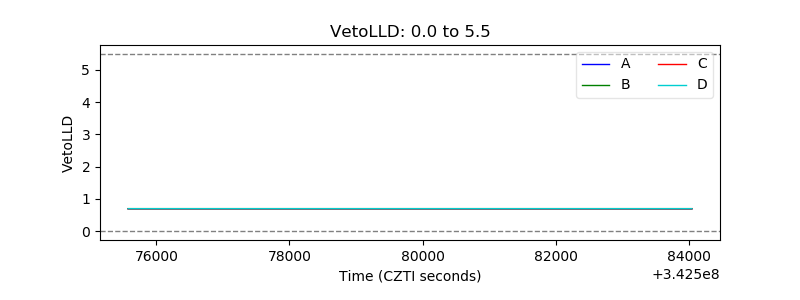 |
| Alpha Counter | 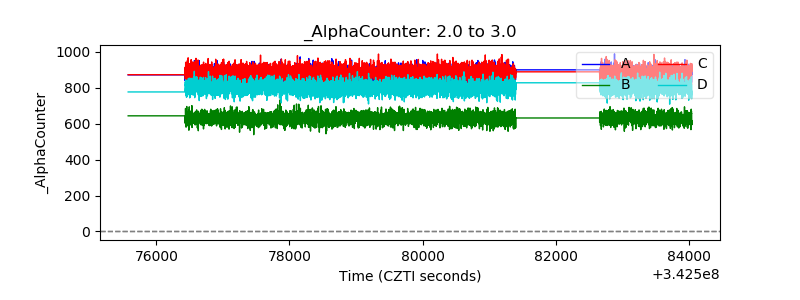 |
| _CPM_Rate | 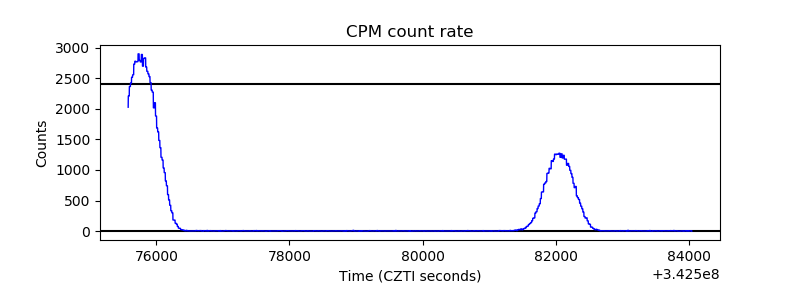 |
| CZT Counter |  |
| +2.5 Volts monitor |  |
| +5 Volts monitor |  |
| _ROLL_ROT |  |
| _Roll_DEC |  |
| _Roll_RA |  |
| Veto Counter |  |