| Param | Original file | Final file |
|---|---|---|
| Filename | modeM0/AS1T03_257T01_9000003976_27664cztM0_level2.evt | modeM0/AS1T03_257T01_9000003976_27664cztM0_level2_quad_clean.evt |
| Size (bytes) | 586,690,560 | 75,896,640 |
| Size | 559.5 MB | 72.4 MB |
| Events in quadrant A | 3,357,651 | 473,652 |
| Events in quadrant B | 3,852,232 | 482,670 |
| Events in quadrant C | 3,375,163 | 460,107 |
| Events in quadrant D | 6,715,686 | 400,840 |
| Mode M9 | |||
|---|---|---|---|
| Quadrant | BADHDUFLAG | Total packets | Discarded packets |
| A | 0 | 12 | 0 |
| B | 0 | 13 | 0 |
| C | 0 | 13 | 0 |
| D | 0 | 13 | 0 |
| Mode M0 | |||
|---|---|---|---|
| Quadrant | BADHDUFLAG | Total packets | Discarded packets |
| A | 0 | 14292 | 0 |
| B | 0 | 15700 | 0 |
| C | 0 | 14230 | 0 |
| D | 0 | 24617 | 0 |
| Quadrant | Total seconds | Saturated seconds | Saturation percentage |
|---|---|---|---|
| A | 6898 | 56 | 0.811830% |
| B | 6898 | 145 | 2.102059% |
| C | 6898 | 55 | 0.797333% |
| D | 6897 | 687 | 9.960853% |
Noise dominated data is calculated using 1-second bins in cleaned event files. If a bin has >2000 counts, and if more than 50% of those come from <1% of pixels, then it is considered to be noise-dominated and hence unusable.
| Quadrant | # 1 sec bins | Bins with >0 counts | Bins with >2000 counts | High rate bins dominated by noise | Noise dominated (total time) | Noise dominated (detector-on time) | Marked lightcurve |
|---|---|---|---|---|---|---|---|
| A | 7853 | 6898 | 8 | 8 | 0.10% | 0.12% | 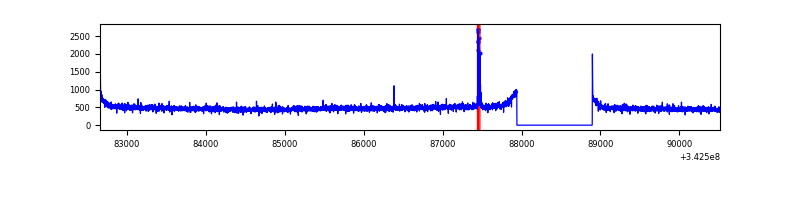 |
| B | 7853 | 6898 | 68 | 68 | 0.87% | 0.99% | 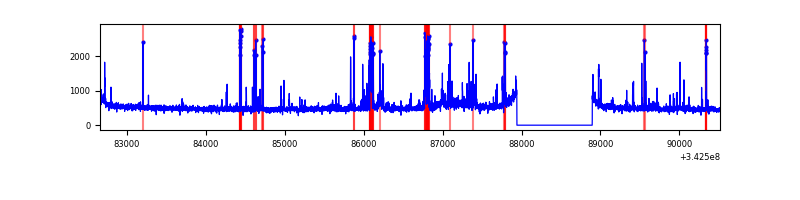 |
| C | 7853 | 6898 | 0 | 0 | 0.00% | 0.00% | 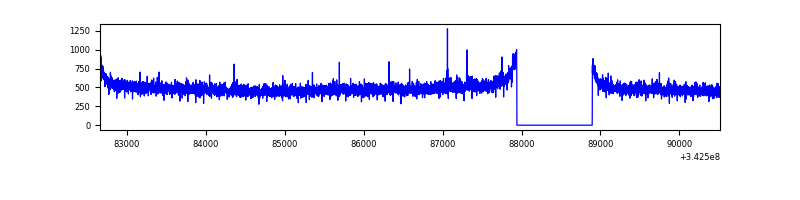 |
| D | 7852 | 6897 | 605 | 605 | 7.71% | 8.77% | 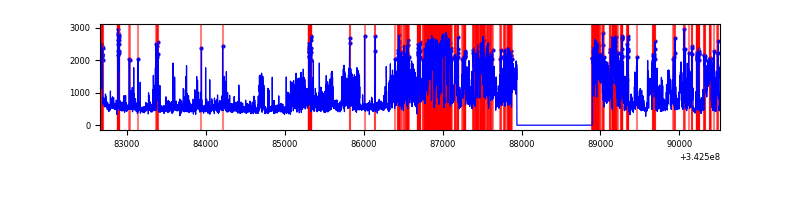 |
Top three noisy pixels from each quadrant. If the there are fewer than three noisy pixels in the level2.evt file, extra rows are filled as -1
| Pixel properties | Quadrant properties | ||||||
|---|---|---|---|---|---|---|---|
| Quadrant | DetID | PixID | Counts | Sigma | Mean | Median | Sigma |
| A | 13 | 248 | 36212 | 204.46 | 858 | 840 | 173.0 |
| A | 13 | 254 | 11556 | 61.94 | 858 | 840 | 173.0 |
| A | 8 | 192 | 11249 | 60.17 | 858 | 840 | 173.0 |
| B | 10 | 245 | 422663 | 2591.07 | 858 | 837 | 162.8 |
| B | 15 | 33 | 40482 | 243.52 | 858 | 837 | 162.8 |
| B | 12 | 111 | 19834 | 116.69 | 858 | 837 | 162.8 |
| C | 14 | 238 | 131555 | 669.07 | 826 | 830 | 195.4 |
| C | 3 | 233 | 24951 | 123.46 | 826 | 830 | 195.4 |
| C | 13 | 61 | 5528 | 24.05 | 826 | 830 | 195.4 |
| D | 1 | 52 | 2743888 | 14820.62 | 782 | 763 | 185.1 |
| D | 7 | 80 | 863236 | 4659.79 | 782 | 763 | 185.1 |
| D | 2 | 250 | 96042 | 514.78 | 782 | 763 | 185.1 |
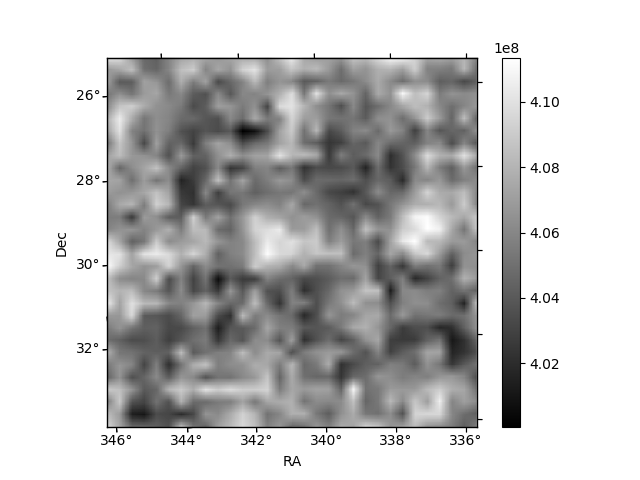
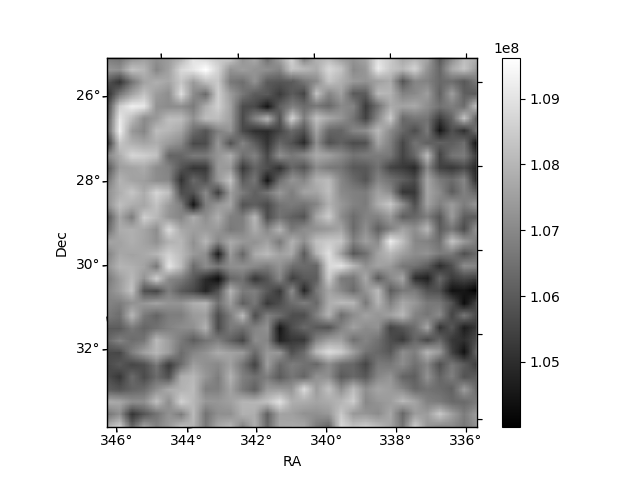
Histogram calculated using DETX and DETY for each event in the final _common_clean file
| Quadrant A | 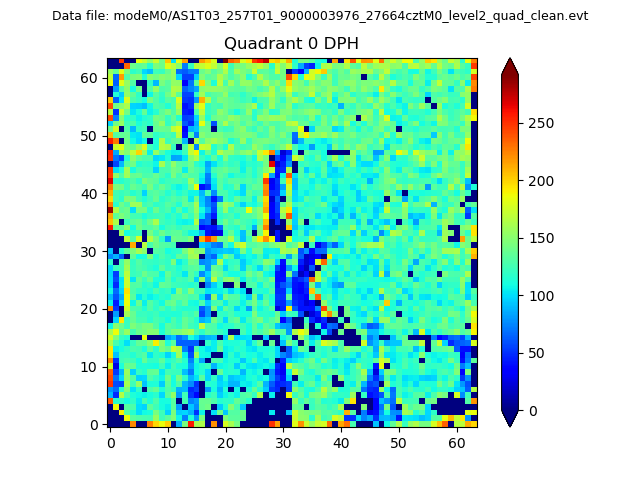 |
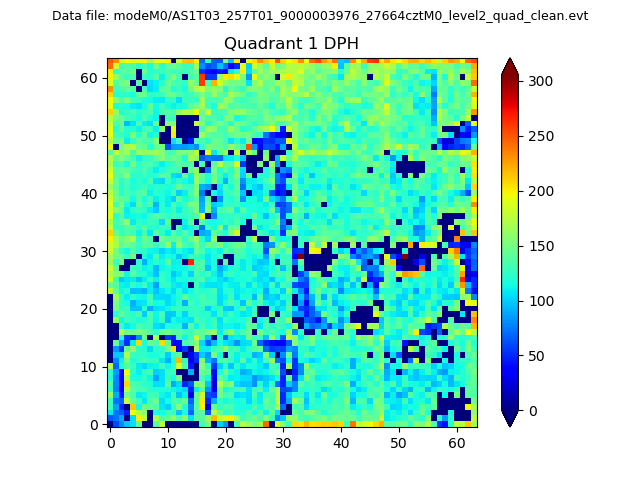 |
Quadrant B |
|---|---|---|---|
| Quadrant D | 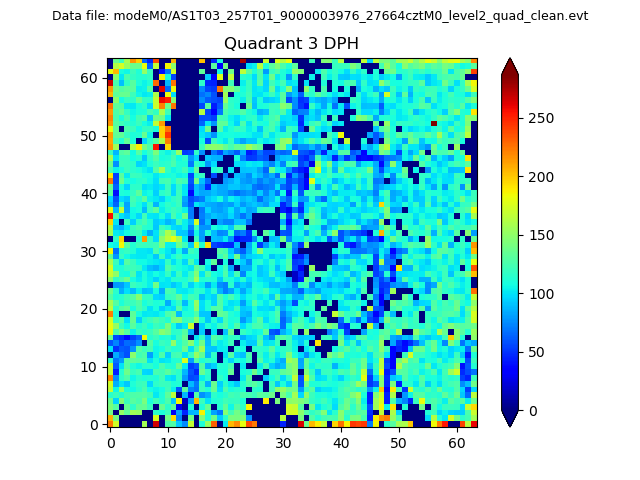 |
 |
Quadrant C |
| Plot type | Count rate plots | Images |
|---|---|---|
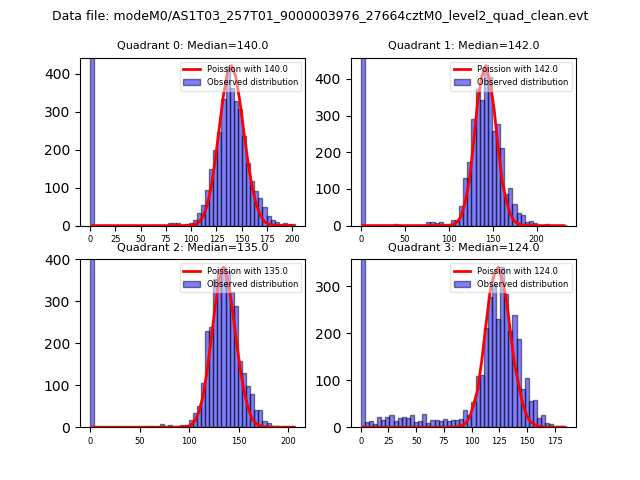
| Comparison with Poisson distribution Blue bars denote a histogram of data divided into 1 sec bins. Red curve is a Poisson curve with rate = median count rate of data. |
 |
 |
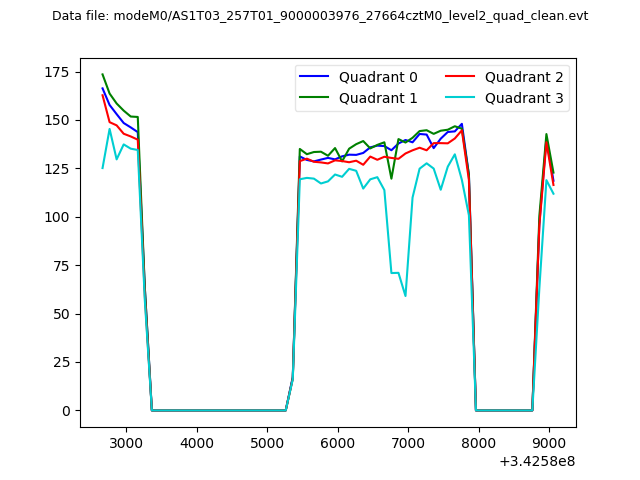
| Quadrant-wise count rates Data is divided into 100 sec bins |
 |
|
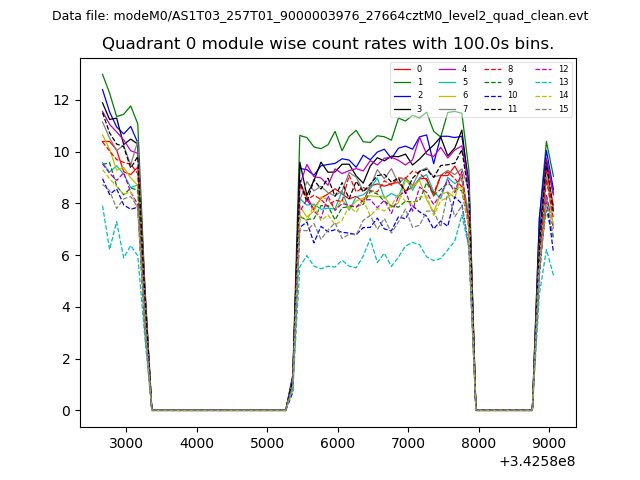
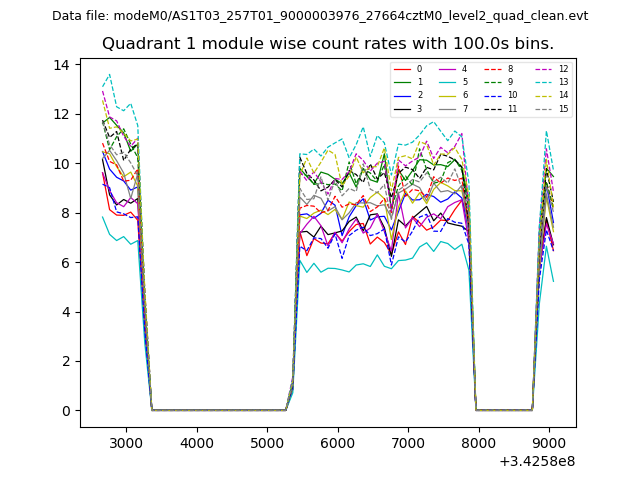
| Module-wise count rates for Quadrant A Data is divided into 100 sec bins |
 |
 |
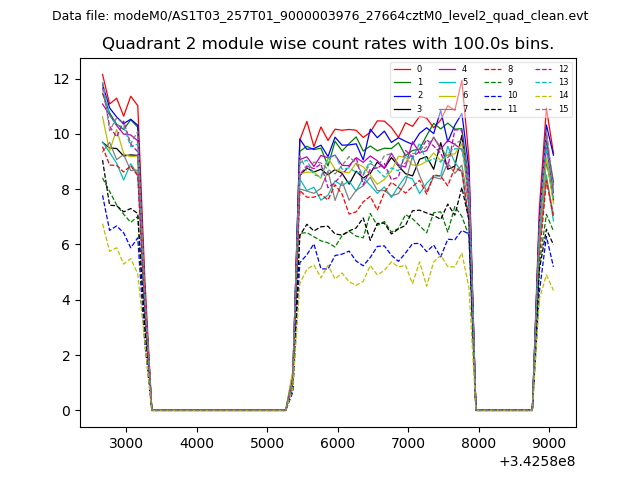
| Module-wise count rates for Quadrant B Data is divided into 100 sec bins |
 |
 |
| Module-wise count rates for Quadrant C Data is divided into 100 sec bins |
 |
 |
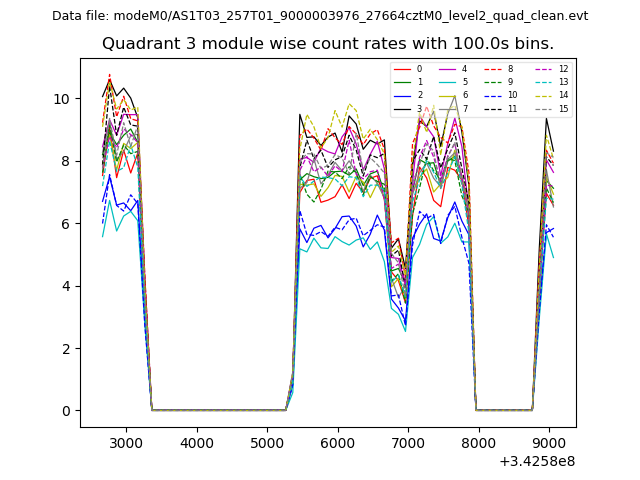
| Module-wise count rates for Quadrant D Data is divided into 100 sec bins |
 |
 |
| Parameter | Plot |
|---|---|
| CZT HV Monitor | 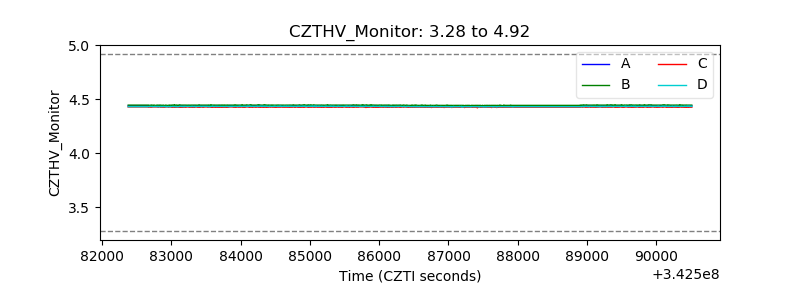 |
| D_VDD | 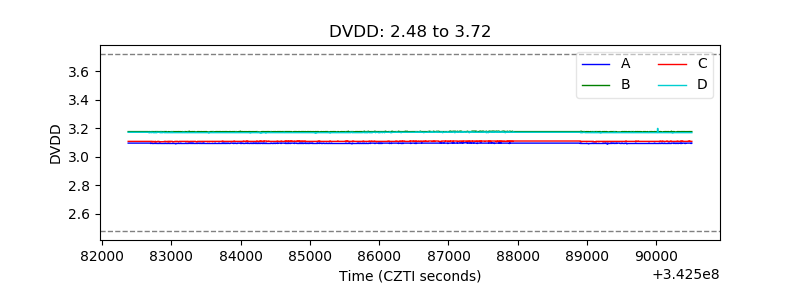 |
| Temperature 1 | 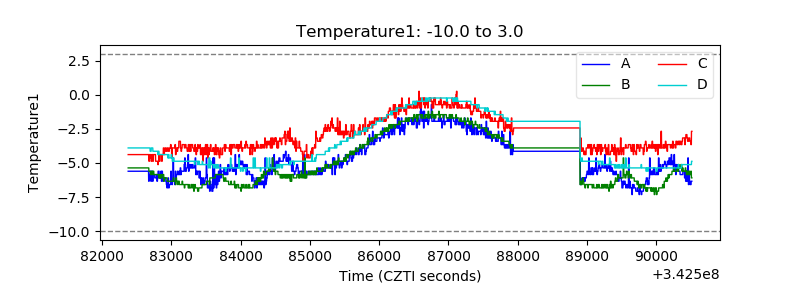 |
| Veto HV Monitor | 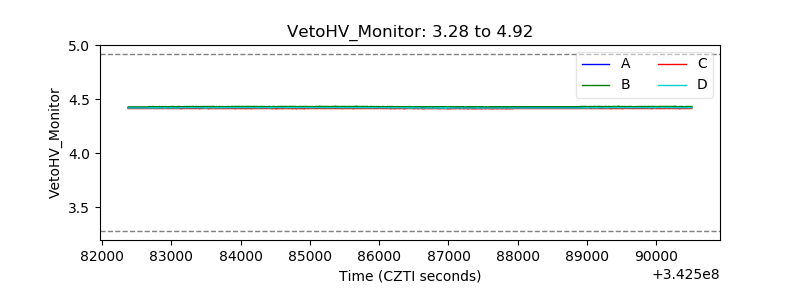 |
| Veto LLD | 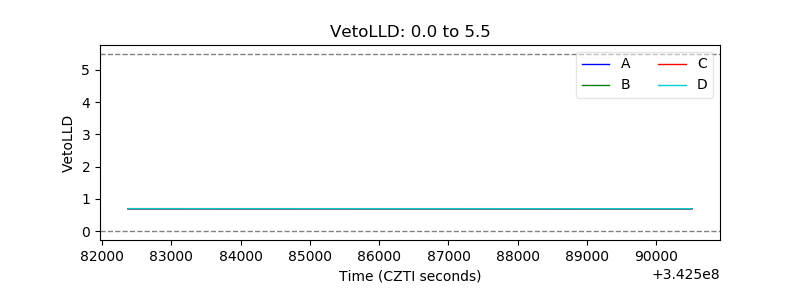 |
| Alpha Counter | 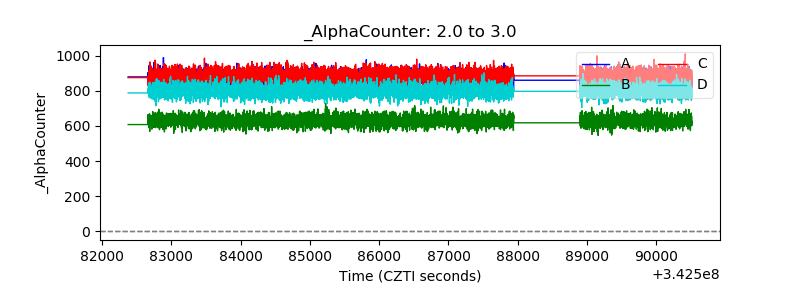 |
| _CPM_Rate | 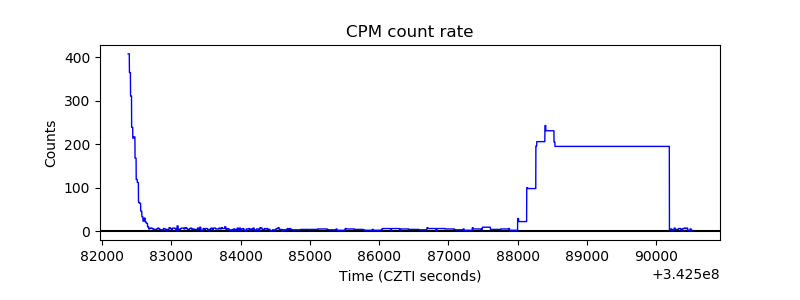 |
| CZT Counter | 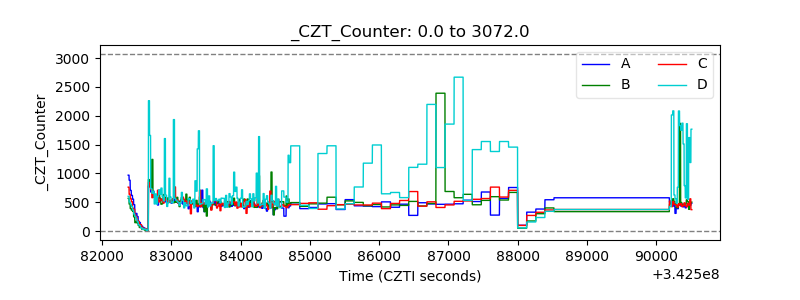 |
| +2.5 Volts monitor | 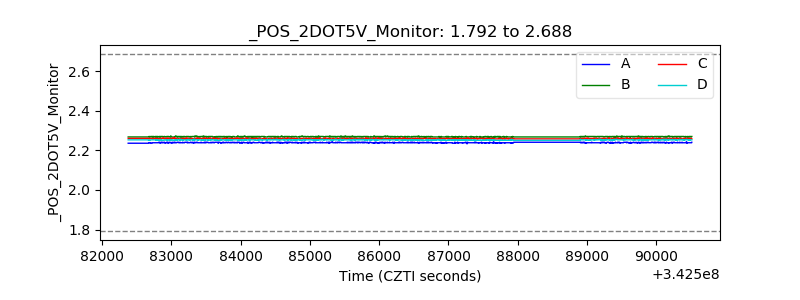 |
| +5 Volts monitor |  |
| _ROLL_ROT | 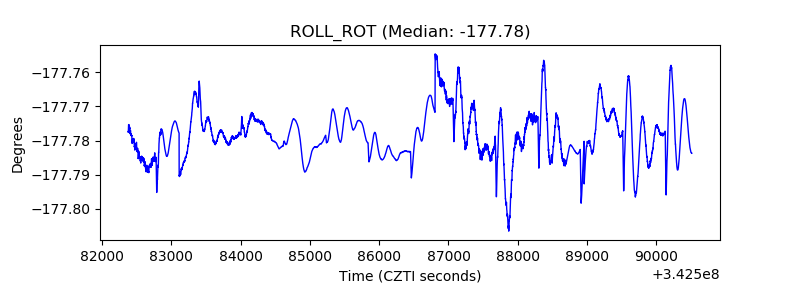 |
| _Roll_DEC |  |
| _Roll_RA | 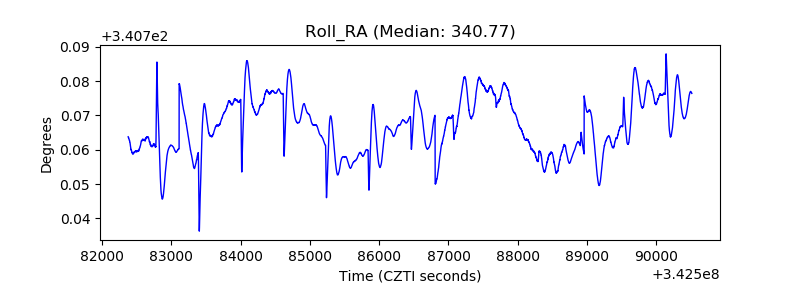 |
| Veto Counter | 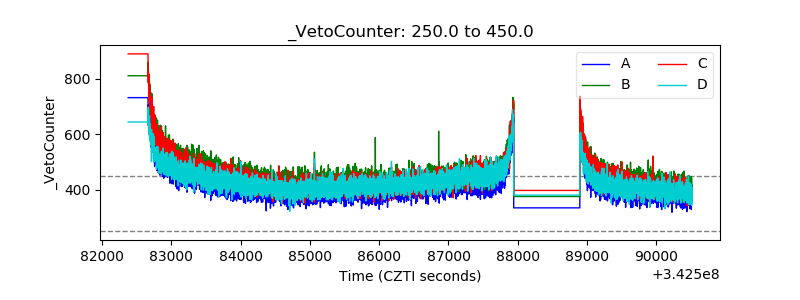 |