| Param | Original file | Final file |
|---|---|---|
| Filename | modeM0/AS1T03_257T01_9000003976_27666cztM0_level2.evt | modeM0/AS1T03_257T01_9000003976_27666cztM0_level2_quad_clean.evt |
| Size (bytes) | 716,184,000 | 86,178,240 |
| Size | 683.0 MB | 82.2 MB |
| Events in quadrant A | 3,983,560 | 532,928 |
| Events in quadrant B | 4,335,060 | 537,658 |
| Events in quadrant C | 4,120,106 | 517,980 |
| Events in quadrant D | 8,696,699 | 451,797 |
| Mode M9 | |||
|---|---|---|---|
| Quadrant | BADHDUFLAG | Total packets | Discarded packets |
| A | 0 | 6 | 0 |
| B | 0 | 6 | 0 |
| C | 0 | 6 | 0 |
| D | 0 | 6 | 0 |
| Mode M0 | |||
|---|---|---|---|
| Quadrant | BADHDUFLAG | Total packets | Discarded packets |
| A | 0 | 17140 | 0 |
| B | 0 | 18043 | 0 |
| C | 0 | 17328 | 0 |
| D | 0 | 31366 | 0 |
| Quadrant | Total seconds | Saturated seconds | Saturation percentage |
|---|---|---|---|
| A | 8182 | 288 | 3.519922% |
| B | 8183 | 409 | 4.998167% |
| C | 8182 | 339 | 4.143241% |
| D | 8182 | 1391 | 17.000733% |
Noise dominated data is calculated using 1-second bins in cleaned event files. If a bin has >2000 counts, and if more than 50% of those come from <1% of pixels, then it is considered to be noise-dominated and hence unusable.
| Quadrant | # 1 sec bins | Bins with >0 counts | Bins with >2000 counts | High rate bins dominated by noise | Noise dominated (total time) | Noise dominated (detector-on time) | Marked lightcurve |
|---|---|---|---|---|---|---|---|
| A | 8717 | 8182 | 0 | 0 | 0.00% | 0.00% | 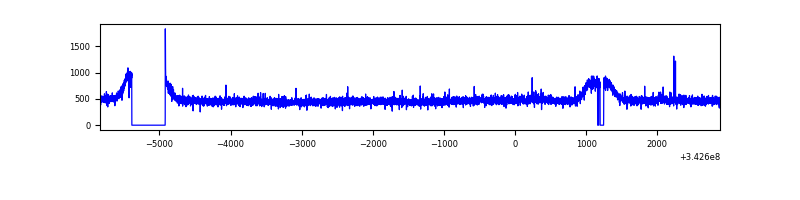 |
| B | 8718 | 8183 | 43 | 43 | 0.49% | 0.53% | 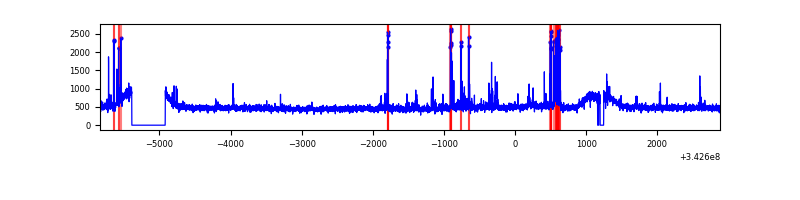 |
| C | 8717 | 8182 | 0 | 0 | 0.00% | 0.00% | 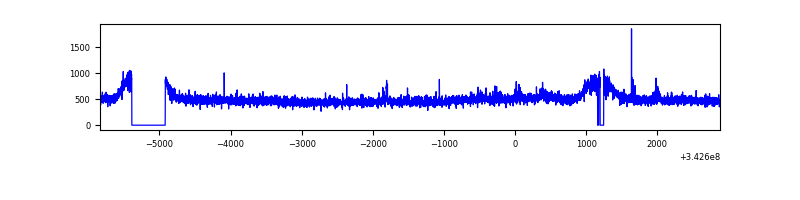 |
| D | 8717 | 8182 | 1096 | 1096 | 12.57% | 13.40% | 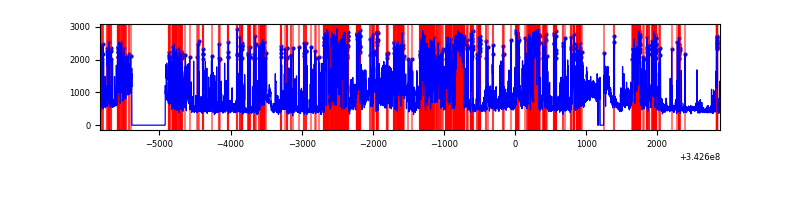 |
Top three noisy pixels from each quadrant. If the there are fewer than three noisy pixels in the level2.evt file, extra rows are filled as -1
| Pixel properties | Quadrant properties | ||||||
|---|---|---|---|---|---|---|---|
| Quadrant | DetID | PixID | Counts | Sigma | Mean | Median | Sigma |
| A | 13 | 254 | 13399 | 59.05 | 1028 | 1001 | 209.9 |
| A | 3 | 137 | 10264 | 44.12 | 1028 | 1001 | 209.9 |
| A | 15 | 174 | 10174 | 43.69 | 1028 | 1001 | 209.9 |
| B | 10 | 245 | 259290 | 1296.28 | 1022 | 993 | 199.3 |
| B | 0 | 230 | 38917 | 190.32 | 1022 | 993 | 199.3 |
| B | 12 | 111 | 25221 | 121.59 | 1022 | 993 | 199.3 |
| C | 14 | 238 | 155828 | 658.06 | 991 | 995 | 235.3 |
| C | 3 | 233 | 86781 | 364.6 | 991 | 995 | 235.3 |
| C | 2 | 16 | 11595 | 45.05 | 991 | 995 | 235.3 |
| D | 1 | 52 | 4966086 | 22001.69 | 942 | 914 | 225.7 |
| D | 2 | 250 | 82211 | 360.24 | 942 | 914 | 225.7 |
| D | 2 | 234 | 39872 | 172.63 | 942 | 914 | 225.7 |
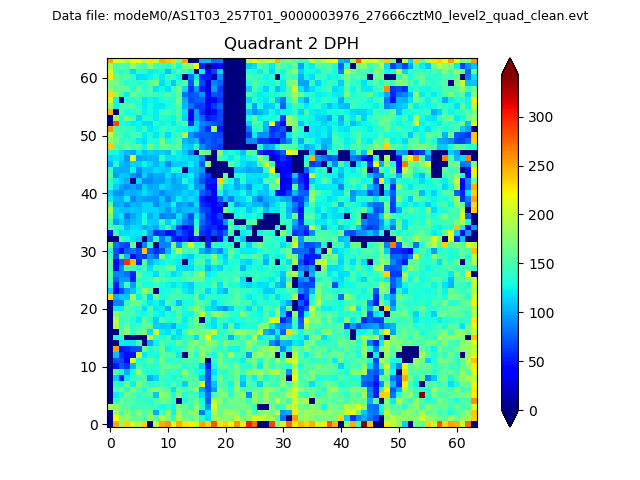
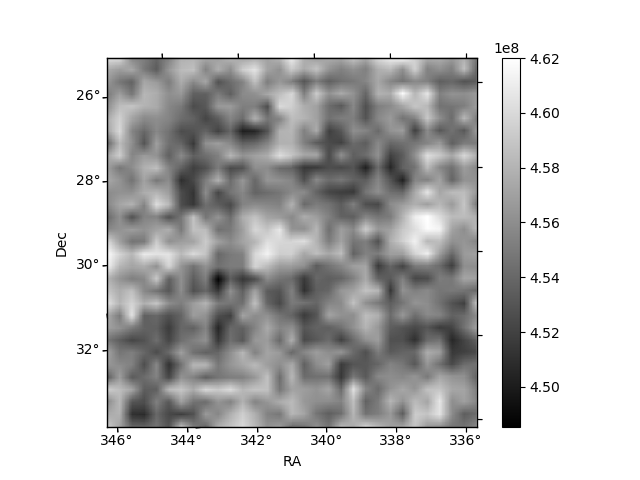
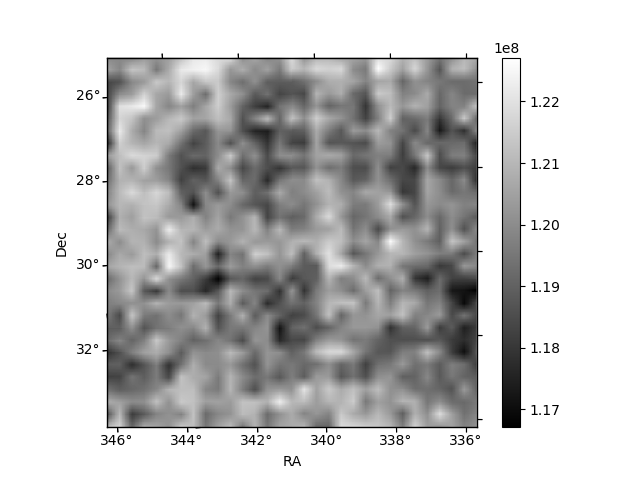
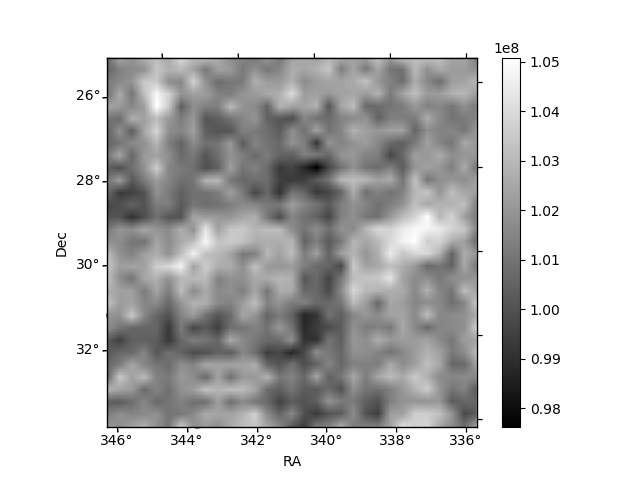
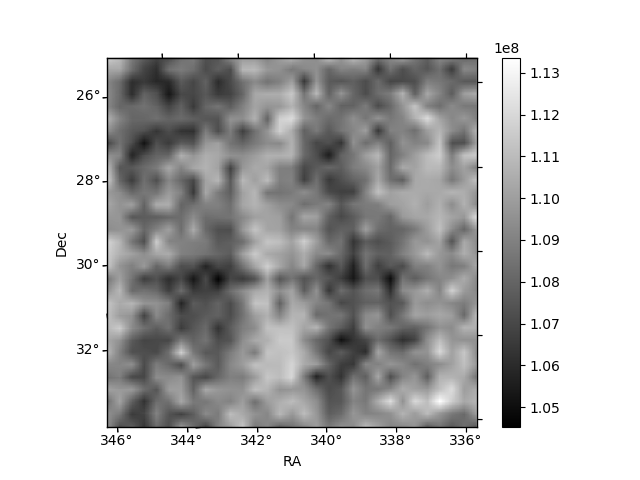
Histogram calculated using DETX and DETY for each event in the final _common_clean file
| Quadrant A | 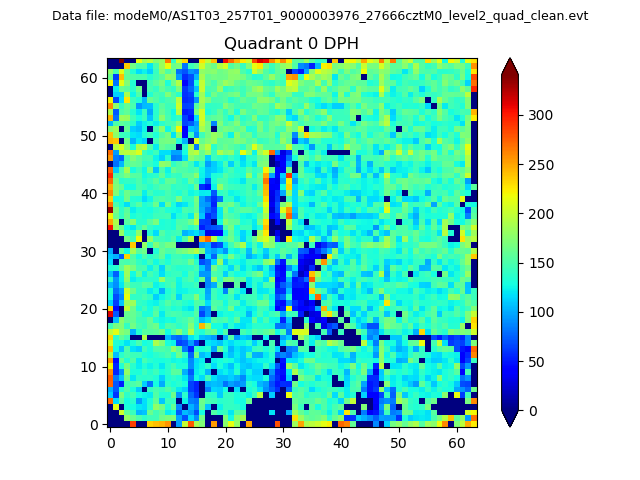 |
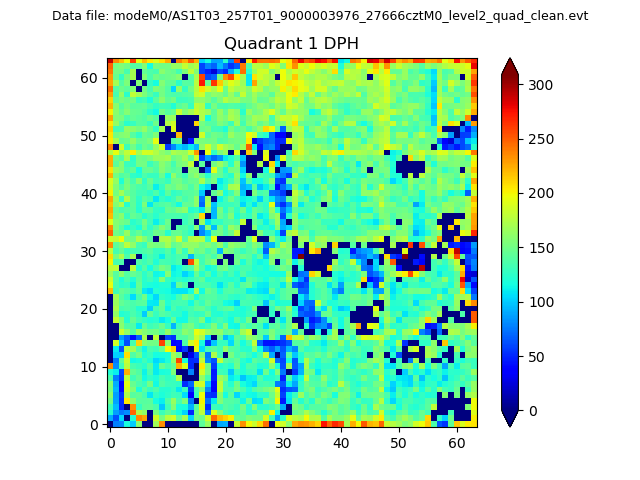 |
Quadrant B |
|---|---|---|---|
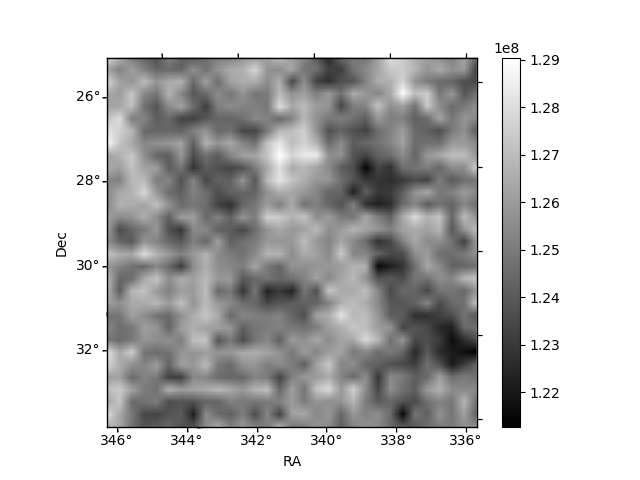
| Quadrant D | 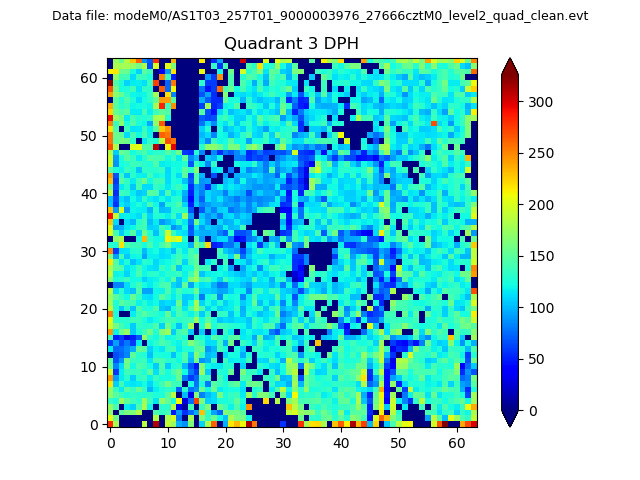 |
 |
Quadrant C |
| Plot type | Count rate plots | Images |
|---|---|---|
| Comparison with Poisson distribution Blue bars denote a histogram of data divided into 1 sec bins. Red curve is a Poisson curve with rate = median count rate of data. |
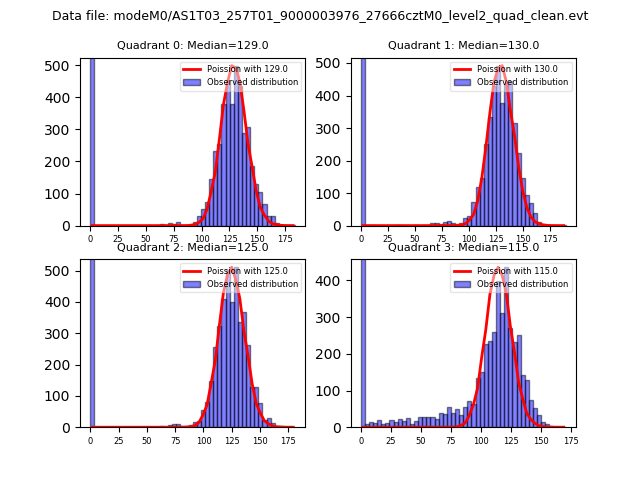 |
 |
| Quadrant-wise count rates Data is divided into 100 sec bins |
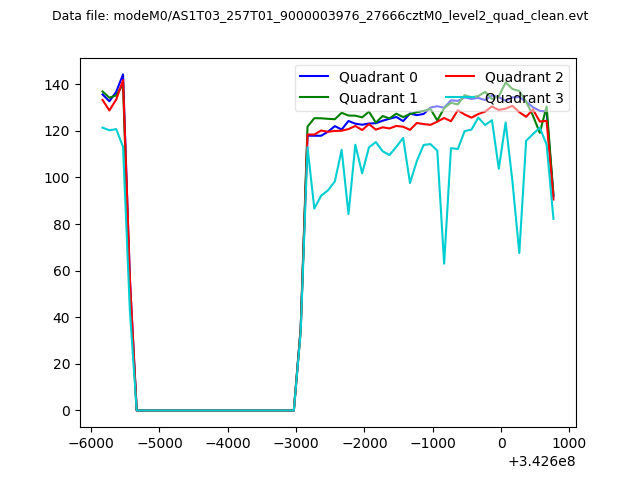 |
|
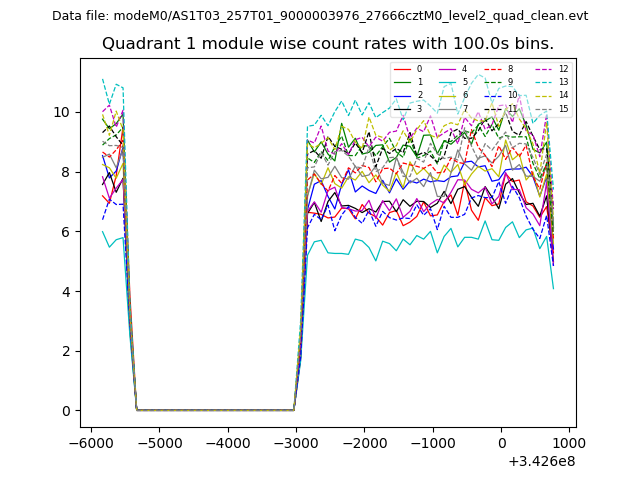
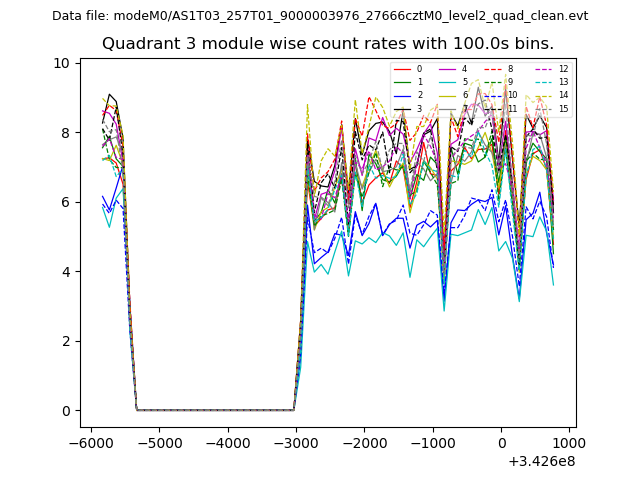
| Module-wise count rates for Quadrant A Data is divided into 100 sec bins |
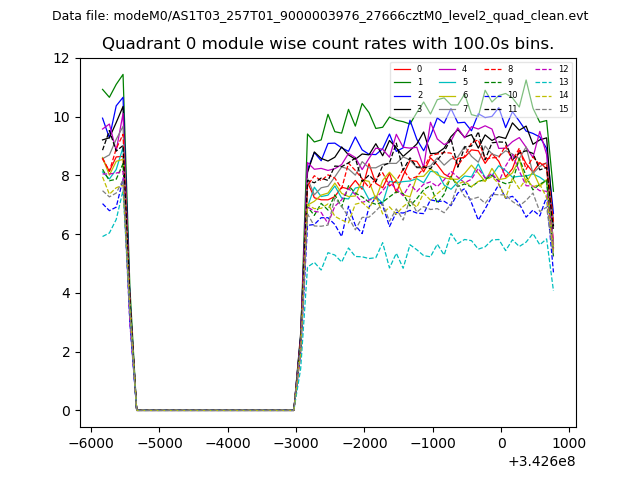 |
 |
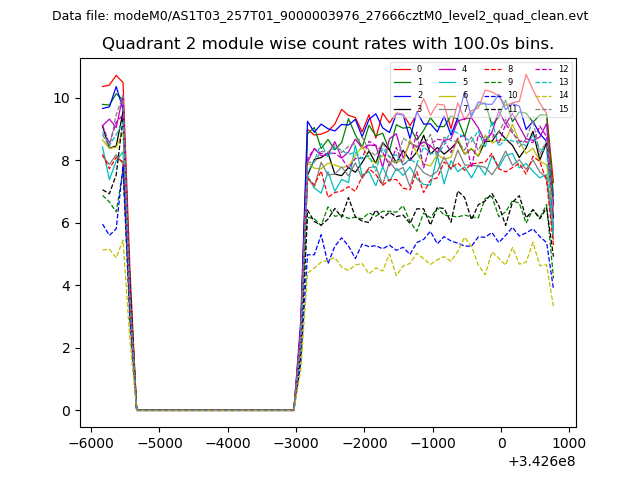
| Module-wise count rates for Quadrant B Data is divided into 100 sec bins |
 |
 |
| Module-wise count rates for Quadrant C Data is divided into 100 sec bins |
 |
 |
| Module-wise count rates for Quadrant D Data is divided into 100 sec bins |
 |
 |
| Parameter | Plot |
|---|---|
| CZT HV Monitor | 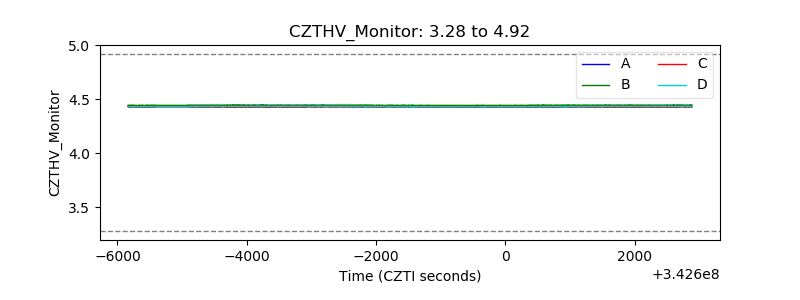 |
| D_VDD | 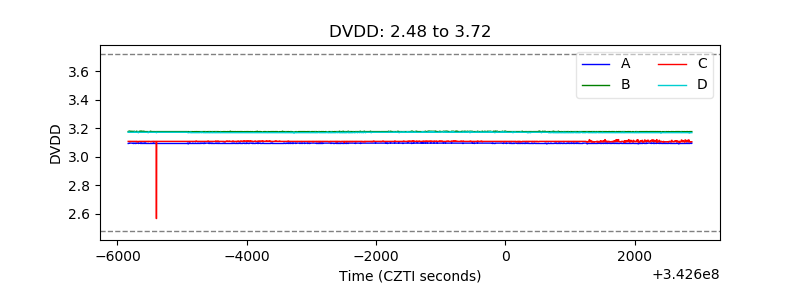 |
| Temperature 1 | 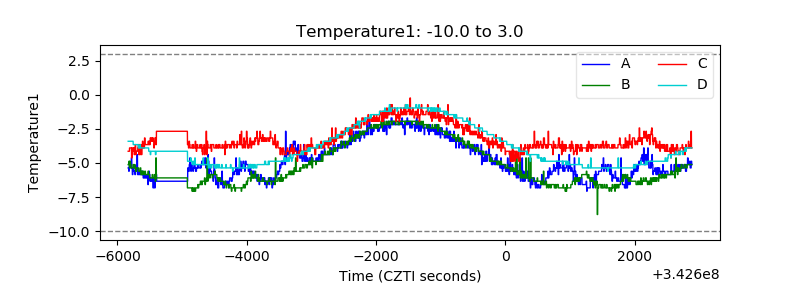 |
| Veto HV Monitor | 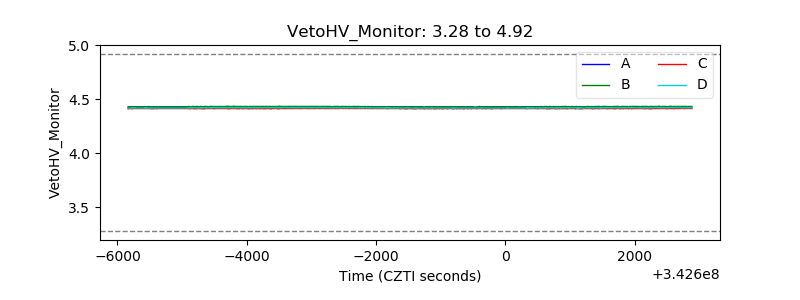 |
| Veto LLD | 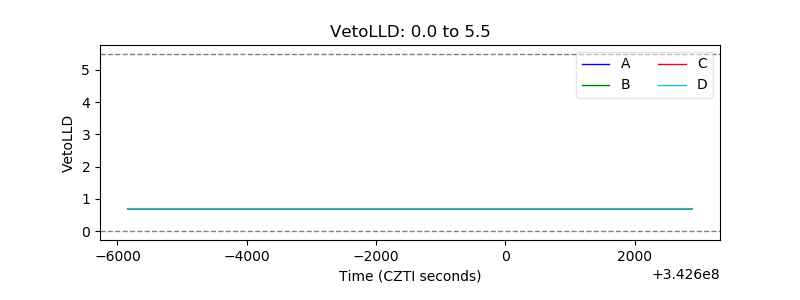 |
| Alpha Counter | 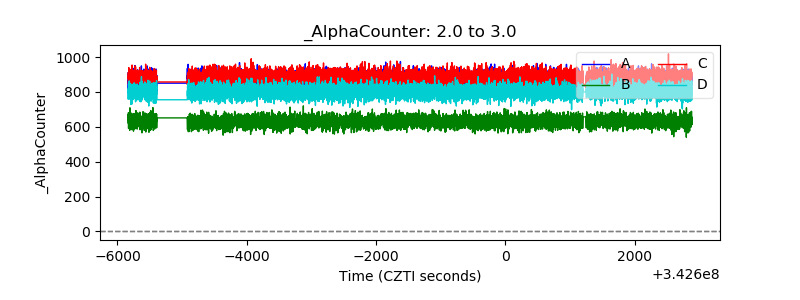 |
| _CPM_Rate | 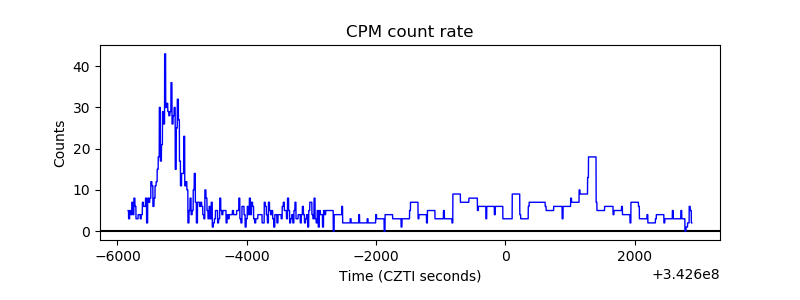 |
| CZT Counter | 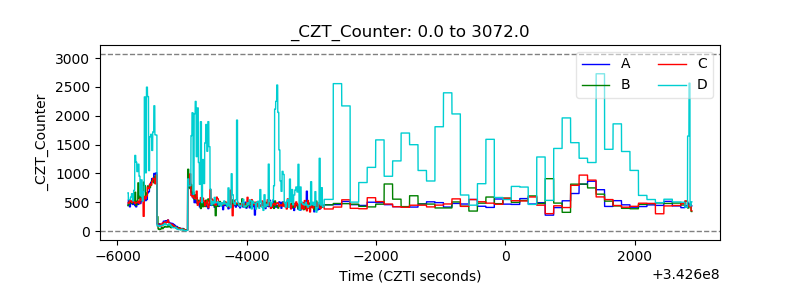 |
| +2.5 Volts monitor | 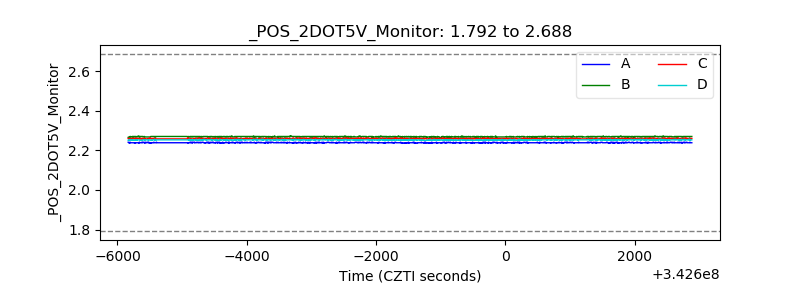 |
| +5 Volts monitor | 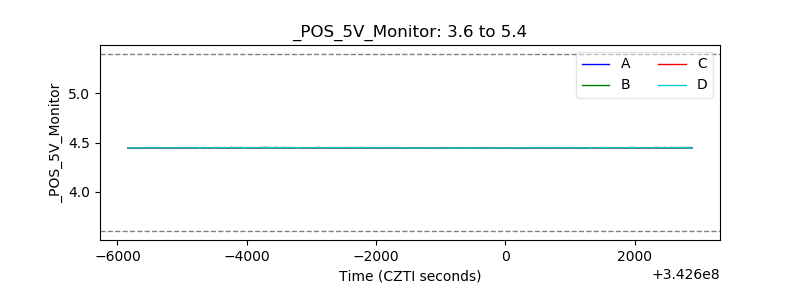 |
| _ROLL_ROT | 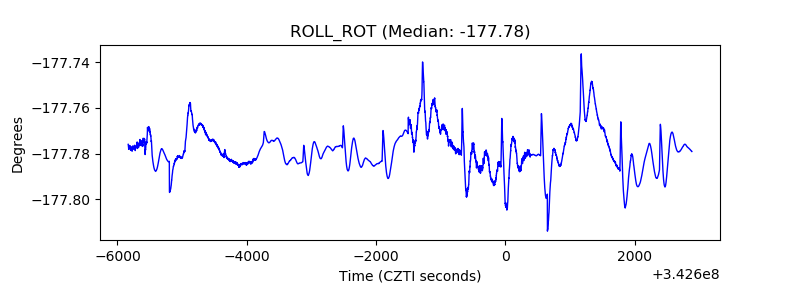 |
| _Roll_DEC |  |
| _Roll_RA | 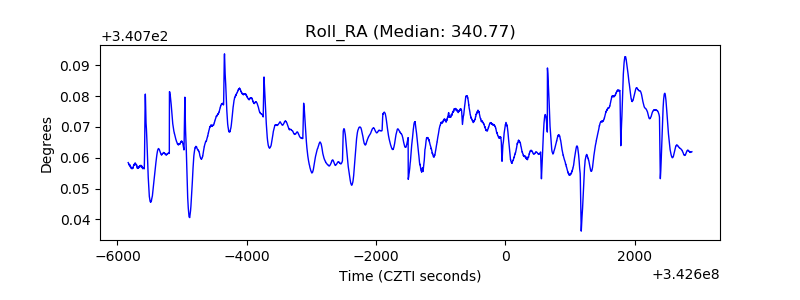 |
| Veto Counter | 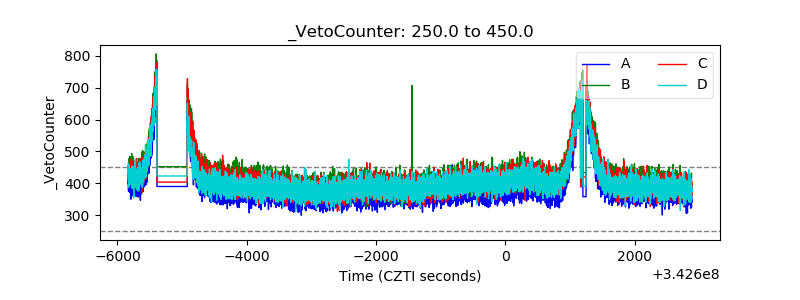 |