| Param | Original file | Final file |
|---|---|---|
| Filename | modeM0/AS1T03_257T01_9000003976_27667cztM0_level2.evt | modeM0/AS1T03_257T01_9000003976_27667cztM0_level2_quad_clean.evt |
| Size (bytes) | 699,534,720 | 85,109,760 |
| Size | 667.1 MB | 81.2 MB |
| Events in quadrant A | 3,863,285 | 520,552 |
| Events in quadrant B | 4,143,500 | 526,736 |
| Events in quadrant C | 3,961,086 | 504,571 |
| Events in quadrant D | 8,676,213 | 470,117 |
| Mode M9 | |||
|---|---|---|---|
| Quadrant | BADHDUFLAG | Total packets | Discarded packets |
| A | 0 | 4 | 0 |
| B | 0 | 4 | 0 |
| C | 0 | 4 | 0 |
| D | 0 | 4 | 0 |
| Mode M0 | |||
|---|---|---|---|
| Quadrant | BADHDUFLAG | Total packets | Discarded packets |
| A | 0 | 16662 | 0 |
| B | 0 | 17373 | 0 |
| C | 0 | 16770 | 0 |
| D | 0 | 31196 | 0 |
| Quadrant | Total seconds | Saturated seconds | Saturation percentage |
|---|---|---|---|
| A | 7992 | 323 | 4.041542% |
| B | 7993 | 434 | 5.429751% |
| C | 7993 | 349 | 4.366321% |
| D | 7993 | 1807 | 22.607281% |
Noise dominated data is calculated using 1-second bins in cleaned event files. If a bin has >2000 counts, and if more than 50% of those come from <1% of pixels, then it is considered to be noise-dominated and hence unusable.
| Quadrant | # 1 sec bins | Bins with >0 counts | Bins with >2000 counts | High rate bins dominated by noise | Noise dominated (total time) | Noise dominated (detector-on time) | Marked lightcurve |
|---|---|---|---|---|---|---|---|
| A | 8292 | 7992 | 2 | 2 | 0.02% | 0.03% | 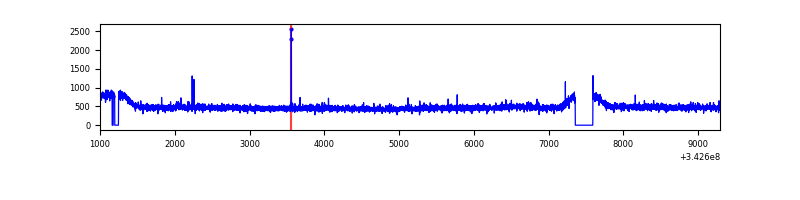 |
| B | 8293 | 7993 | 35 | 35 | 0.42% | 0.44% | 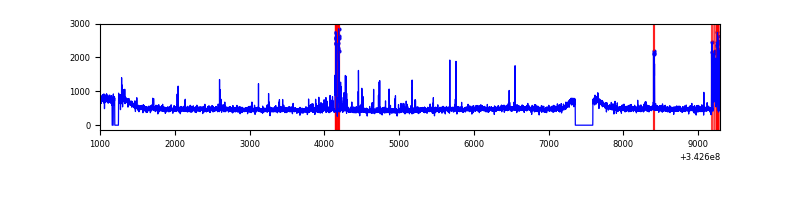 |
| C | 8293 | 7993 | 0 | 0 | 0.00% | 0.00% | 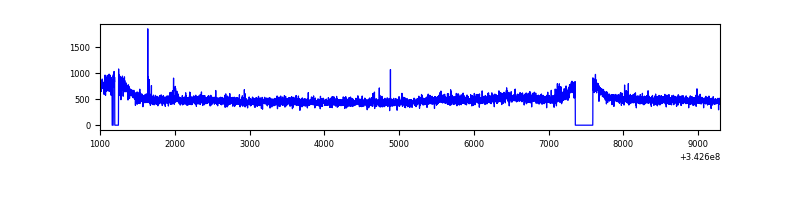 |
| D | 8293 | 7993 | 1441 | 1441 | 17.38% | 18.03% | 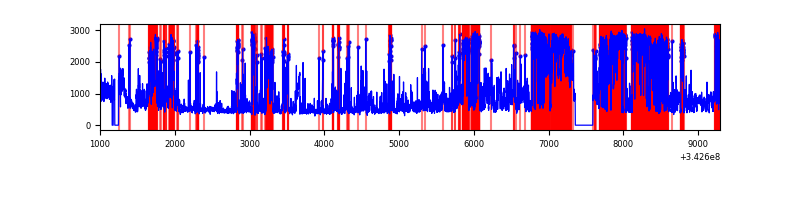 |
Top three noisy pixels from each quadrant. If the there are fewer than three noisy pixels in the level2.evt file, extra rows are filled as -1
| Pixel properties | Quadrant properties | ||||||
|---|---|---|---|---|---|---|---|
| Quadrant | DetID | PixID | Counts | Sigma | Mean | Median | Sigma |
| A | 15 | 174 | 18730 | 87.54 | 994 | 971 | 202.9 |
| A | 13 | 254 | 12810 | 58.36 | 994 | 971 | 202.9 |
| A | 3 | 137 | 10310 | 46.04 | 994 | 971 | 202.9 |
| B | 10 | 245 | 239054 | 1235.38 | 986 | 957 | 192.7 |
| B | 12 | 111 | 24330 | 121.27 | 986 | 957 | 192.7 |
| B | 11 | 111 | 22156 | 109.99 | 986 | 957 | 192.7 |
| C | 14 | 238 | 150660 | 663.33 | 955 | 958 | 225.7 |
| C | 3 | 233 | 62781 | 273.94 | 955 | 958 | 225.7 |
| C | 8 | 128 | 13461 | 55.4 | 955 | 958 | 225.7 |
| D | 1 | 52 | 5334156 | 25790.99 | 860 | 832 | 206.8 |
| D | 2 | 250 | 41934 | 198.76 | 860 | 832 | 206.8 |
| D | 2 | 234 | 38048 | 179.97 | 860 | 832 | 206.8 |
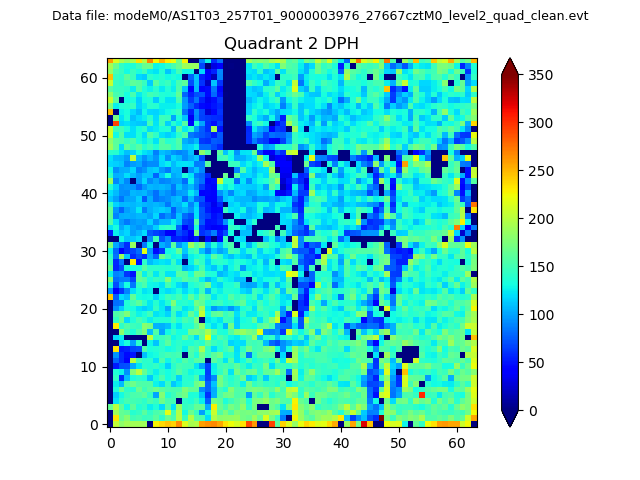
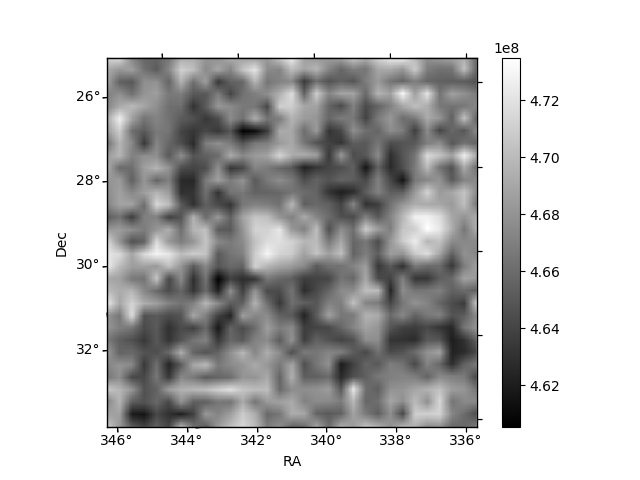
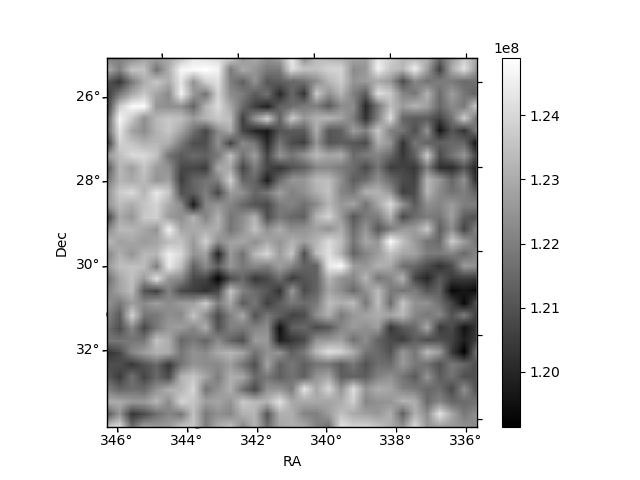
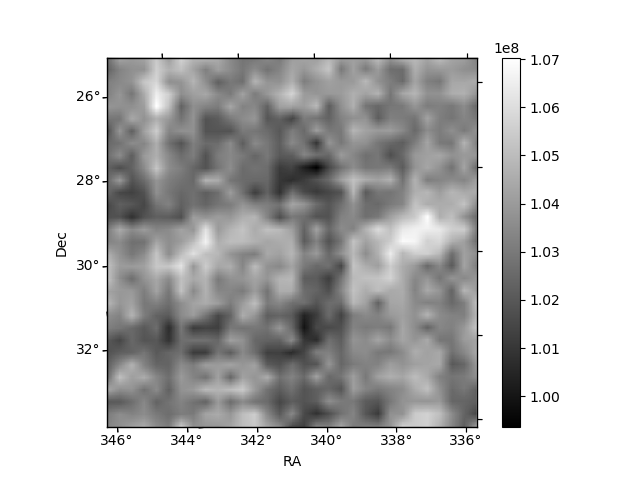
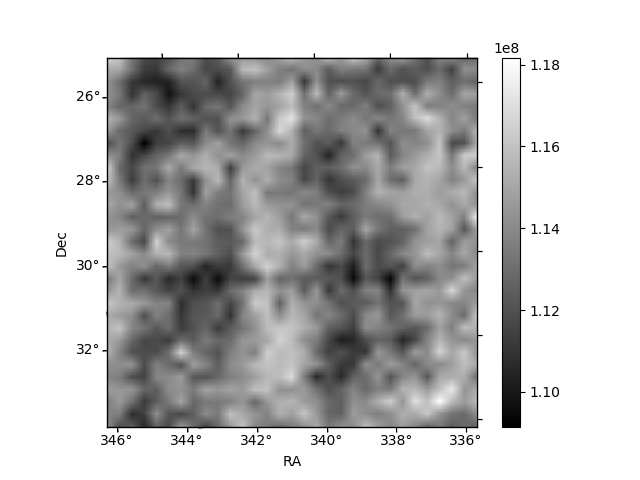
Histogram calculated using DETX and DETY for each event in the final _common_clean file
| Quadrant A | 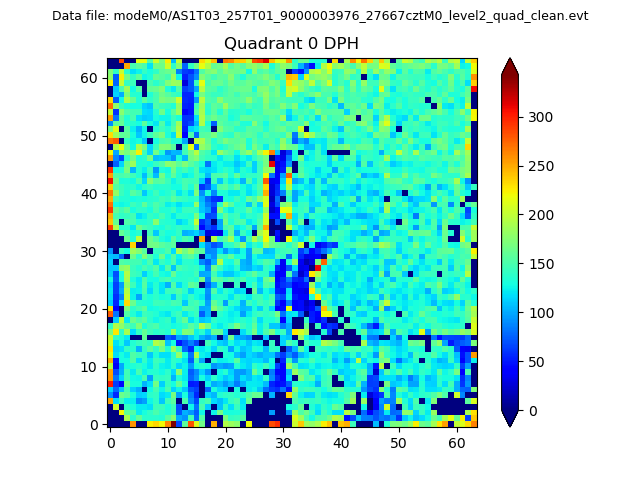 |
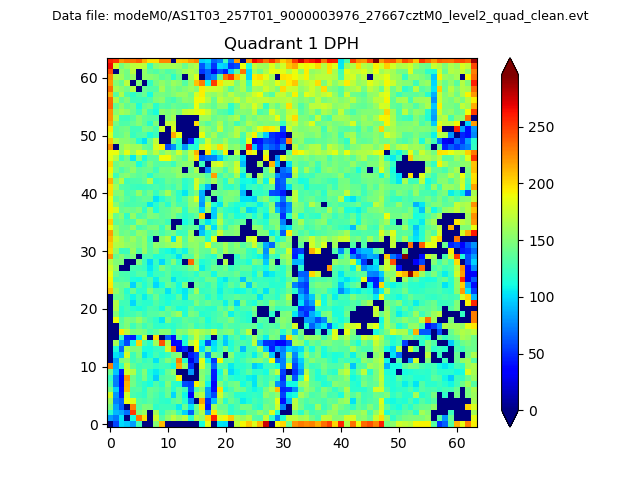 |
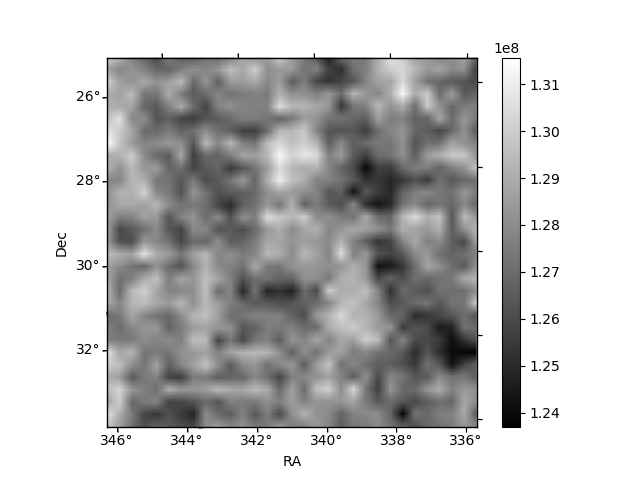
Quadrant B |
|---|---|---|---|
| Quadrant D | 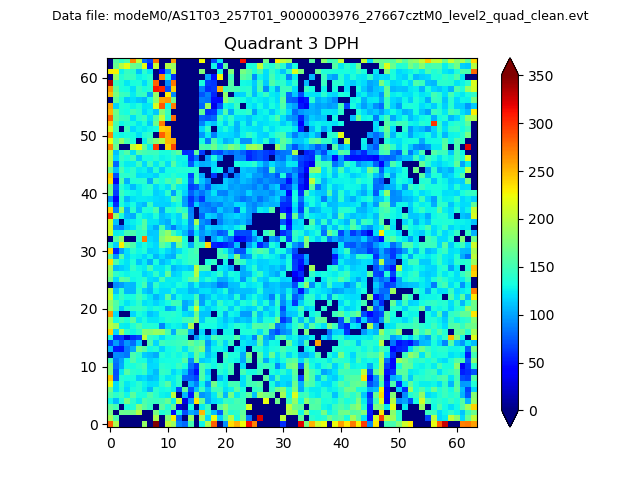 |
 |
Quadrant C |
| Plot type | Count rate plots | Images |
|---|---|---|
| Comparison with Poisson distribution Blue bars denote a histogram of data divided into 1 sec bins. Red curve is a Poisson curve with rate = median count rate of data. |
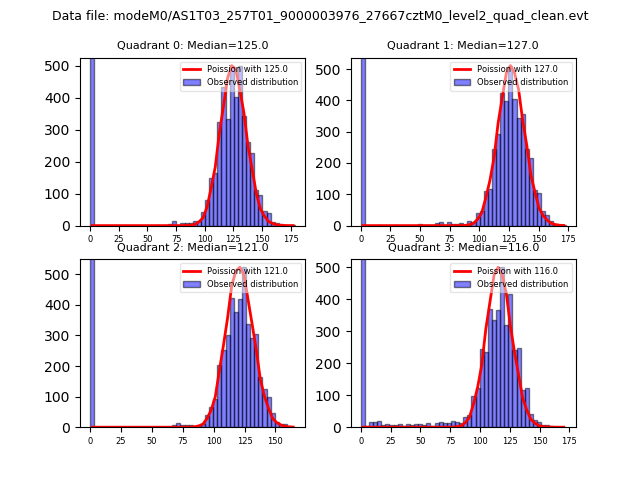 |
 |
| Quadrant-wise count rates Data is divided into 100 sec bins |
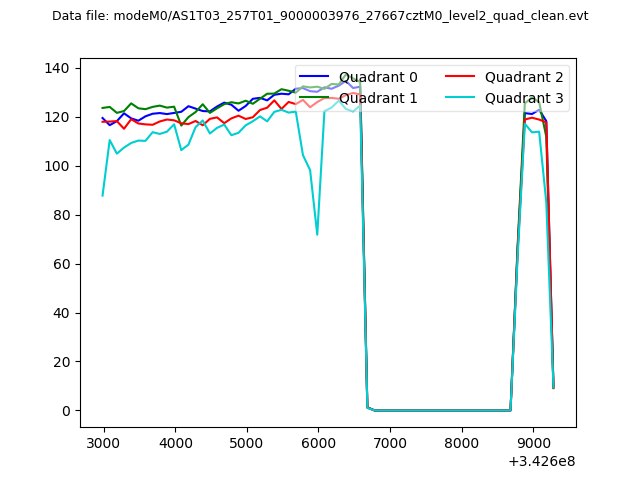 |
|
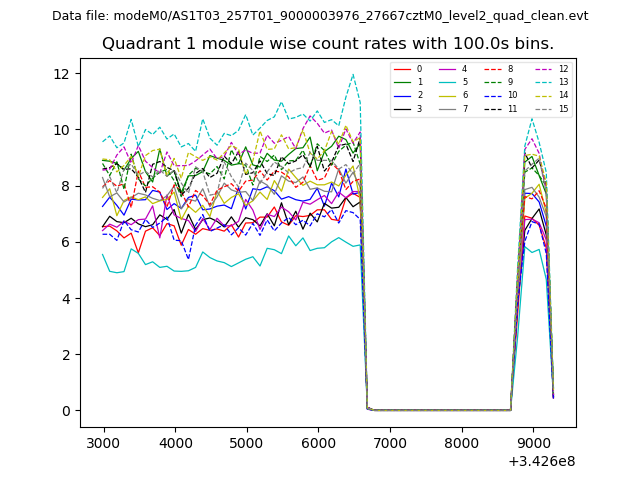
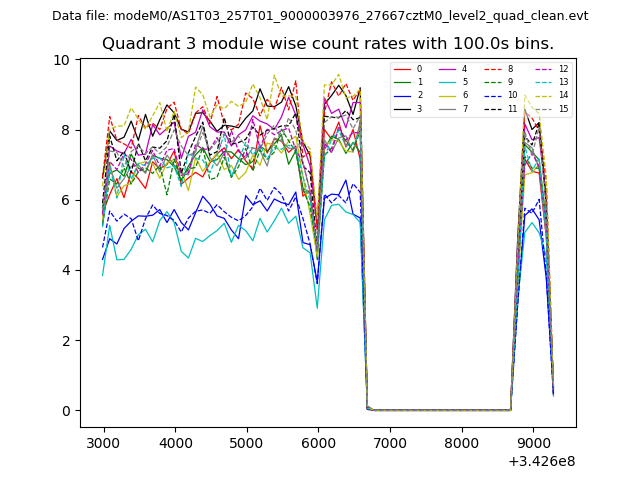
| Module-wise count rates for Quadrant A Data is divided into 100 sec bins |
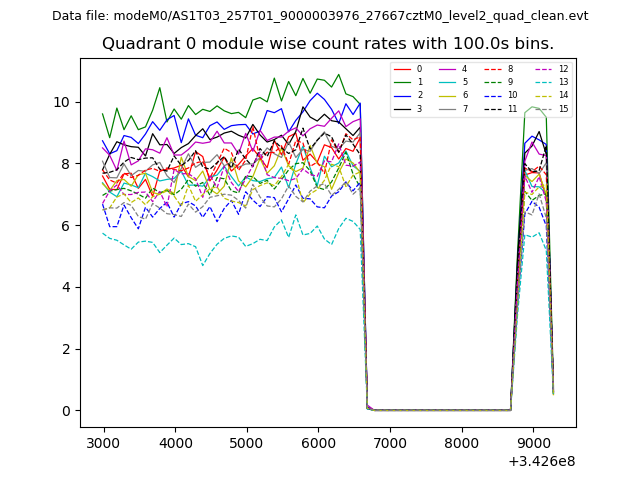 |
 |
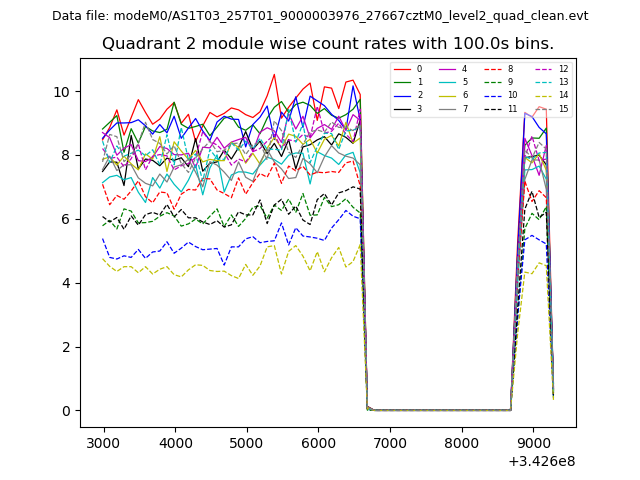
| Module-wise count rates for Quadrant B Data is divided into 100 sec bins |
 |
 |
| Module-wise count rates for Quadrant C Data is divided into 100 sec bins |
 |
 |
| Module-wise count rates for Quadrant D Data is divided into 100 sec bins |
 |
 |
| Parameter | Plot |
|---|---|
| CZT HV Monitor | 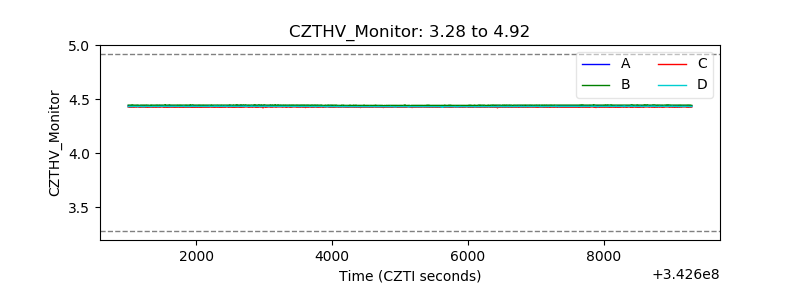 |
| D_VDD | 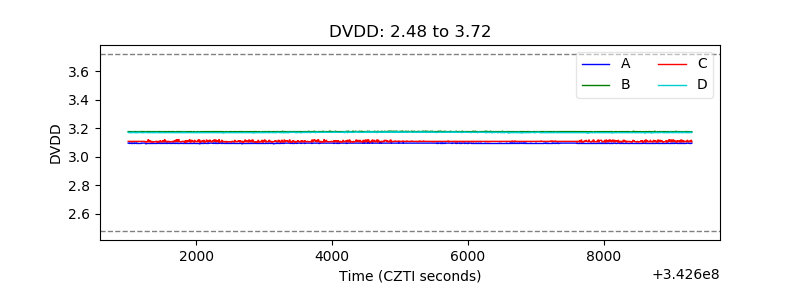 |
| Temperature 1 | 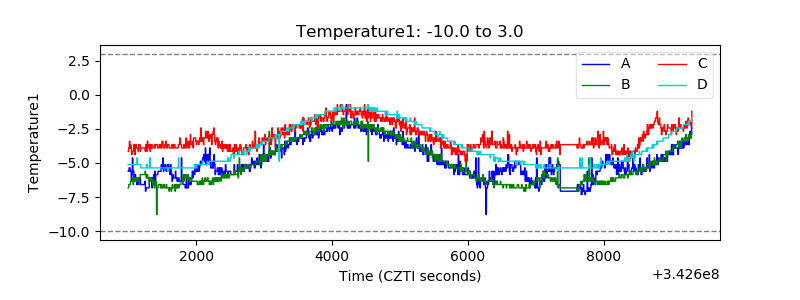 |
| Veto HV Monitor | 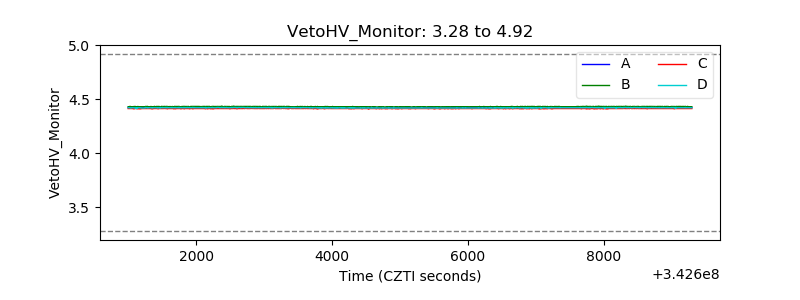 |
| Veto LLD | 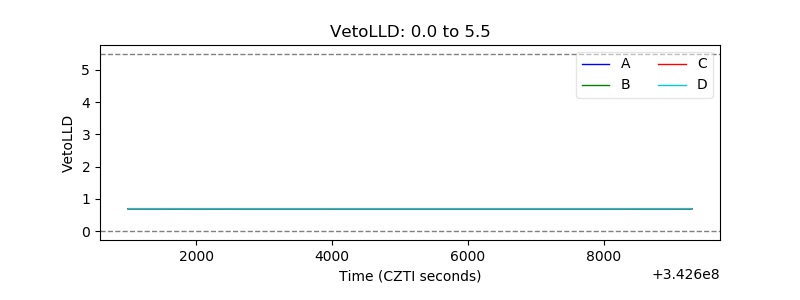 |
| Alpha Counter | 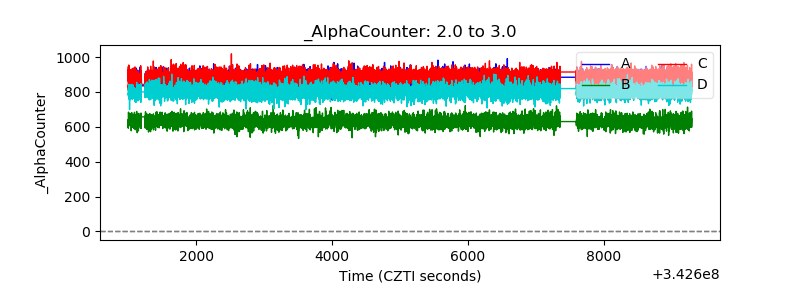 |
| _CPM_Rate | 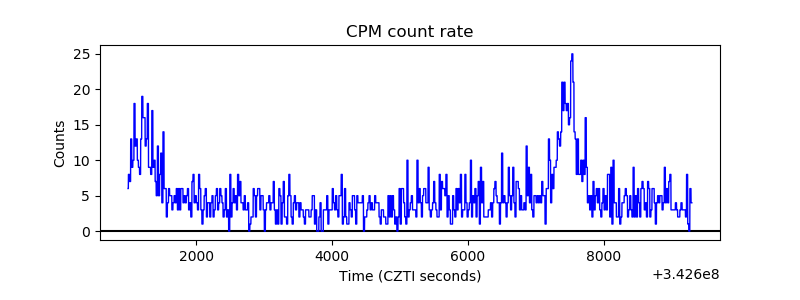 |
| CZT Counter | 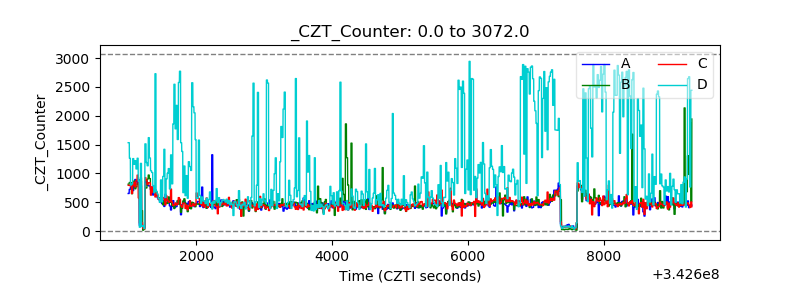 |
| +2.5 Volts monitor |  |
| +5 Volts monitor |  |
| _ROLL_ROT | 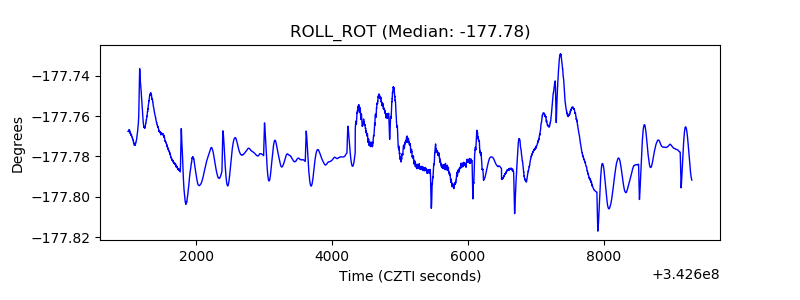 |
| _Roll_DEC | 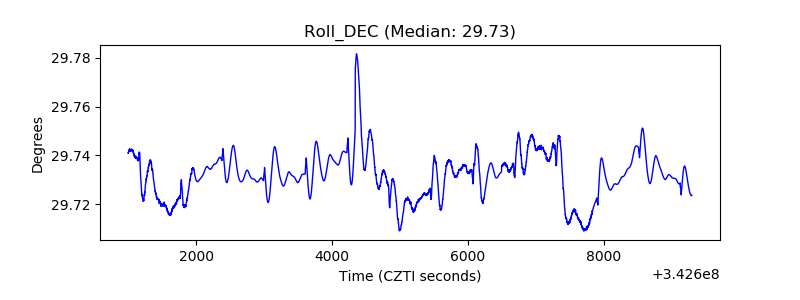 |
| _Roll_RA | 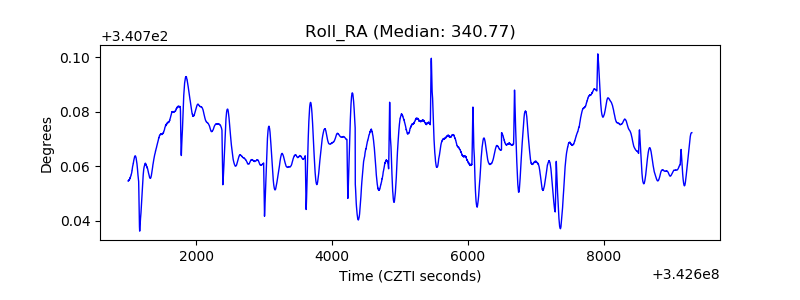 |
| Veto Counter | 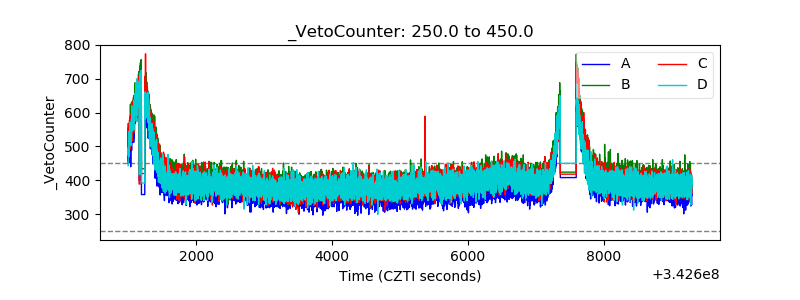 |