| Param | Original file | Final file |
|---|---|---|
| Filename | modeM0/AS1T03_257T01_9000003976_27669cztM0_level2.evt | modeM0/AS1T03_257T01_9000003976_27669cztM0_level2_quad_clean.evt |
| Size (bytes) | 490,901,760 | 67,224,960 |
| Size | 468.2 MB | 64.1 MB |
| Events in quadrant A | 2,211,937 | 458,006 |
| Events in quadrant B | 2,564,582 | 462,018 |
| Events in quadrant C | 2,246,367 | 442,062 |
| Events in quadrant D | 7,513,057 | 331,111 |
| Mode M0 | |||
|---|---|---|---|
| Quadrant | BADHDUFLAG | Total packets | Discarded packets |
| A | 0 | 9834 | 0 |
| B | 0 | 10688 | 0 |
| C | 0 | 9846 | 0 |
| D | 0 | 25679 | 0 |
| Quadrant | Total seconds | Saturated seconds | Saturation percentage |
|---|---|---|---|
| A | 4876 | 5 | 0.102543% |
| B | 4877 | 62 | 1.271273% |
| C | 4877 | 32 | 0.656141% |
| D | 4876 | 1950 | 39.991797% |
Noise dominated data is calculated using 1-second bins in cleaned event files. If a bin has >2000 counts, and if more than 50% of those come from <1% of pixels, then it is considered to be noise-dominated and hence unusable.
| Quadrant | # 1 sec bins | Bins with >0 counts | Bins with >2000 counts | High rate bins dominated by noise | Noise dominated (total time) | Noise dominated (detector-on time) | Marked lightcurve |
|---|---|---|---|---|---|---|---|
| A | 4876 | 4876 | 0 | 0 | 0.00% | 0.00% | 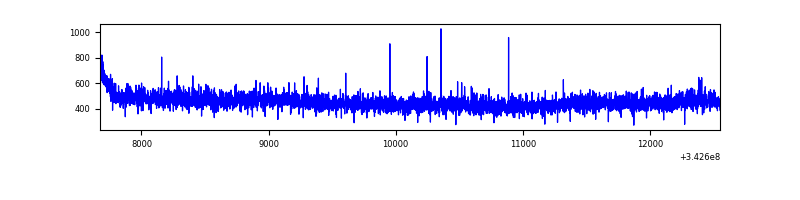 |
| B | 4877 | 4877 | 23 | 23 | 0.47% | 0.47% | 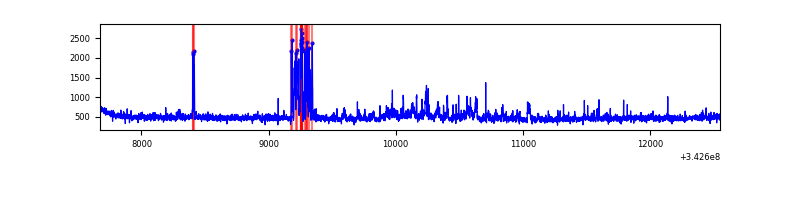 |
| C | 4877 | 4877 | 0 | 0 | 0.00% | 0.00% | 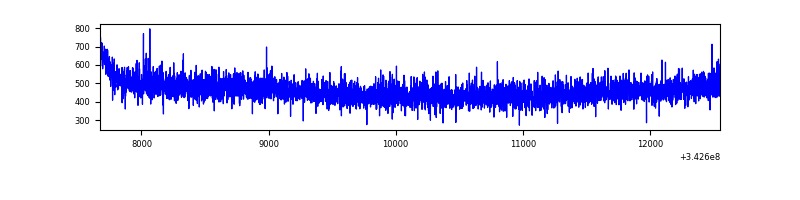 |
| D | 4876 | 4876 | 1907 | 1907 | 39.11% | 39.11% | 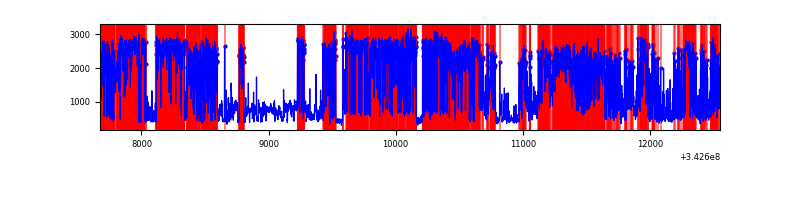 |
Top three noisy pixels from each quadrant. If the there are fewer than three noisy pixels in the level2.evt file, extra rows are filled as -1
| Pixel properties | Quadrant properties | ||||||
|---|---|---|---|---|---|---|---|
| Quadrant | DetID | PixID | Counts | Sigma | Mean | Median | Sigma |
| A | 13 | 254 | 7743 | 61.56 | 571 | 559 | 116.7 |
| A | 0 | 13 | 5747 | 44.46 | 571 | 559 | 116.7 |
| A | 3 | 137 | 5606 | 43.25 | 571 | 559 | 116.7 |
| B | 10 | 245 | 321499 | 2912.2 | 565 | 550 | 110.2 |
| B | 12 | 111 | 13471 | 117.24 | 565 | 550 | 110.2 |
| B | 11 | 111 | 12369 | 107.24 | 565 | 550 | 110.2 |
| C | 14 | 238 | 88784 | 678.08 | 545 | 549 | 130.1 |
| C | 3 | 233 | 15683 | 116.3 | 545 | 549 | 130.1 |
| C | 8 | 128 | 10189 | 74.08 | 545 | 549 | 130.1 |
| D | 1 | 52 | 5783282 | 56119.32 | 426 | 413 | 103.0 |
| D | 2 | 250 | 84890 | 819.8 | 426 | 413 | 103.0 |
| D | 2 | 234 | 20271 | 192.71 | 426 | 413 | 103.0 |
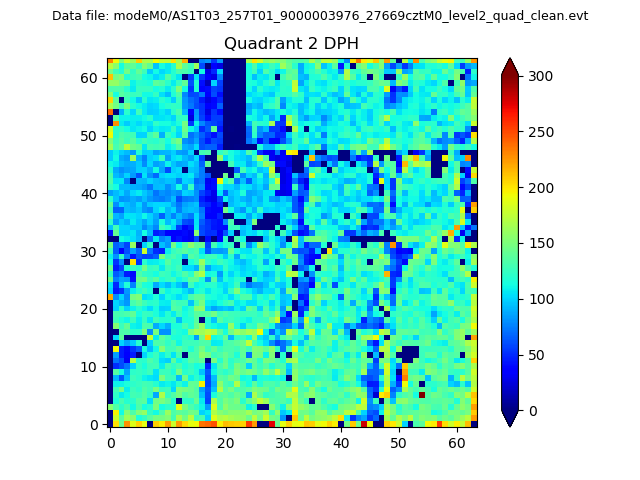
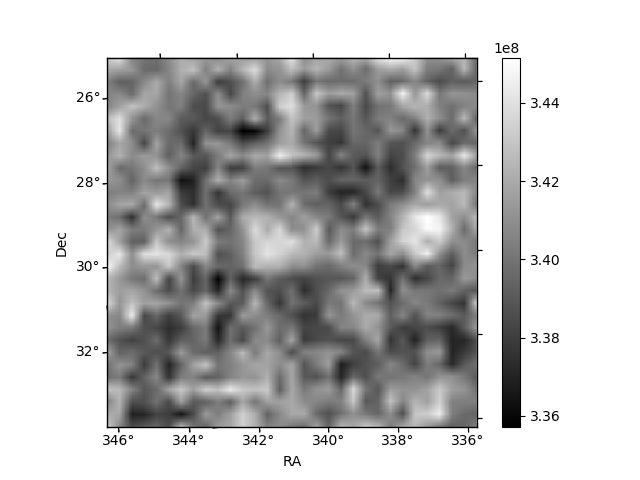
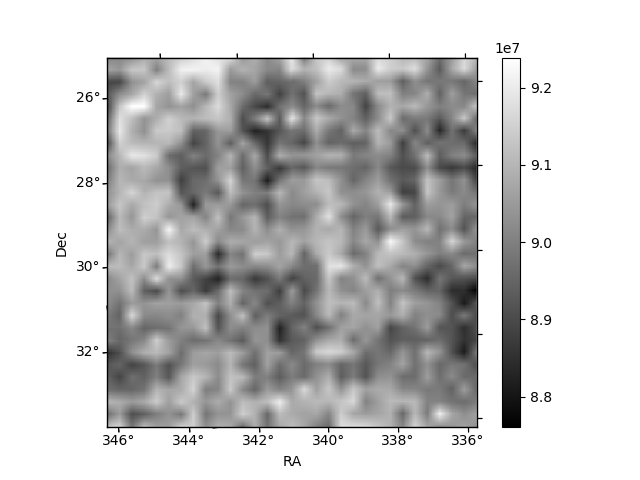
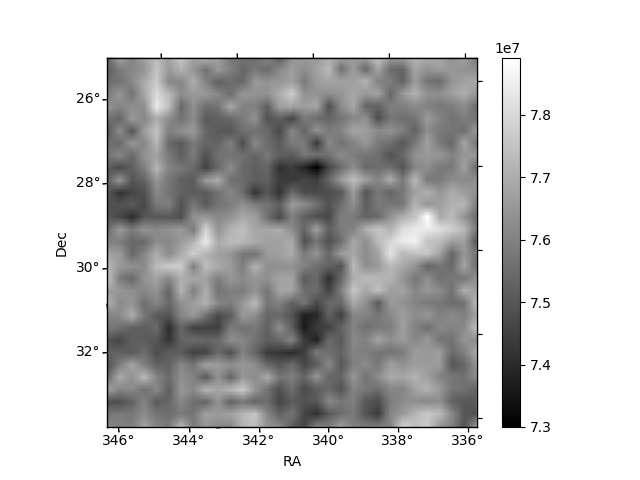
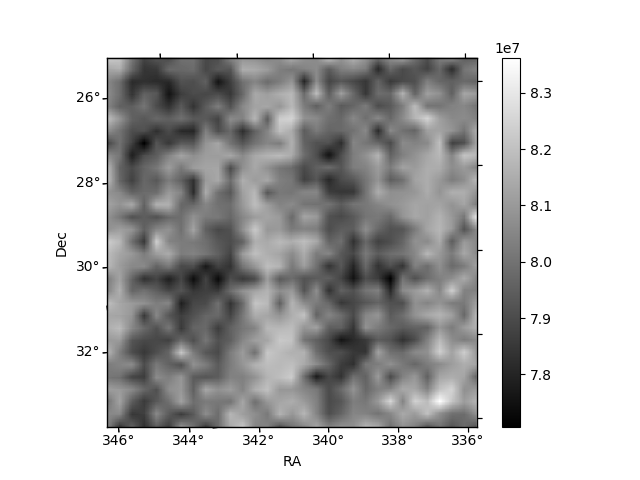
Histogram calculated using DETX and DETY for each event in the final _common_clean file
| Quadrant A | 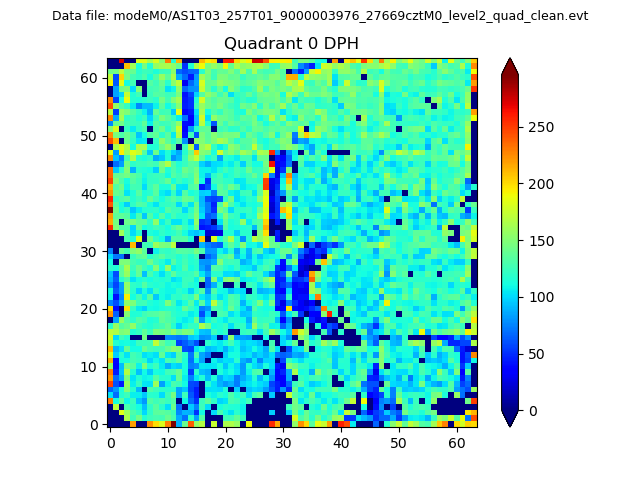 |
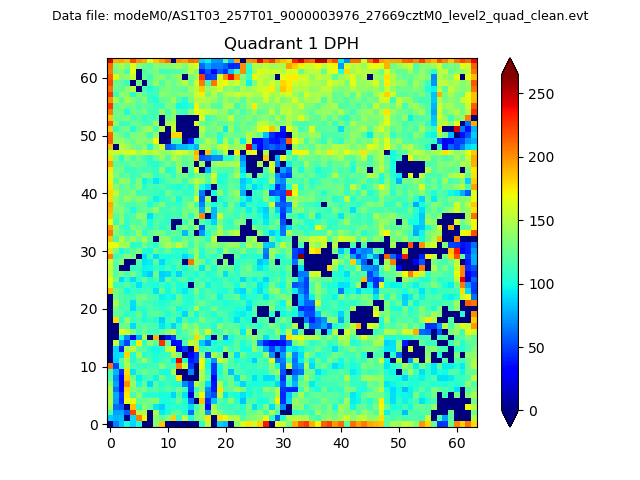 |
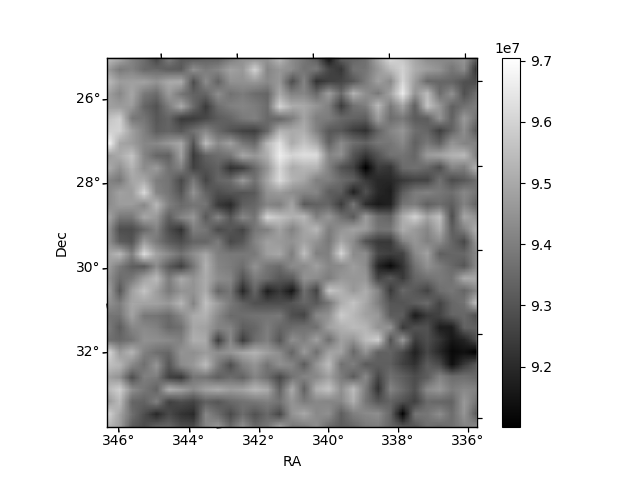
Quadrant B |
|---|---|---|---|
| Quadrant D | 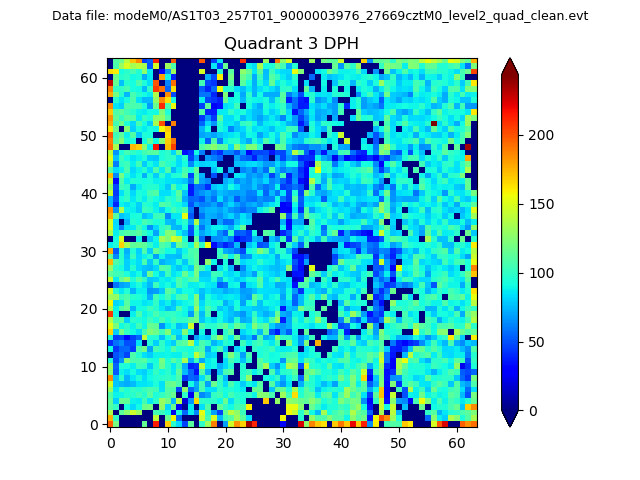 |
 |
Quadrant C |
| Plot type | Count rate plots | Images |
|---|---|---|
| Comparison with Poisson distribution Blue bars denote a histogram of data divided into 1 sec bins. Red curve is a Poisson curve with rate = median count rate of data. |
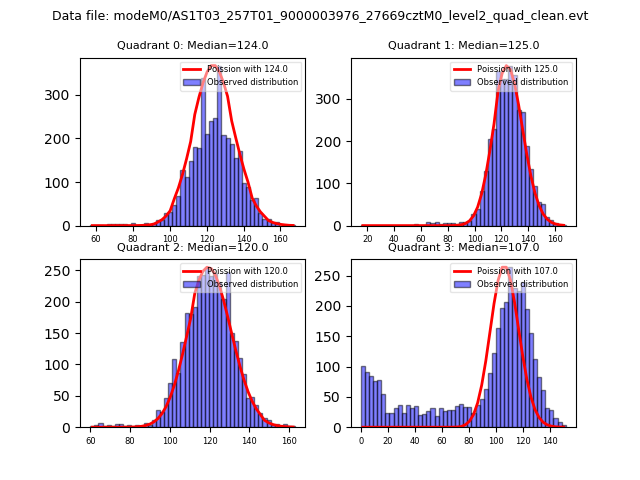 |
 |
| Quadrant-wise count rates Data is divided into 100 sec bins |
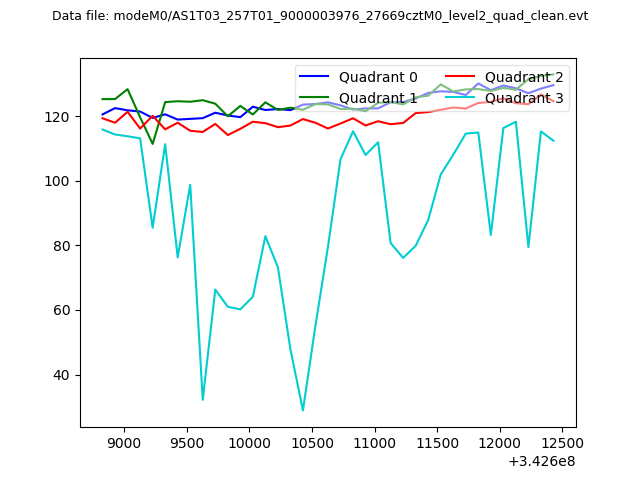 |
|
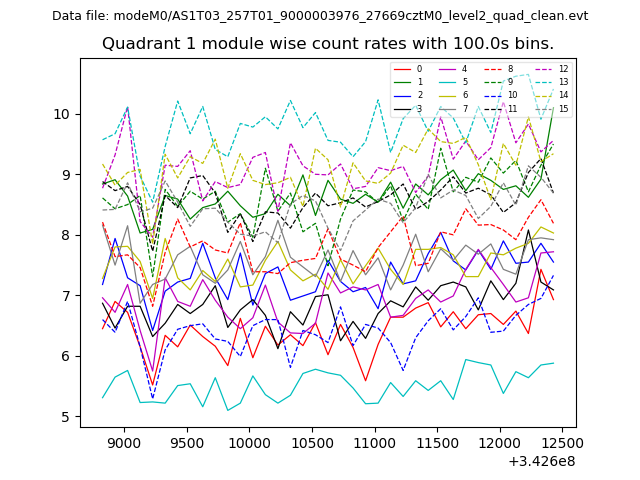
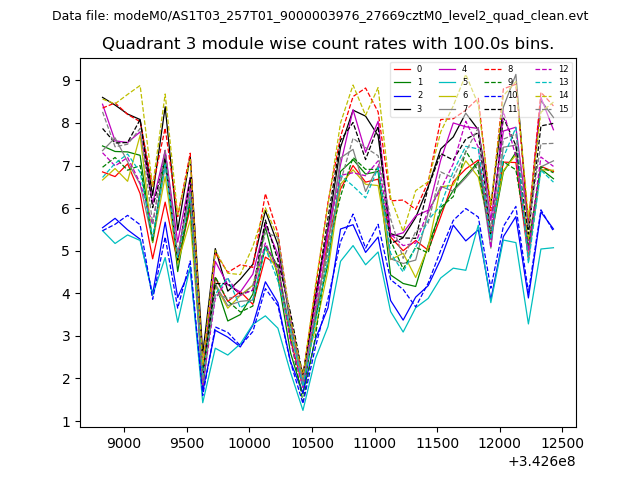
| Module-wise count rates for Quadrant A Data is divided into 100 sec bins |
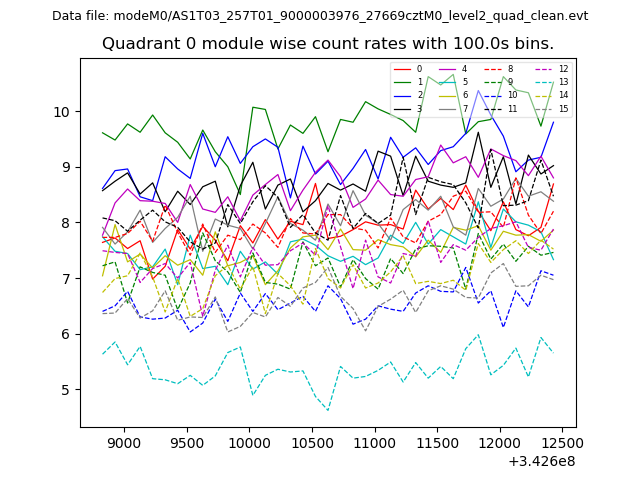 |
 |
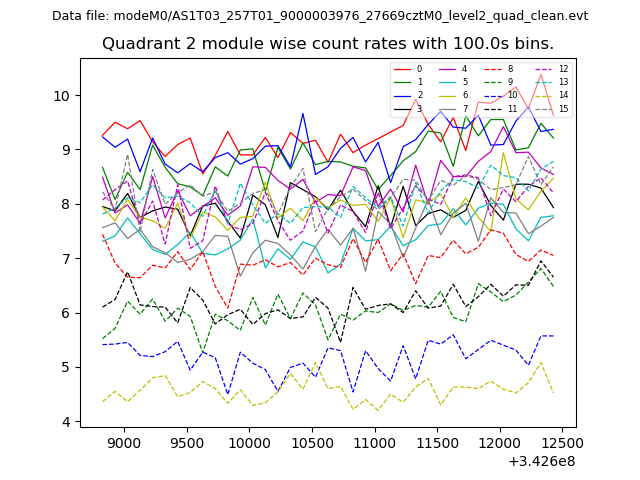
| Module-wise count rates for Quadrant B Data is divided into 100 sec bins |
 |
 |
| Module-wise count rates for Quadrant C Data is divided into 100 sec bins |
 |
 |
| Module-wise count rates for Quadrant D Data is divided into 100 sec bins |
 |
 |
| Parameter | Plot |
|---|---|
| CZT HV Monitor | 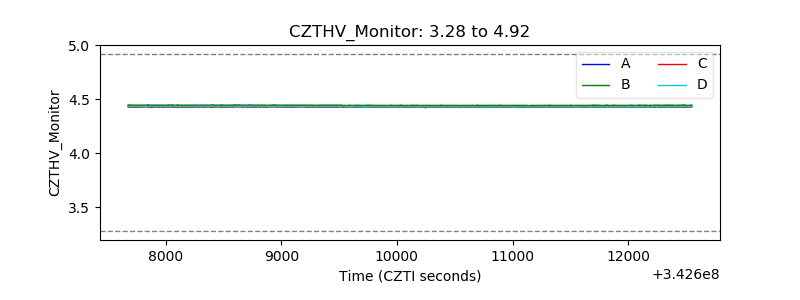 |
| D_VDD | 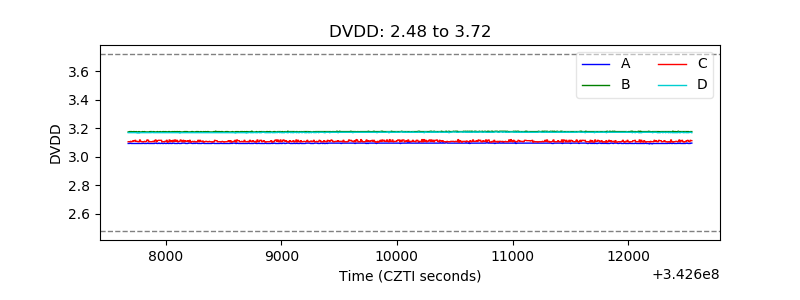 |
| Temperature 1 | 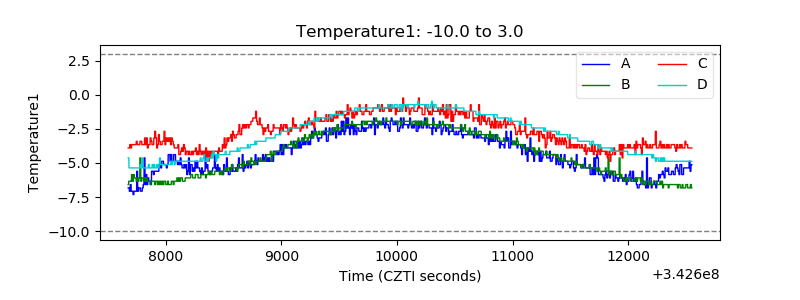 |
| Veto HV Monitor | 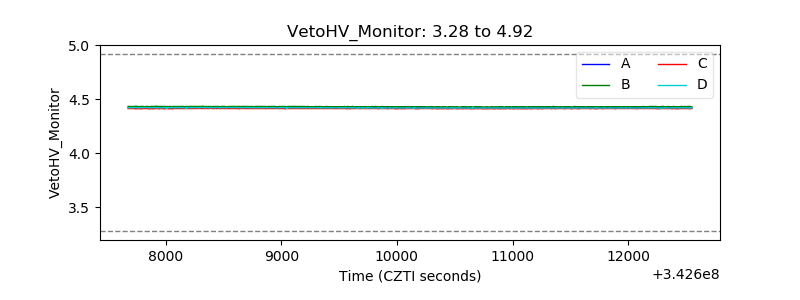 |
| Veto LLD | 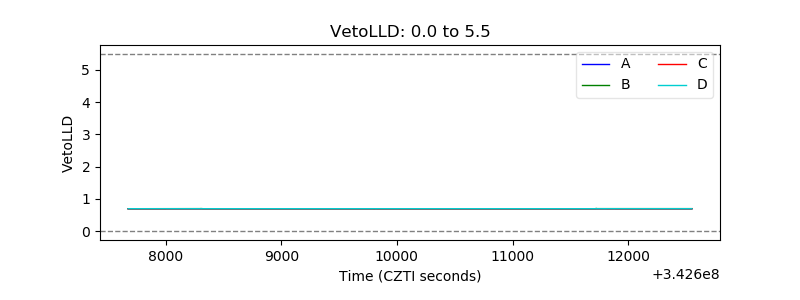 |
| Alpha Counter | 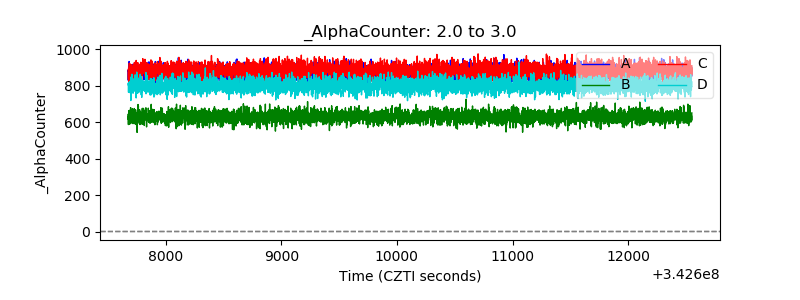 |
| _CPM_Rate | 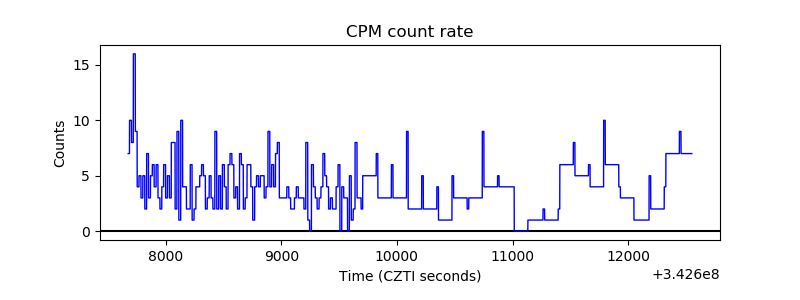 |
| CZT Counter | 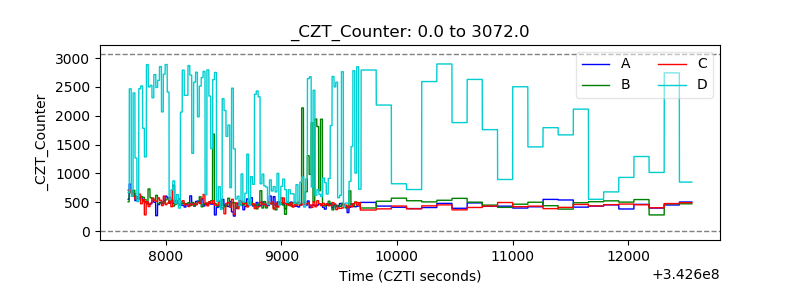 |
| +2.5 Volts monitor | 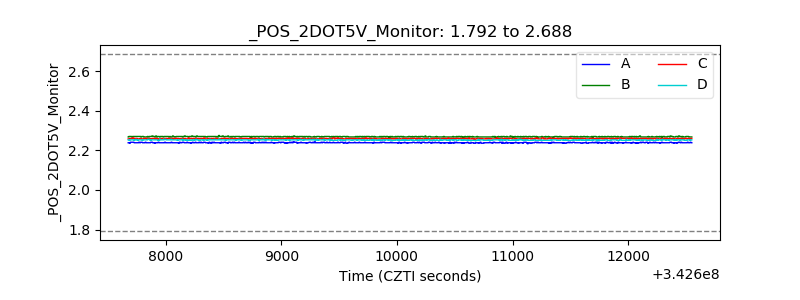 |
| +5 Volts monitor | 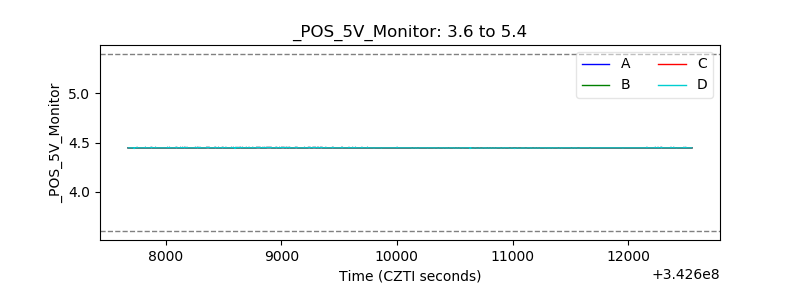 |
| _ROLL_ROT | 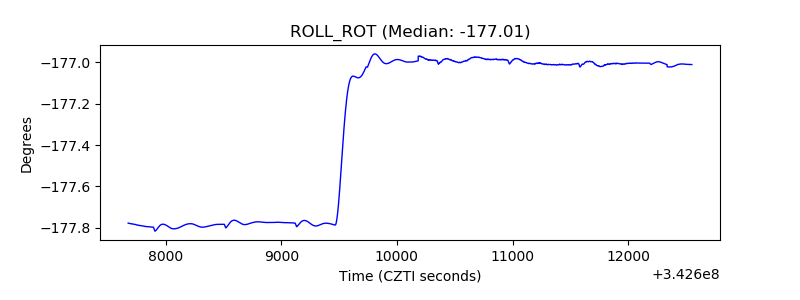 |
| _Roll_DEC | 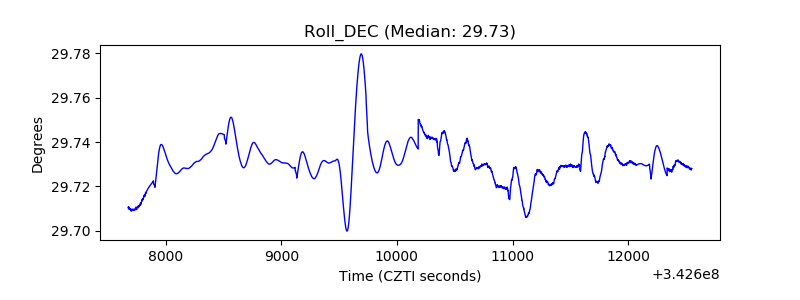 |
| _Roll_RA | 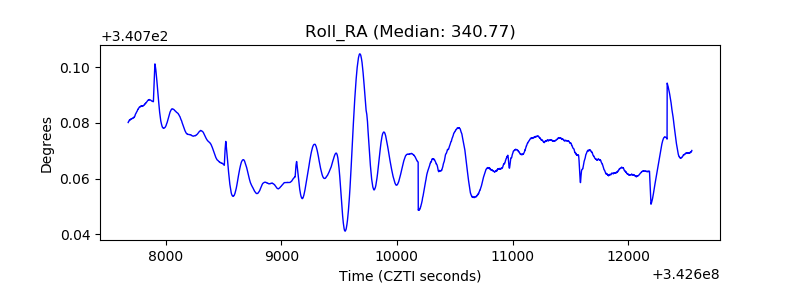 |
| Veto Counter | 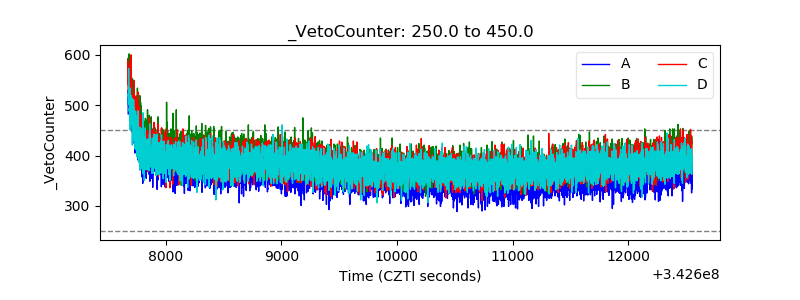 |