| Param | Original file | Final file |
|---|---|---|
| Filename | modeM0/AS1T03_257T01_9000003976_27670cztM0_level2.evt | modeM0/AS1T03_257T01_9000003976_27670cztM0_level2_quad_clean.evt |
| Size (bytes) | 1,186,384,320 | 194,696,640 |
| Size | 1.1 GB | 185.7 MB |
| Events in quadrant A | 6,952,872 | 1,258,572 |
| Events in quadrant B | 7,161,434 | 1,278,470 |
| Events in quadrant C | 7,107,846 | 1,220,259 |
| Events in quadrant D | 13,708,010 | 1,117,834 |
| Mode M9 | |||
|---|---|---|---|
| Quadrant | BADHDUFLAG | Total packets | Discarded packets |
| A | 0 | 19 | 0 |
| B | 0 | 19 | 0 |
| C | 0 | 19 | 0 |
| D | 0 | 19 | 0 |
| Mode M0 | |||
|---|---|---|---|
| Quadrant | BADHDUFLAG | Total packets | Discarded packets |
| A | 0 | 30283 | 0 |
| B | 0 | 30640 | 0 |
| C | 0 | 30370 | 0 |
| D | 0 | 50534 | 0 |
| Quadrant | Total seconds | Saturated seconds | Saturation percentage |
|---|---|---|---|
| A | 14794 | 170 | 1.149115% |
| B | 14795 | 177 | 1.196350% |
| C | 14795 | 216 | 1.459953% |
| D | 14795 | 1841 | 12.443393% |
Noise dominated data is calculated using 1-second bins in cleaned event files. If a bin has >2000 counts, and if more than 50% of those come from <1% of pixels, then it is considered to be noise-dominated and hence unusable.
| Quadrant | # 1 sec bins | Bins with >0 counts | Bins with >2000 counts | High rate bins dominated by noise | Noise dominated (total time) | Noise dominated (detector-on time) | Marked lightcurve |
|---|---|---|---|---|---|---|---|
| A | 16694 | 14794 | 0 | 0 | 0.00% | 0.00% | 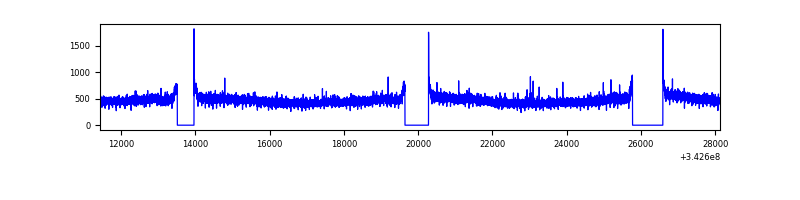 |
| B | 16695 | 14795 | 0 | 0 | 0.00% | 0.00% | 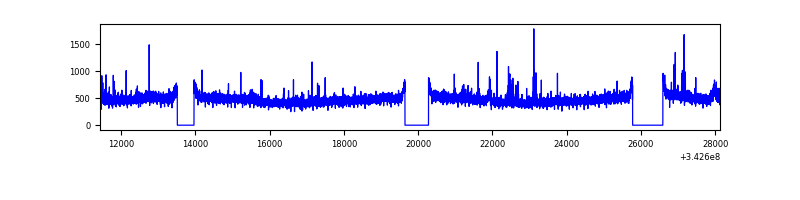 |
| C | 16695 | 14795 | 0 | 0 | 0.00% | 0.00% | 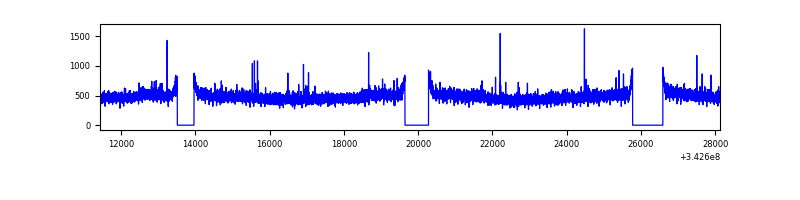 |
| D | 16695 | 14795 | 1599 | 1599 | 9.58% | 10.81% | 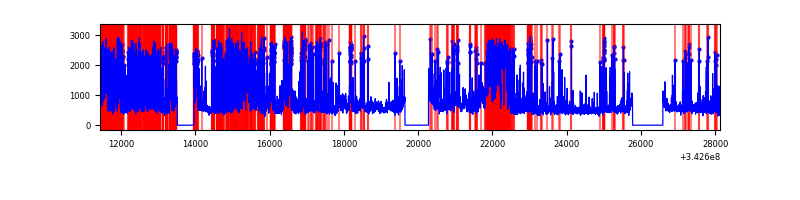 |
Top three noisy pixels from each quadrant. If the there are fewer than three noisy pixels in the level2.evt file, extra rows are filled as -1
| Pixel properties | Quadrant properties | ||||||
|---|---|---|---|---|---|---|---|
| Quadrant | DetID | PixID | Counts | Sigma | Mean | Median | Sigma |
| A | 13 | 254 | 25138 | 64.85 | 1791 | 1754 | 360.6 |
| A | 3 | 137 | 17657 | 44.1 | 1791 | 1754 | 360.6 |
| A | 8 | 192 | 15989 | 39.47 | 1791 | 1754 | 360.6 |
| B | 12 | 111 | 43223 | 123.2 | 1780 | 1730 | 336.8 |
| B | 4 | 200 | 41605 | 118.4 | 1780 | 1730 | 336.8 |
| B | 11 | 111 | 39065 | 110.85 | 1780 | 1730 | 336.8 |
| C | 14 | 238 | 273935 | 669.17 | 1723 | 1732 | 406.8 |
| C | 3 | 233 | 101271 | 244.7 | 1723 | 1732 | 406.8 |
| C | 13 | 61 | 11629 | 24.33 | 1723 | 1732 | 406.8 |
| D | 1 | 52 | 5401266 | 13699.0 | 1658 | 1616 | 394.2 |
| D | 12 | 227 | 1628833 | 4128.28 | 1658 | 1616 | 394.2 |
| D | 2 | 250 | 117603 | 294.26 | 1658 | 1616 | 394.2 |
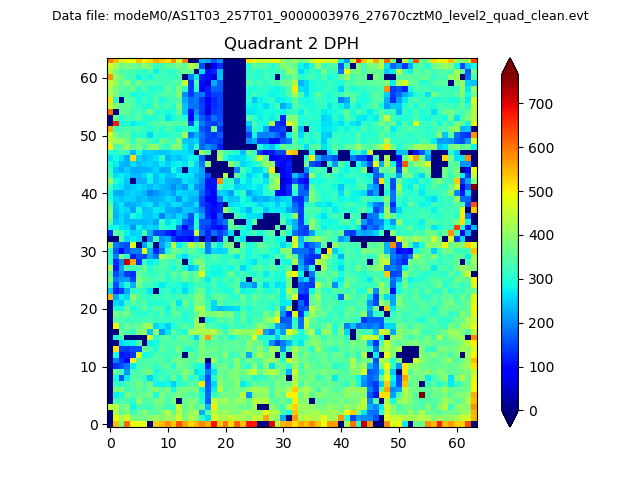
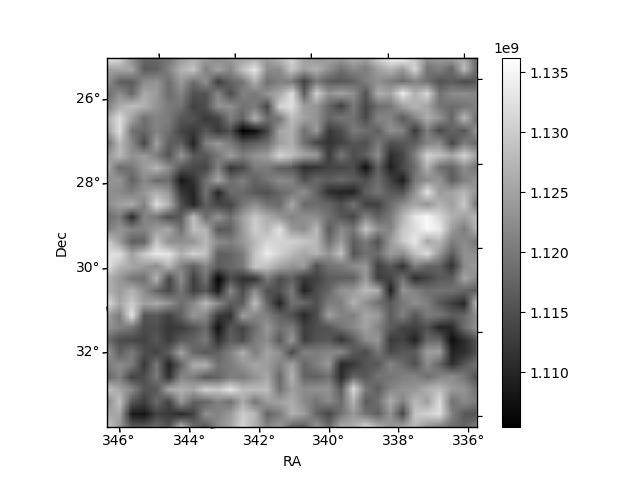
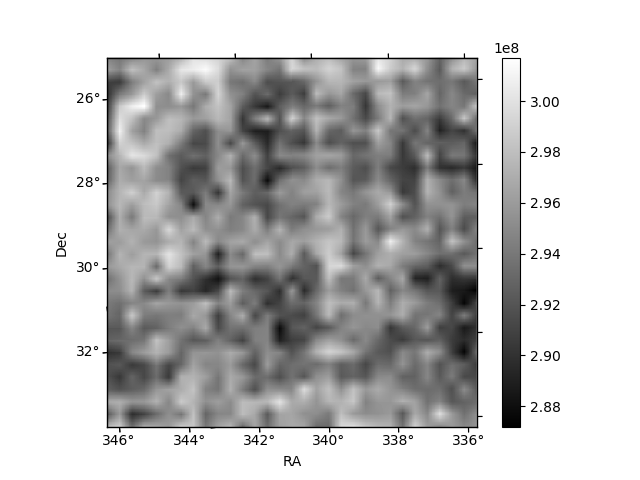
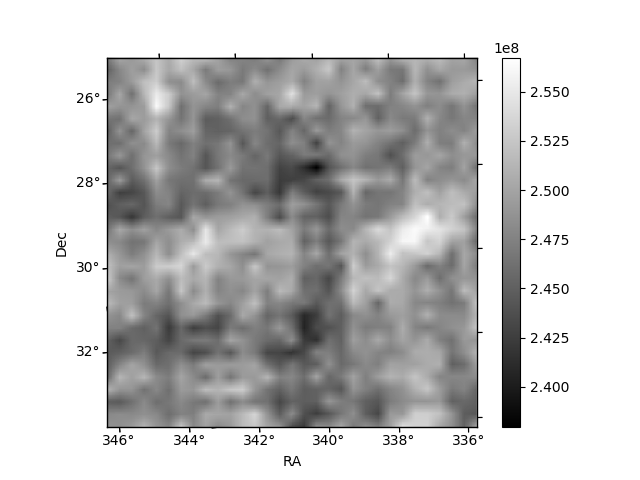
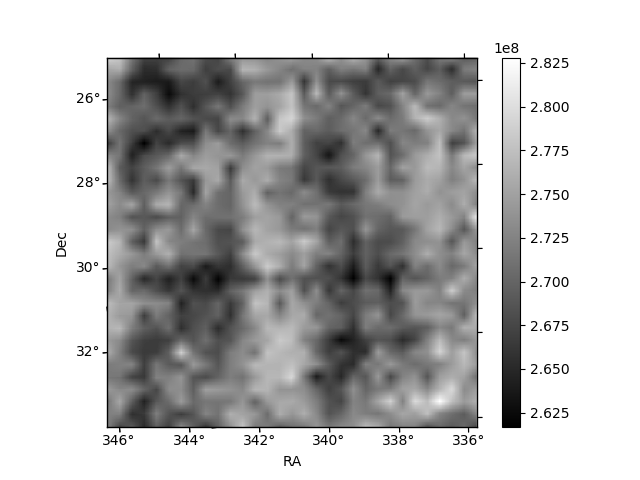
Histogram calculated using DETX and DETY for each event in the final _common_clean file
| Quadrant A | 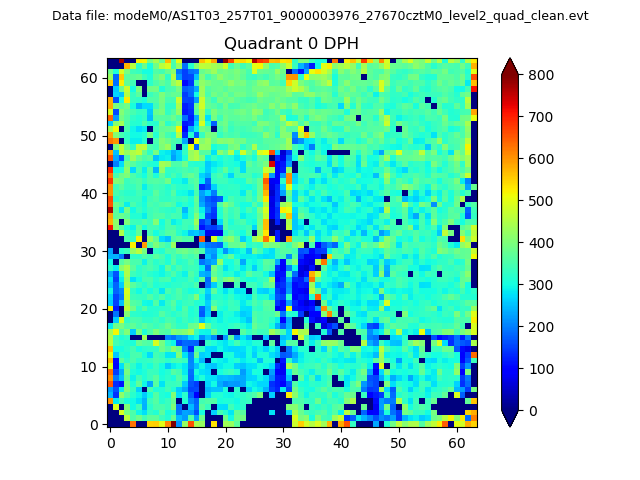 |
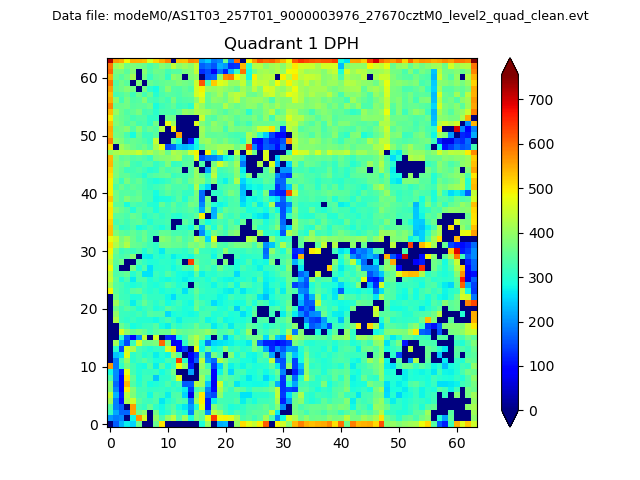 |
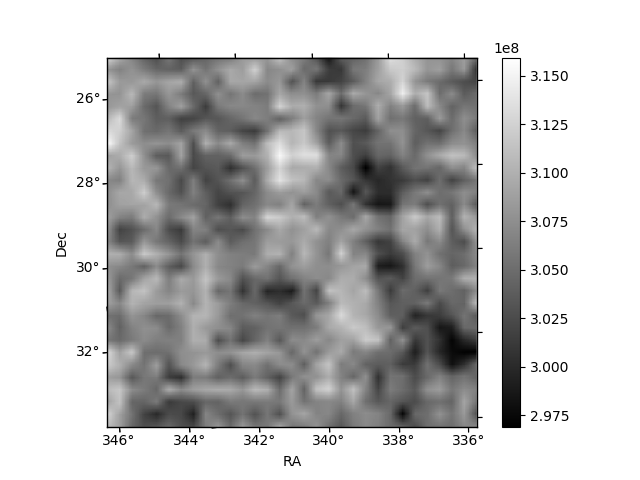
Quadrant B |
|---|---|---|---|
| Quadrant D | 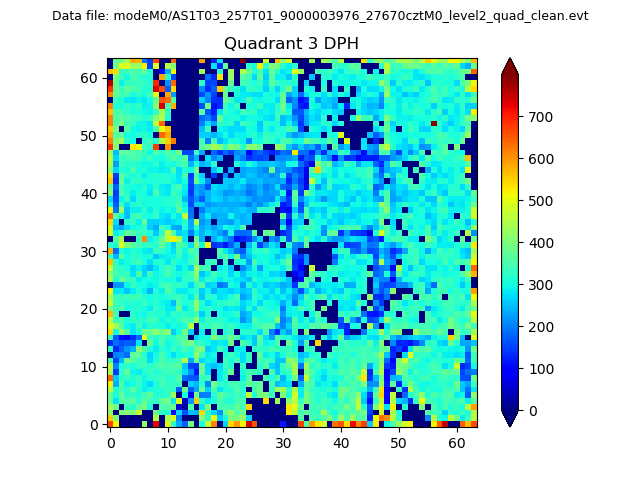 |
 |
Quadrant C |
| Plot type | Count rate plots | Images |
|---|---|---|
| Comparison with Poisson distribution Blue bars denote a histogram of data divided into 1 sec bins. Red curve is a Poisson curve with rate = median count rate of data. |
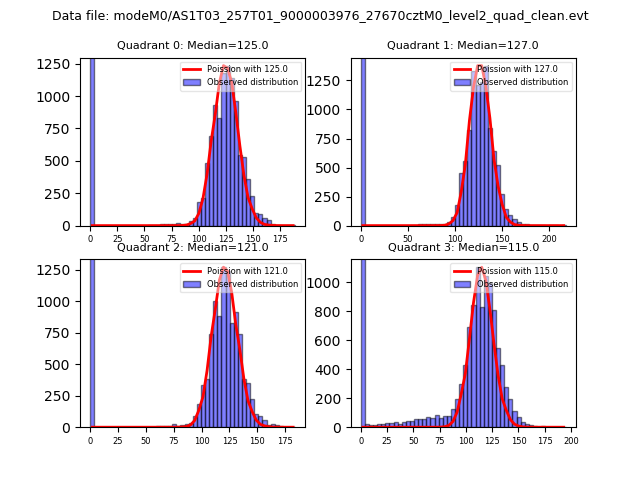 |
 |
| Quadrant-wise count rates Data is divided into 100 sec bins |
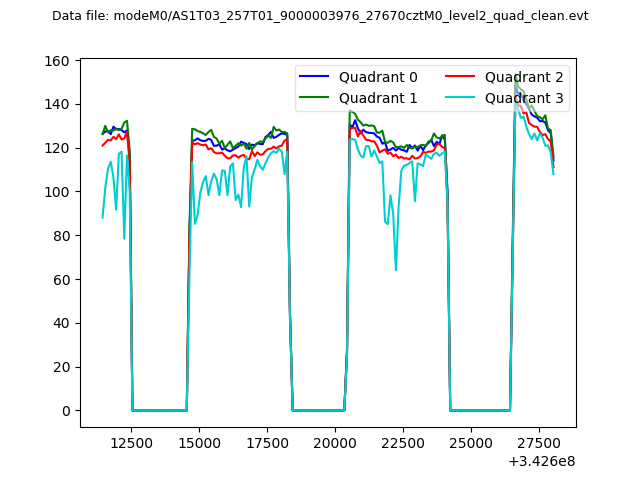 |
|
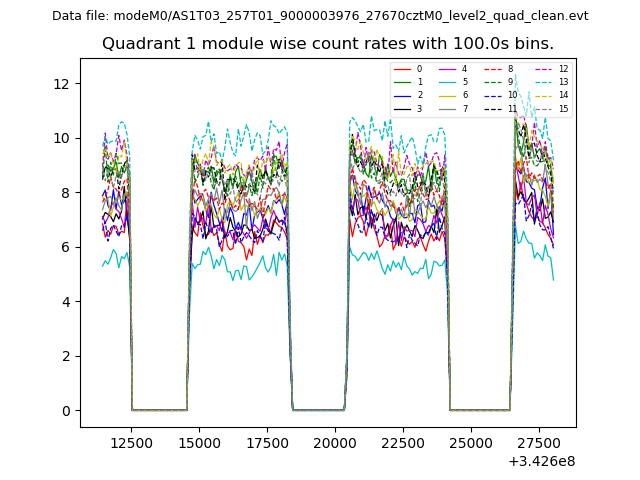
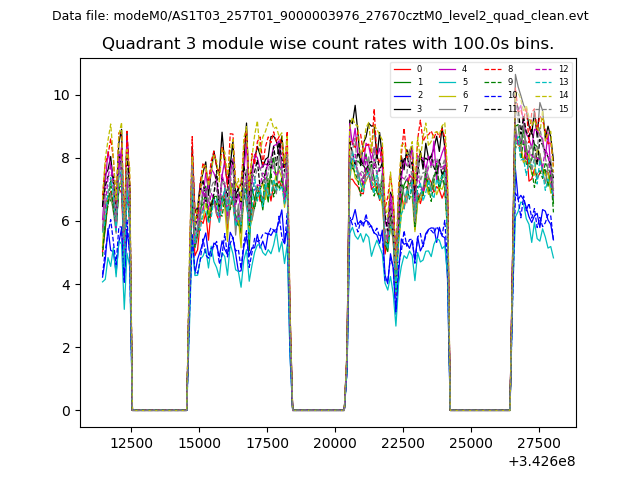
| Module-wise count rates for Quadrant A Data is divided into 100 sec bins |
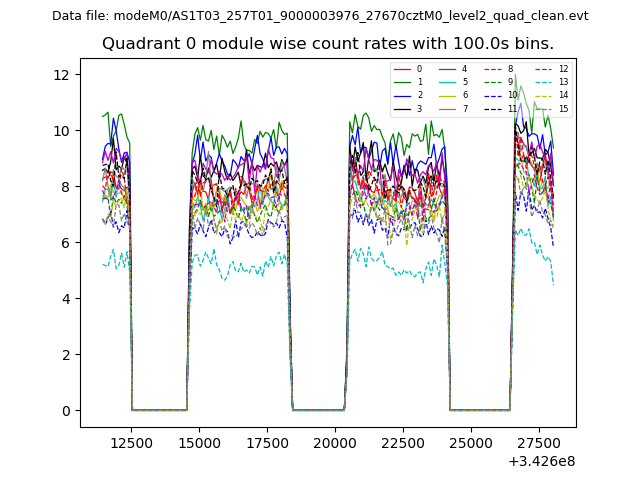 |
 |
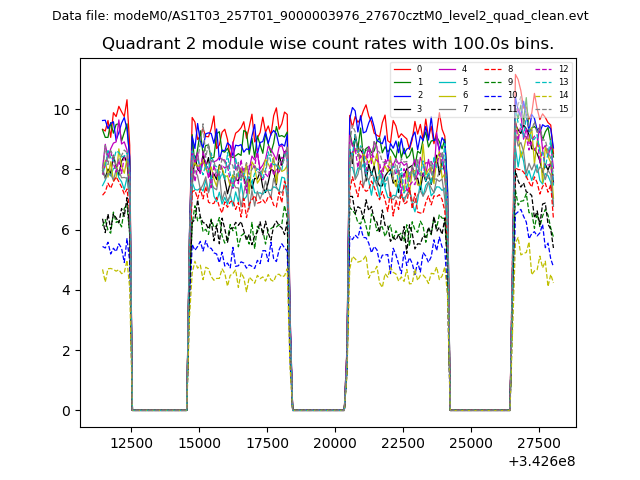
| Module-wise count rates for Quadrant B Data is divided into 100 sec bins |
 |
 |
| Module-wise count rates for Quadrant C Data is divided into 100 sec bins |
 |
 |
| Module-wise count rates for Quadrant D Data is divided into 100 sec bins |
 |
 |
| Parameter | Plot |
|---|---|
| CZT HV Monitor | 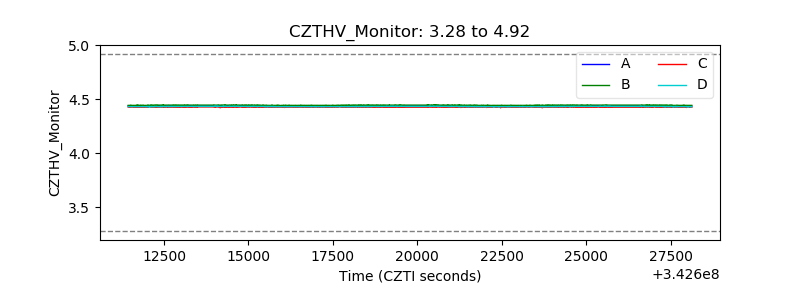 |
| D_VDD | 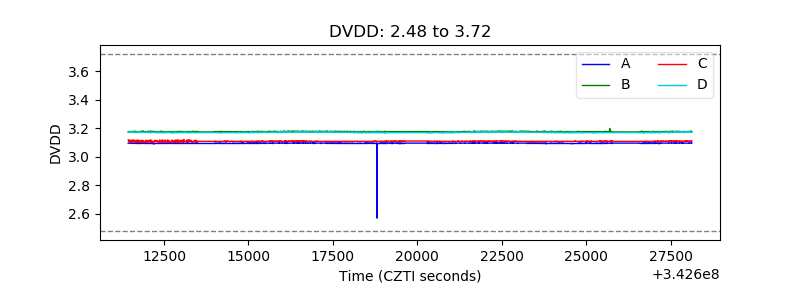 |
| Temperature 1 | 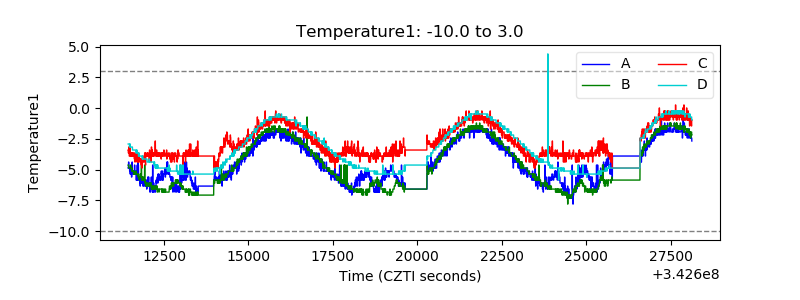 |
| Veto HV Monitor | 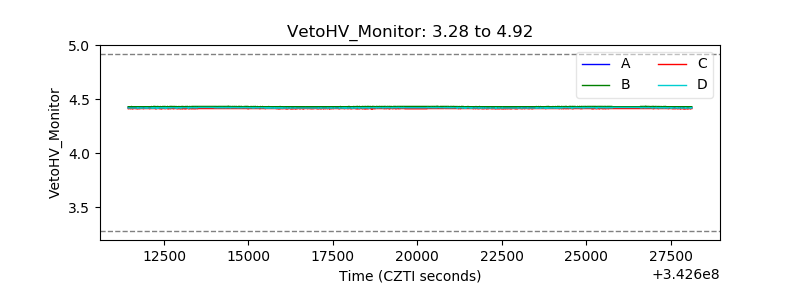 |
| Veto LLD | 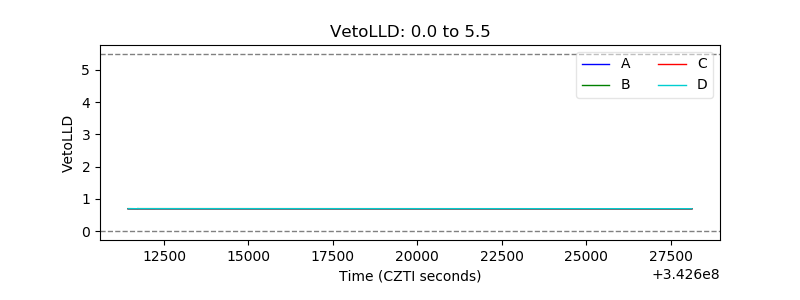 |
| Alpha Counter | 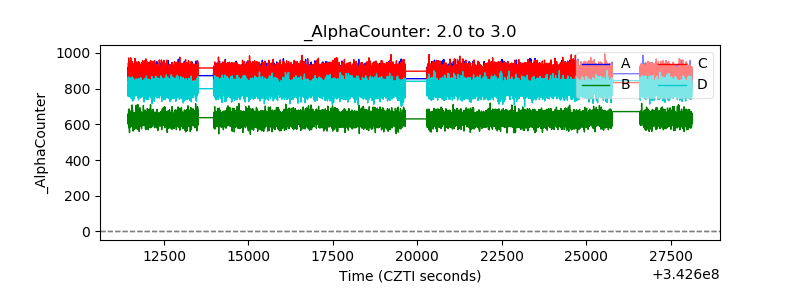 |
| _CPM_Rate |  |
| CZT Counter | 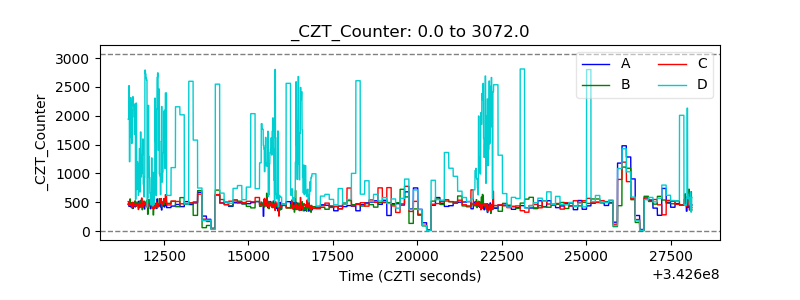 |
| +2.5 Volts monitor | 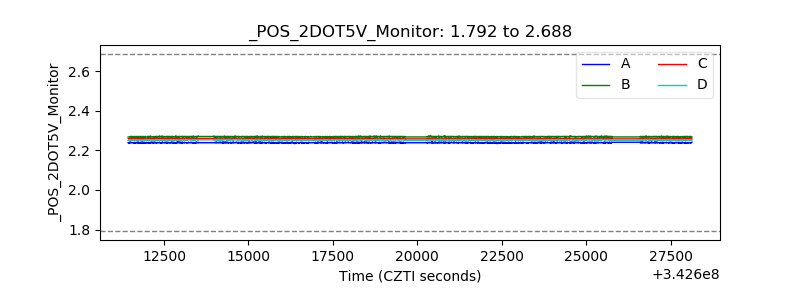 |
| +5 Volts monitor |  |
| _ROLL_ROT | 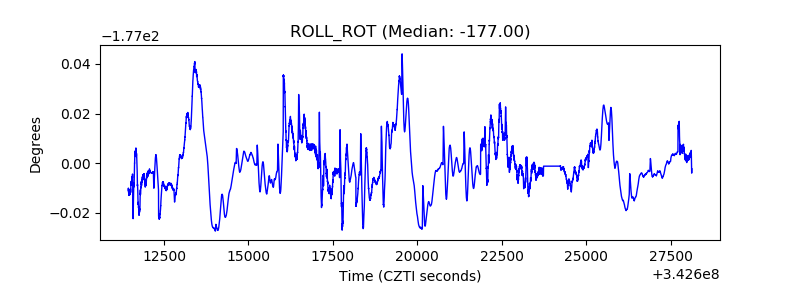 |
| _Roll_DEC |  |
| _Roll_RA |  |
| Veto Counter | 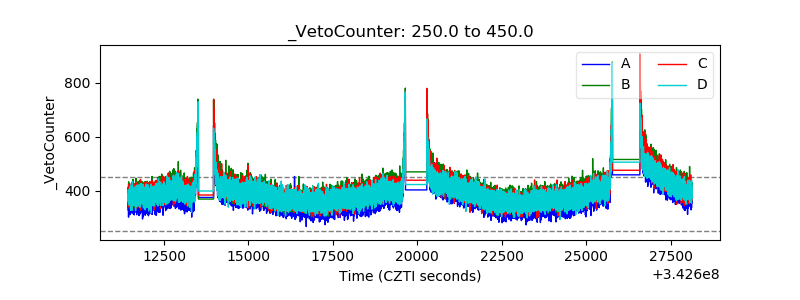 |