| Param | Original file | Final file |
|---|---|---|
| Filename | modeM0/AS1T03_257T01_9000003976_27674cztM0_level2.evt | modeM0/AS1T03_257T01_9000003976_27674cztM0_level2_quad_clean.evt |
| Size (bytes) | 493,107,840 | 96,569,280 |
| Size | 470.3 MB | 92.1 MB |
| Events in quadrant A | 3,206,038 | 638,921 |
| Events in quadrant B | 3,270,834 | 656,969 |
| Events in quadrant C | 3,299,391 | 612,599 |
| Events in quadrant D | 4,731,177 | 577,561 |
| Mode M9 | |||
|---|---|---|---|
| Quadrant | BADHDUFLAG | Total packets | Discarded packets |
| A | 0 | 12 | 0 |
| B | 0 | 12 | 0 |
| C | 0 | 12 | 0 |
| D | 0 | 12 | 0 |
| Mode M0 | |||
|---|---|---|---|
| Quadrant | BADHDUFLAG | Total packets | Discarded packets |
| A | 0 | 13549 | 0 |
| B | 0 | 13651 | 0 |
| C | 0 | 13765 | 0 |
| D | 0 | 18312 | 0 |
| Quadrant | Total seconds | Saturated seconds | Saturation percentage |
|---|---|---|---|
| A | 6281 | 50 | 0.796052% |
| B | 6281 | 49 | 0.780131% |
| C | 6282 | 82 | 1.305317% |
| D | 6282 | 309 | 4.918816% |
Noise dominated data is calculated using 1-second bins in cleaned event files. If a bin has >2000 counts, and if more than 50% of those come from <1% of pixels, then it is considered to be noise-dominated and hence unusable.
| Quadrant | # 1 sec bins | Bins with >0 counts | Bins with >2000 counts | High rate bins dominated by noise | Noise dominated (total time) | Noise dominated (detector-on time) | Marked lightcurve |
|---|---|---|---|---|---|---|---|
| A | 7536 | 6281 | 9 | 9 | 0.12% | 0.14% | 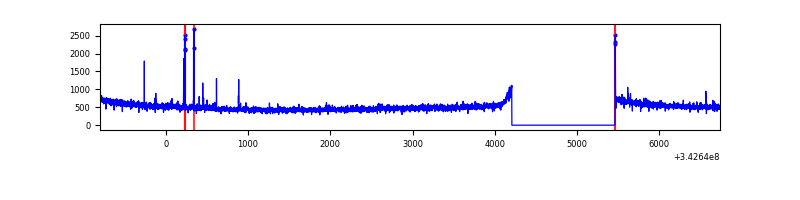 |
| B | 7536 | 6281 | 0 | 0 | 0.00% | 0.00% | 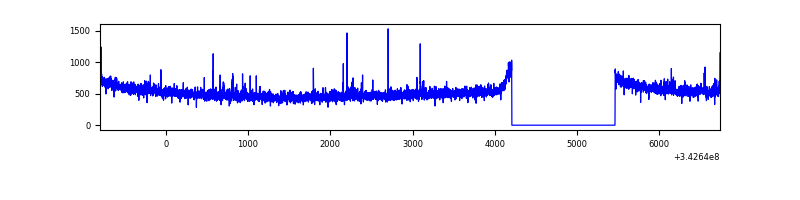 |
| C | 7537 | 6282 | 0 | 0 | 0.00% | 0.00% | 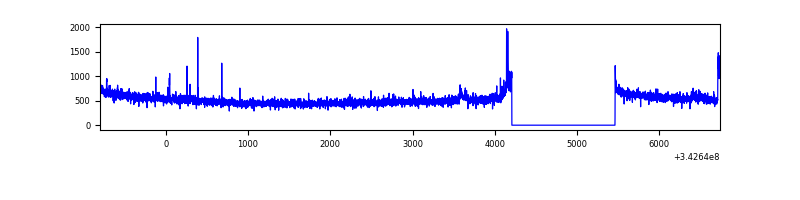 |
| D | 7537 | 6282 | 229 | 229 | 3.04% | 3.65% | 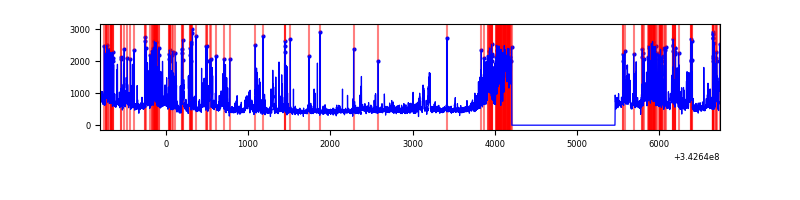 |
Top three noisy pixels from each quadrant. If the there are fewer than three noisy pixels in the level2.evt file, extra rows are filled as -1
| Pixel properties | Quadrant properties | ||||||
|---|---|---|---|---|---|---|---|
| Quadrant | DetID | PixID | Counts | Sigma | Mean | Median | Sigma |
| A | 13 | 248 | 38776 | 233.84 | 817 | 802 | 162.4 |
| A | 13 | 254 | 11285 | 64.55 | 817 | 802 | 162.4 |
| A | 8 | 192 | 8598 | 48.01 | 817 | 802 | 162.4 |
| B | 0 | 230 | 36354 | 235.79 | 816 | 799 | 150.8 |
| B | 12 | 111 | 17616 | 111.53 | 816 | 799 | 150.8 |
| B | 11 | 111 | 15637 | 98.4 | 816 | 799 | 150.8 |
| C | 14 | 238 | 128118 | 699.05 | 783 | 790 | 182.1 |
| C | 3 | 233 | 89945 | 489.47 | 783 | 790 | 182.1 |
| C | 15 | 208 | 20766 | 109.67 | 783 | 790 | 182.1 |
| D | 1 | 52 | 625309 | 3402.23 | 774 | 752 | 183.6 |
| D | 2 | 250 | 509338 | 2770.49 | 774 | 752 | 183.6 |
| D | 12 | 2 | 479583 | 2608.4 | 774 | 752 | 183.6 |
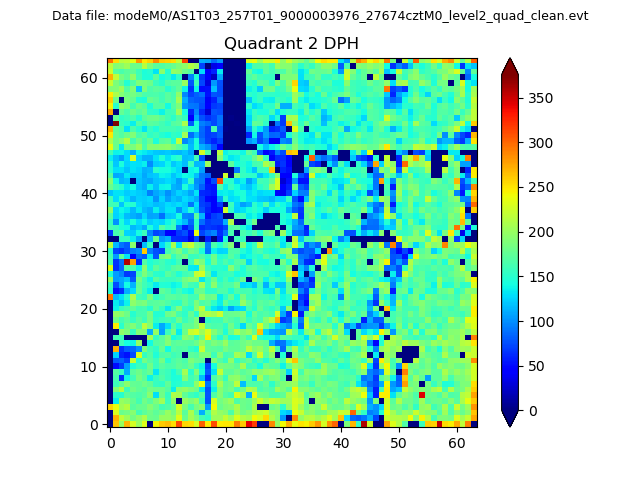
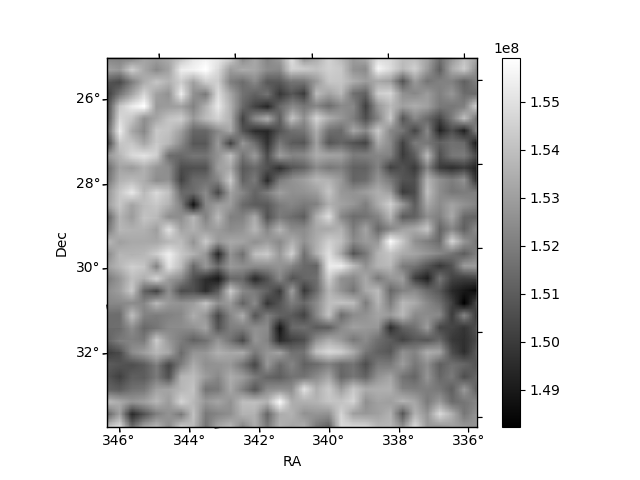
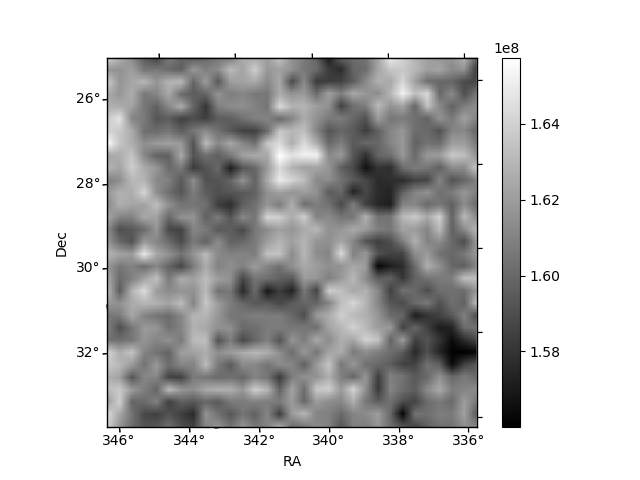
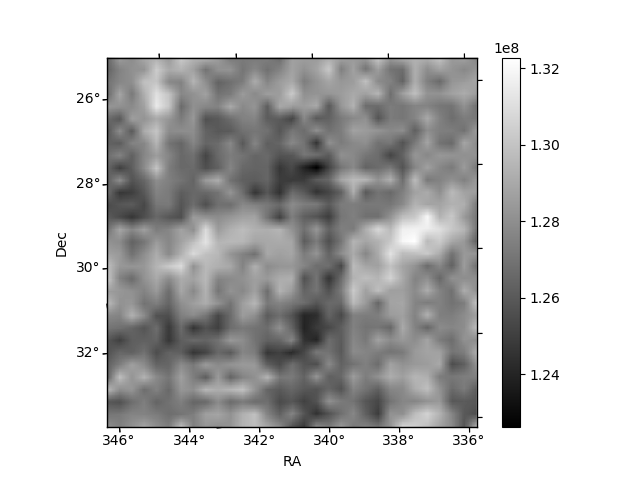
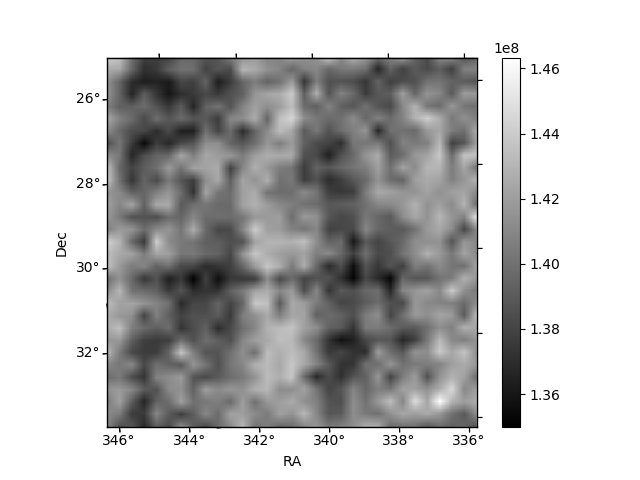
Histogram calculated using DETX and DETY for each event in the final _common_clean file
| Quadrant A | 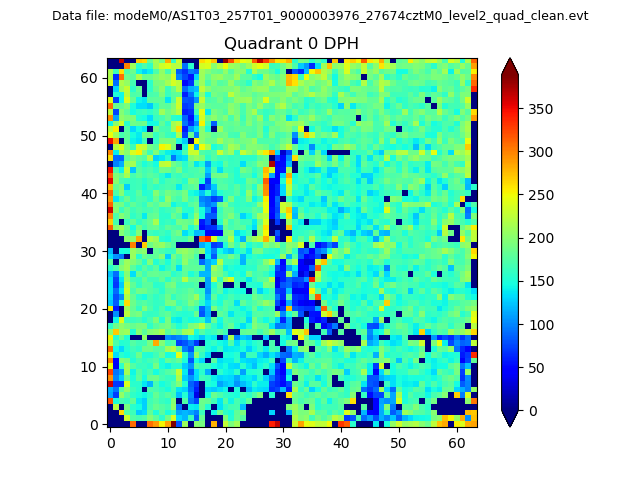 |
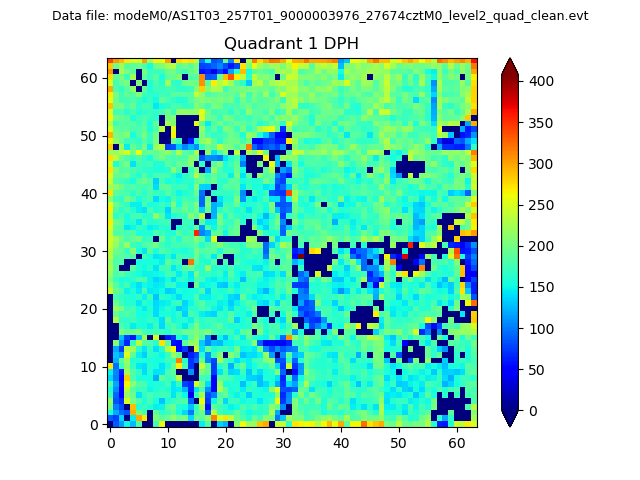 |
Quadrant B |
|---|---|---|---|
| Quadrant D | 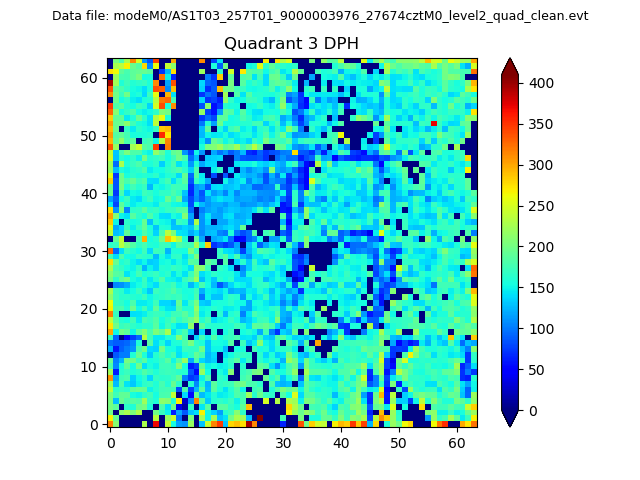 |
 |
Quadrant C |
| Plot type | Count rate plots | Images |
|---|---|---|
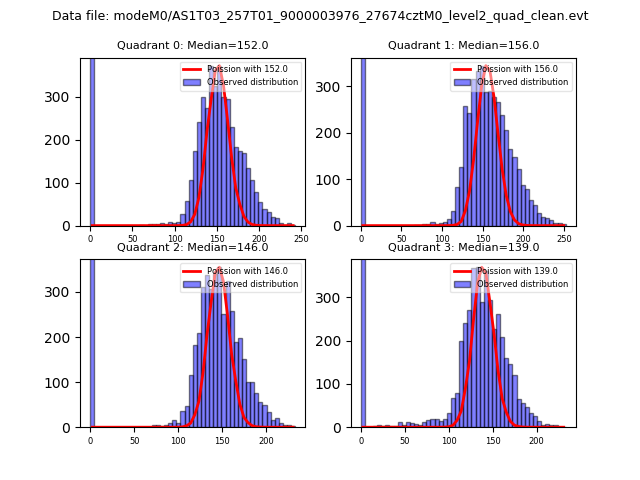
| Comparison with Poisson distribution Blue bars denote a histogram of data divided into 1 sec bins. Red curve is a Poisson curve with rate = median count rate of data. |
 |
 |
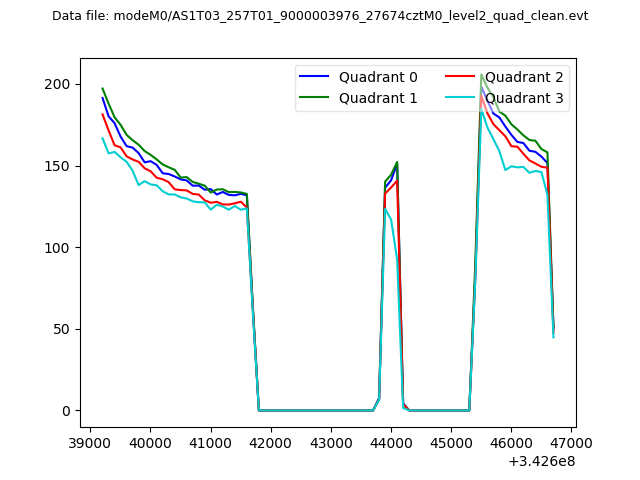
| Quadrant-wise count rates Data is divided into 100 sec bins |
 |
|
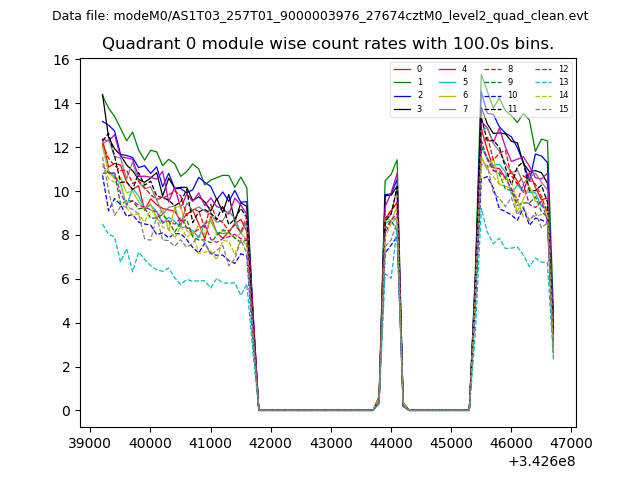
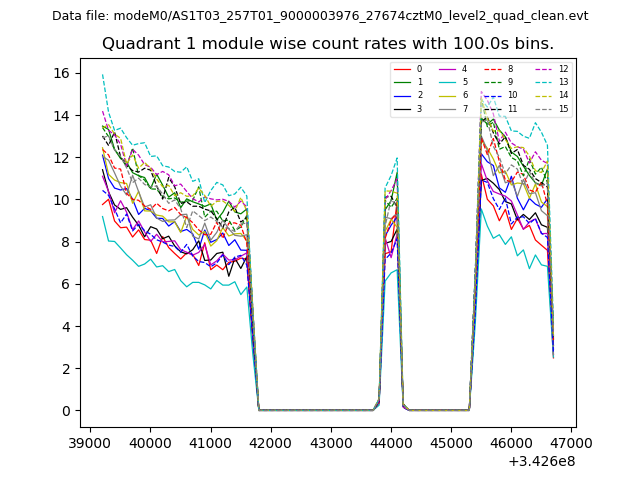
| Module-wise count rates for Quadrant A Data is divided into 100 sec bins |
 |
 |
| Module-wise count rates for Quadrant B Data is divided into 100 sec bins |
 |
 |
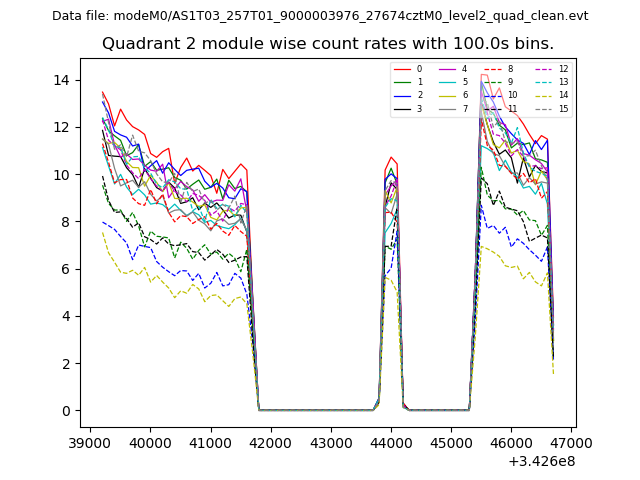
| Module-wise count rates for Quadrant C Data is divided into 100 sec bins |
 |
 |
| Module-wise count rates for Quadrant D Data is divided into 100 sec bins |
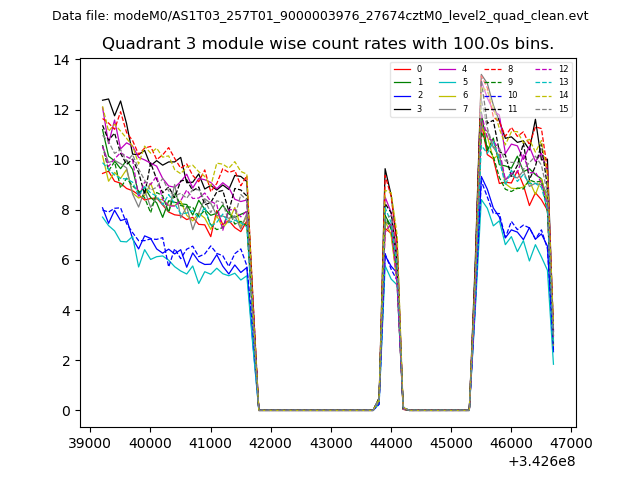 |
 |
| Parameter | Plot |
|---|---|
| CZT HV Monitor | 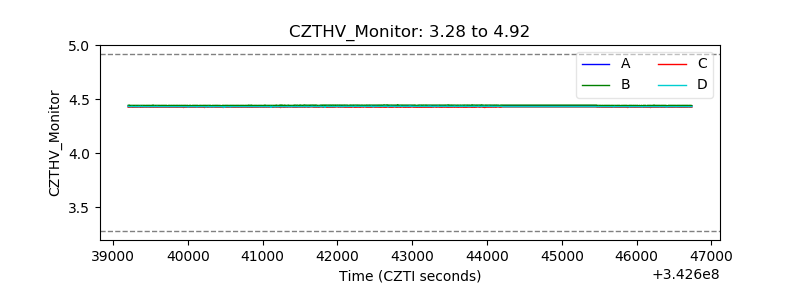 |
| D_VDD | 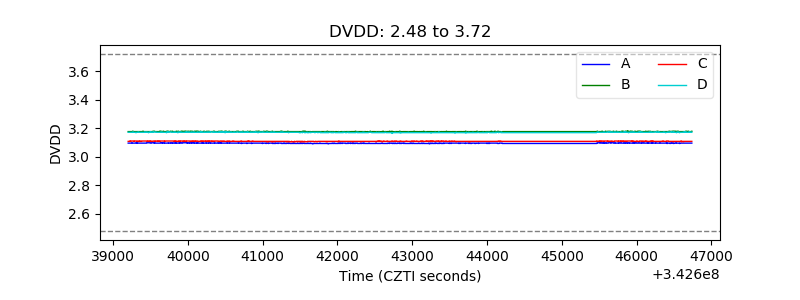 |
| Temperature 1 | 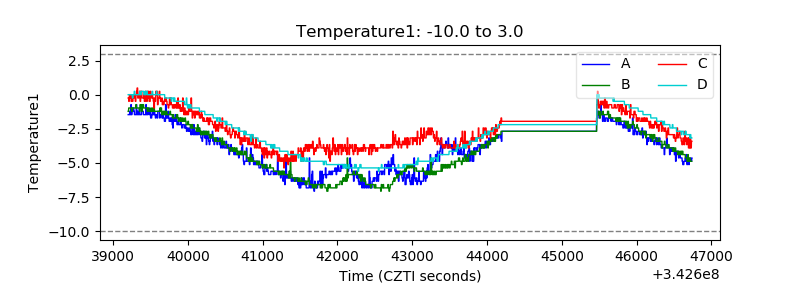 |
| Veto HV Monitor | 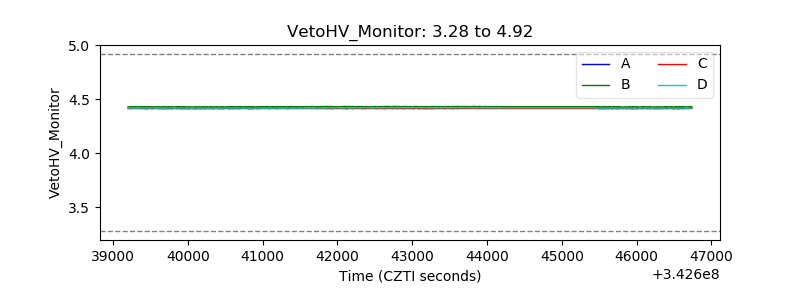 |
| Veto LLD | 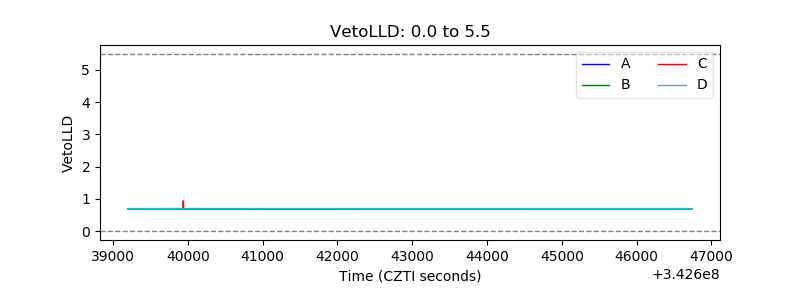 |
| Alpha Counter | 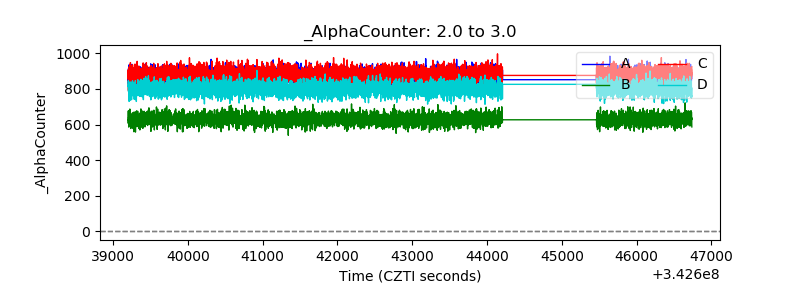 |
| _CPM_Rate | 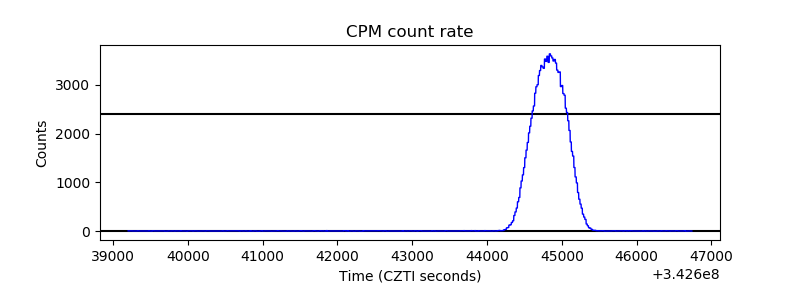 |
| CZT Counter | 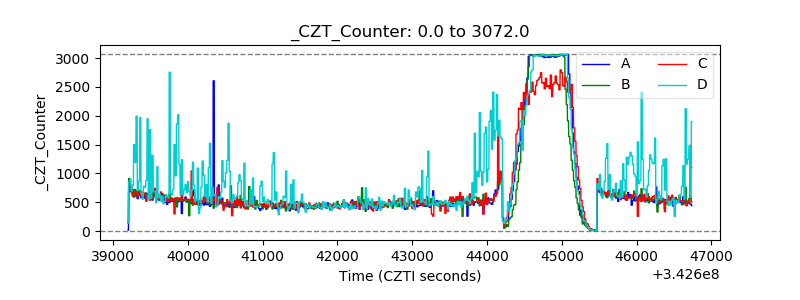 |
| +2.5 Volts monitor |  |
| +5 Volts monitor |  |
| _ROLL_ROT | 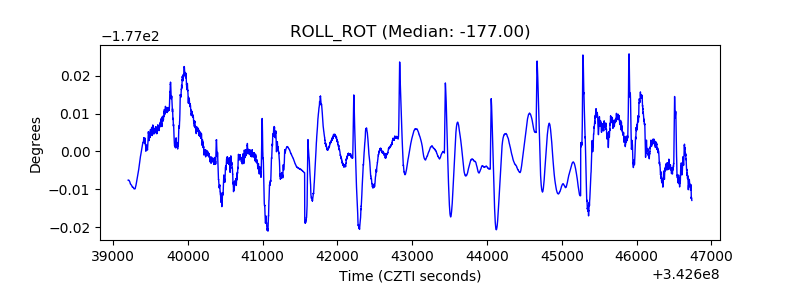 |
| _Roll_DEC | 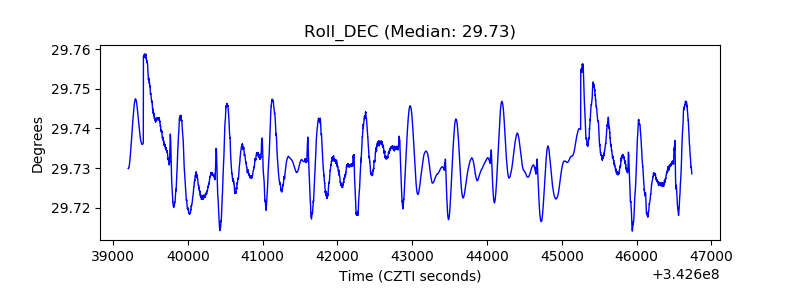 |
| _Roll_RA | 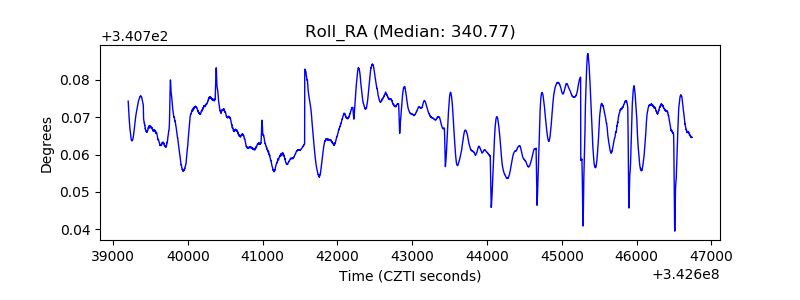 |
| Veto Counter | 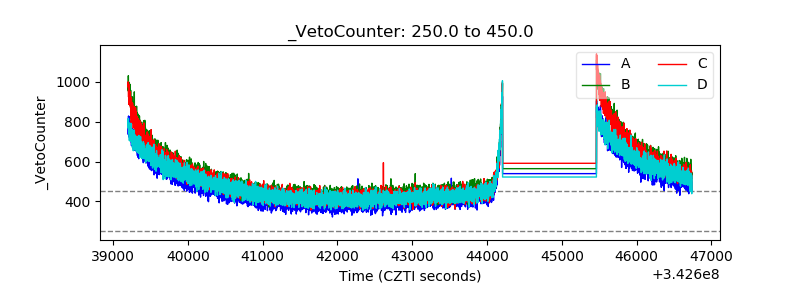 |