| Param | Original file | Final file |
|---|---|---|
| Filename | modeM0/AS1T03_257T01_9000003976_27675cztM0_level2.evt | modeM0/AS1T03_257T01_9000003976_27675cztM0_level2_quad_clean.evt |
| Size (bytes) | 707,630,400 | 92,963,520 |
| Size | 674.8 MB | 88.7 MB |
| Events in quadrant A | 3,156,869 | 641,801 |
| Events in quadrant B | 3,316,248 | 664,491 |
| Events in quadrant C | 3,353,788 | 618,935 |
| Events in quadrant D | 11,190,531 | 463,247 |
| Mode M9 | |||
|---|---|---|---|
| Quadrant | BADHDUFLAG | Total packets | Discarded packets |
| A | 0 | 24 | 0 |
| B | 0 | 25 | 0 |
| C | 0 | 25 | 0 |
| D | 0 | 25 | 0 |
| Mode M0 | |||
|---|---|---|---|
| Quadrant | BADHDUFLAG | Total packets | Discarded packets |
| A | 0 | 13164 | 0 |
| B | 0 | 13605 | 0 |
| C | 0 | 13707 | 0 |
| D | 0 | 37403 | 0 |
| Quadrant | Total seconds | Saturated seconds | Saturation percentage |
|---|---|---|---|
| A | 6107 | 34 | 0.556738% |
| B | 6107 | 48 | 0.785983% |
| C | 6107 | 83 | 1.359096% |
| D | 6107 | 3407 | 55.788439% |
Noise dominated data is calculated using 1-second bins in cleaned event files. If a bin has >2000 counts, and if more than 50% of those come from <1% of pixels, then it is considered to be noise-dominated and hence unusable.
| Quadrant | # 1 sec bins | Bins with >0 counts | Bins with >2000 counts | High rate bins dominated by noise | Noise dominated (total time) | Noise dominated (detector-on time) | Marked lightcurve |
|---|---|---|---|---|---|---|---|
| A | 7432 | 6108 | 4 | 4 | 0.05% | 0.07% | 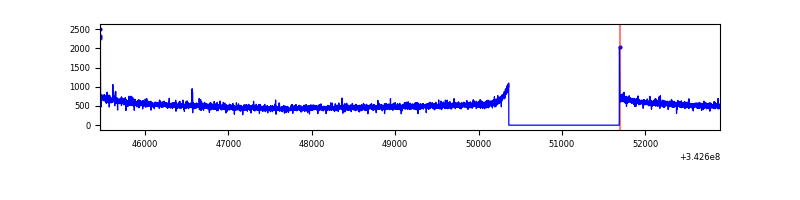 |
| B | 7432 | 6107 | 4 | 4 | 0.05% | 0.07% | 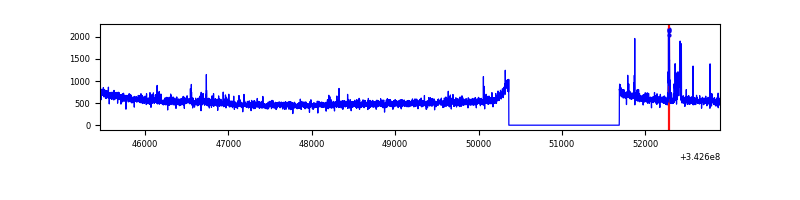 |
| C | 7432 | 6107 | 3 | 3 | 0.04% | 0.05% | 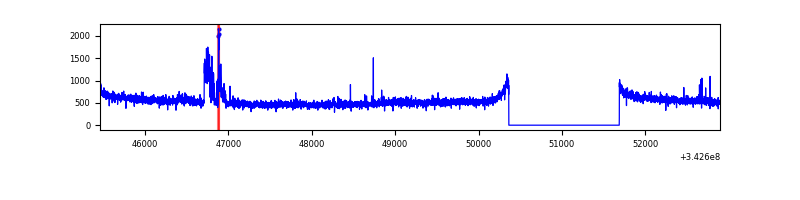 |
| D | 7431 | 6106 | 3372 | 3372 | 45.38% | 55.22% | 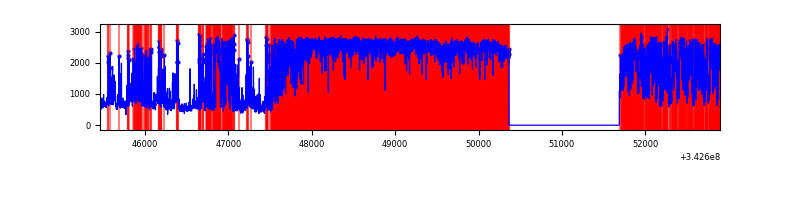 |
Top three noisy pixels from each quadrant. If the there are fewer than three noisy pixels in the level2.evt file, extra rows are filled as -1
| Pixel properties | Quadrant properties | ||||||
|---|---|---|---|---|---|---|---|
| Quadrant | DetID | PixID | Counts | Sigma | Mean | Median | Sigma |
| A | 8 | 192 | 14890 | 87.77 | 812 | 798 | 160.6 |
| A | 13 | 254 | 10986 | 63.45 | 812 | 798 | 160.6 |
| A | 13 | 248 | 7028 | 38.8 | 812 | 798 | 160.6 |
| B | 3 | 64 | 74184 | 483.09 | 815 | 797 | 151.9 |
| B | 0 | 230 | 35581 | 228.98 | 815 | 797 | 151.9 |
| B | 12 | 111 | 17285 | 108.54 | 815 | 797 | 151.9 |
| C | 3 | 233 | 150490 | 821.63 | 783 | 790 | 182.2 |
| C | 14 | 238 | 128507 | 700.98 | 783 | 790 | 182.2 |
| C | 15 | 208 | 15336 | 79.84 | 783 | 790 | 182.2 |
| D | 12 | 2 | 7550360 | 63431.29 | 507 | 495 | 119.0 |
| D | 1 | 52 | 1120836 | 9412.71 | 507 | 495 | 119.0 |
| D | 2 | 250 | 354377 | 2973.19 | 507 | 495 | 119.0 |
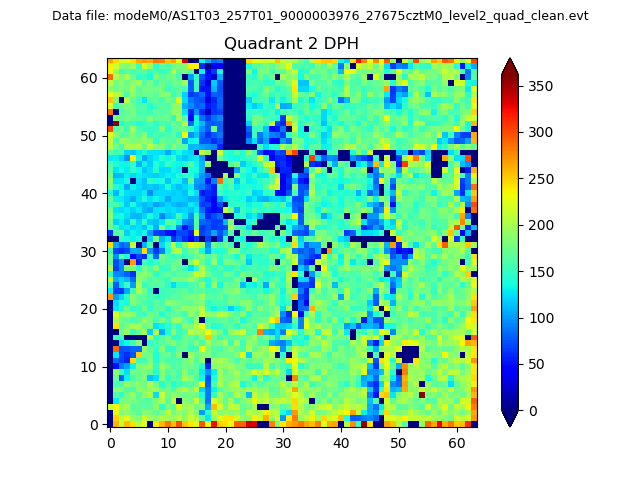
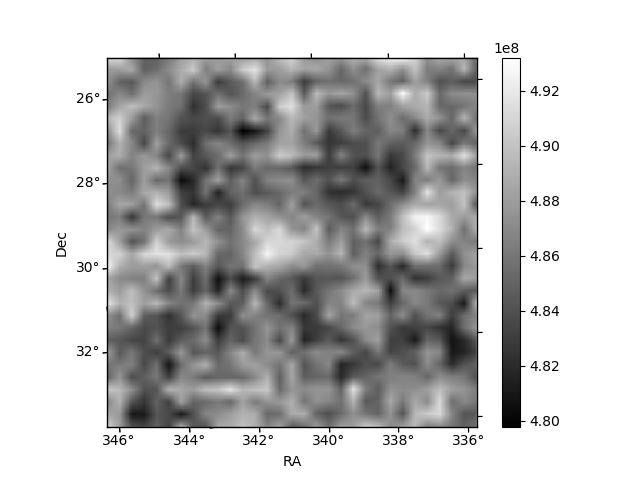
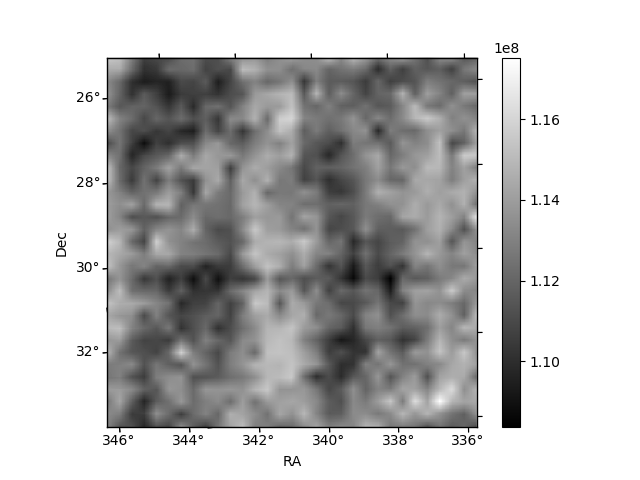
Histogram calculated using DETX and DETY for each event in the final _common_clean file
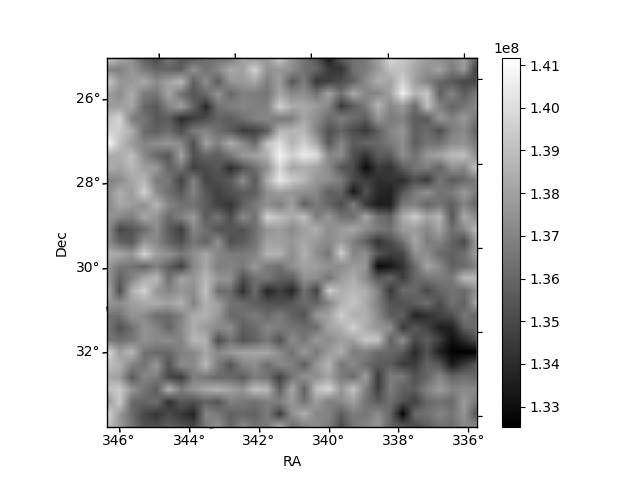
| Quadrant A | 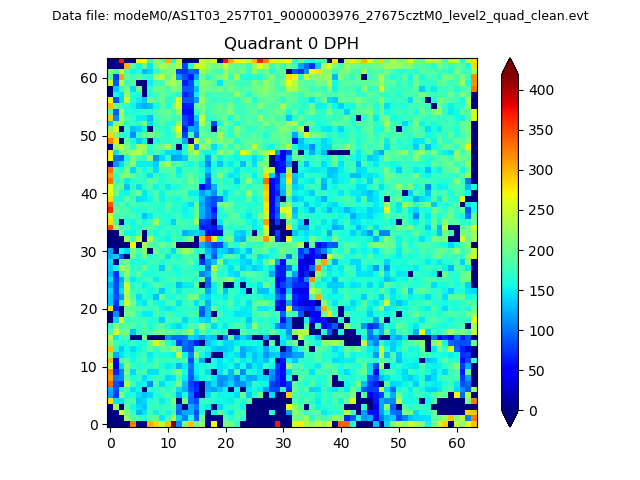 |
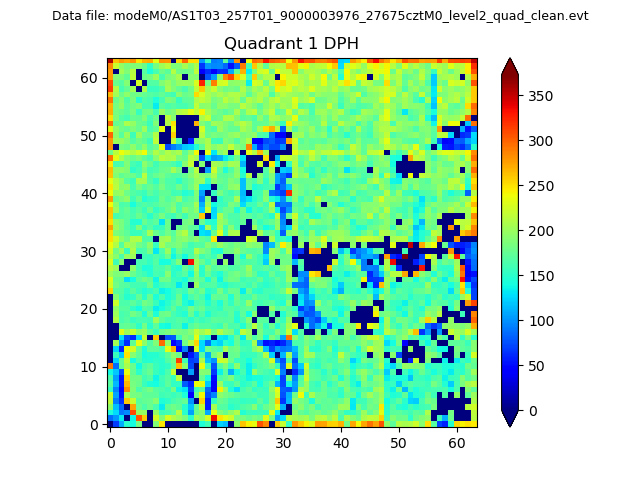 |
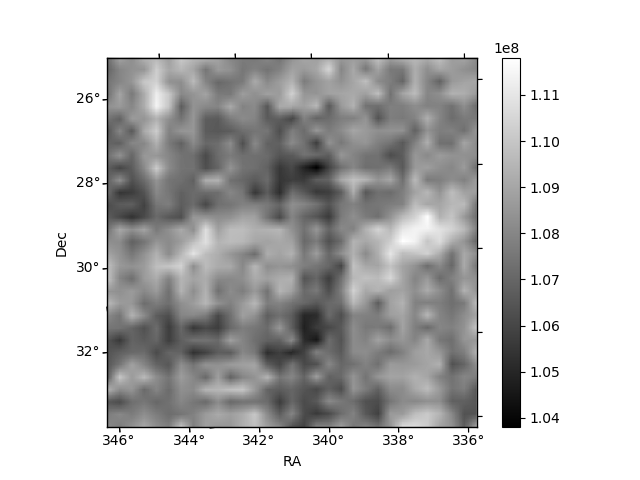
Quadrant B |
|---|---|---|---|
| Quadrant D | 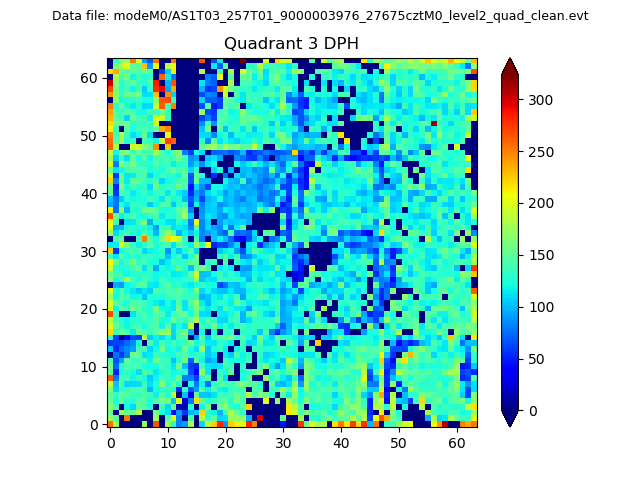 |
 |
Quadrant C |
| Plot type | Count rate plots | Images |
|---|---|---|
| Comparison with Poisson distribution Blue bars denote a histogram of data divided into 1 sec bins. Red curve is a Poisson curve with rate = median count rate of data. |
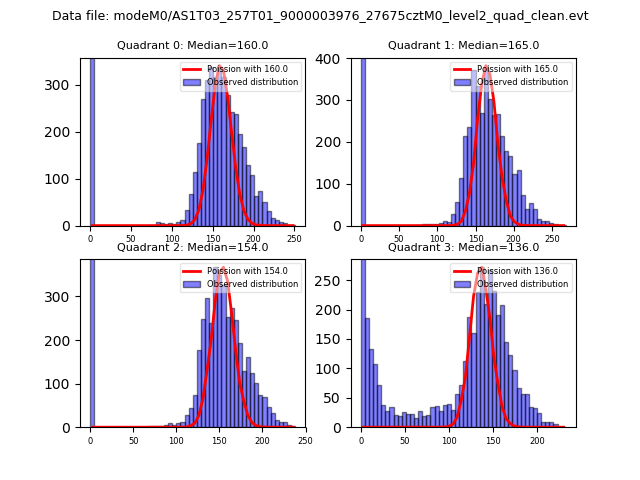 |
 |
| Quadrant-wise count rates Data is divided into 100 sec bins |
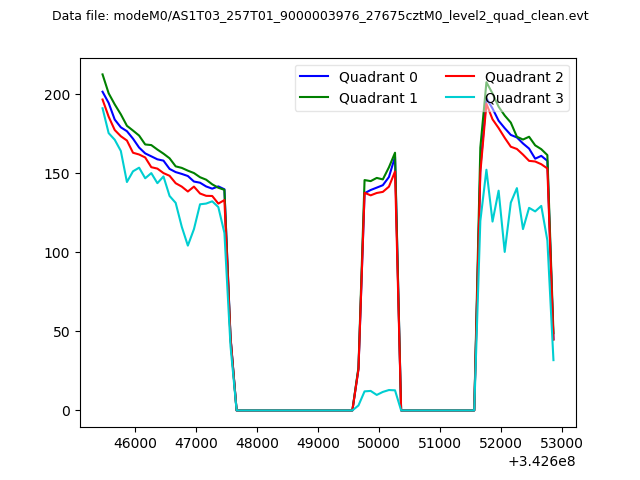 |
|
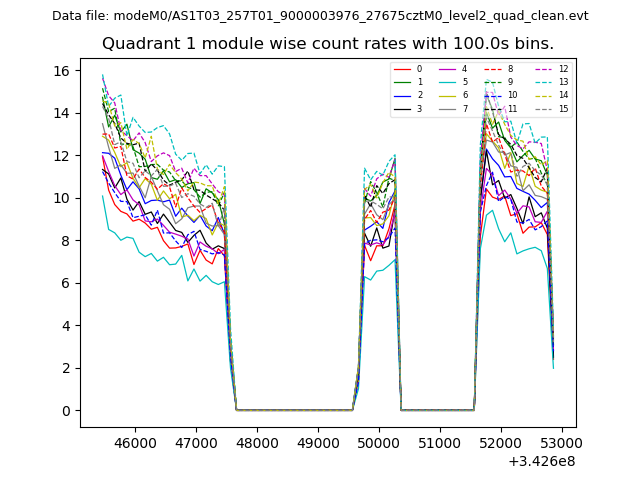
| Module-wise count rates for Quadrant A Data is divided into 100 sec bins |
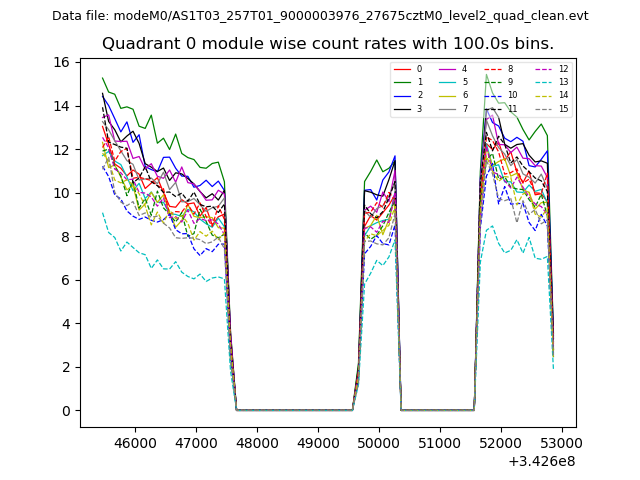 |
 |
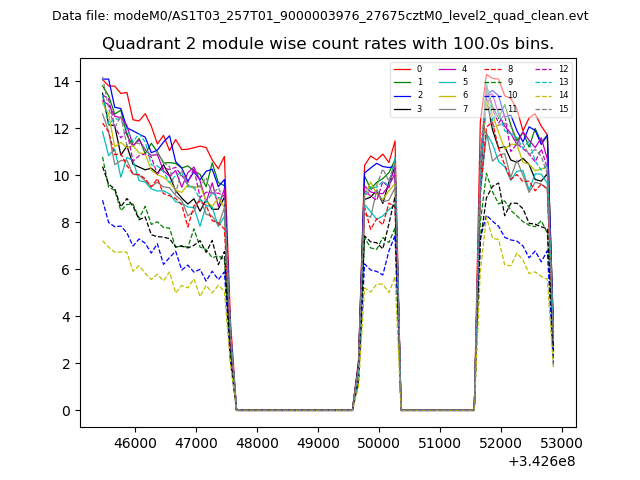
| Module-wise count rates for Quadrant B Data is divided into 100 sec bins |
 |
 |
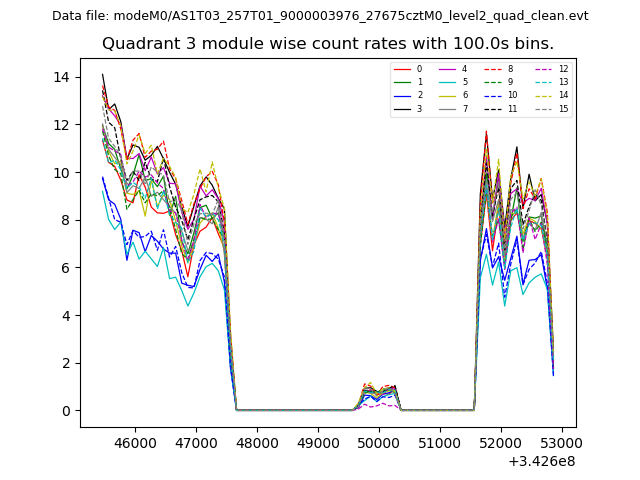
| Module-wise count rates for Quadrant C Data is divided into 100 sec bins |
 |
 |
| Module-wise count rates for Quadrant D Data is divided into 100 sec bins |
 |
 |
| Parameter | Plot |
|---|---|
| CZT HV Monitor | 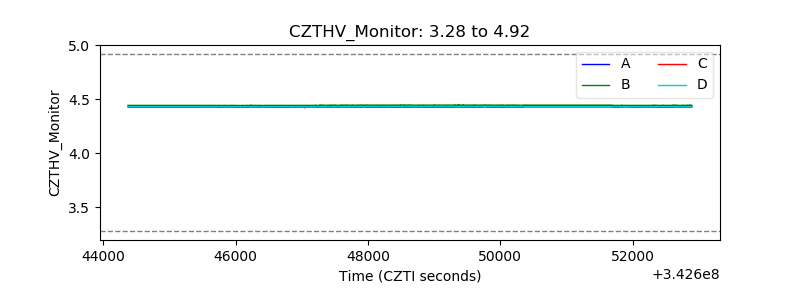 |
| D_VDD | 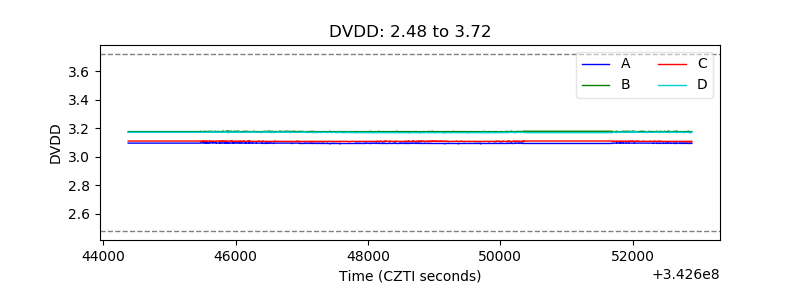 |
| Temperature 1 | 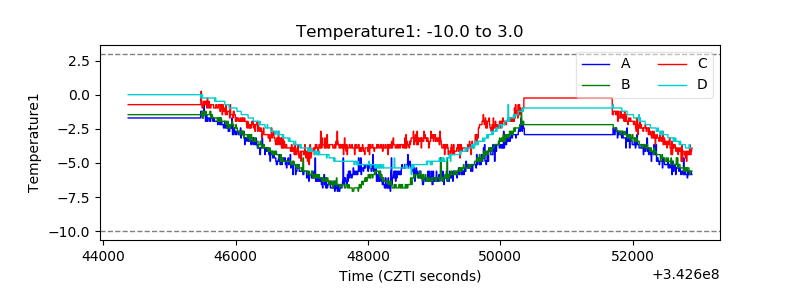 |
| Veto HV Monitor | 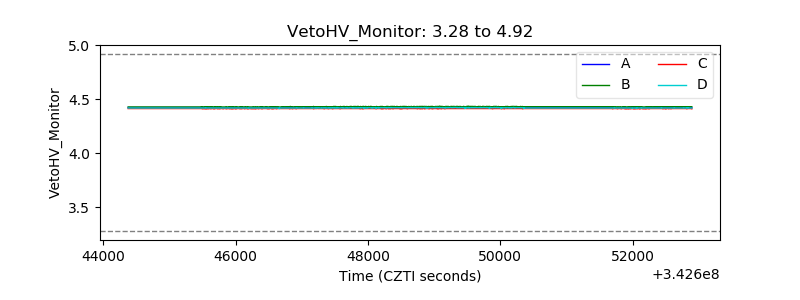 |
| Veto LLD | 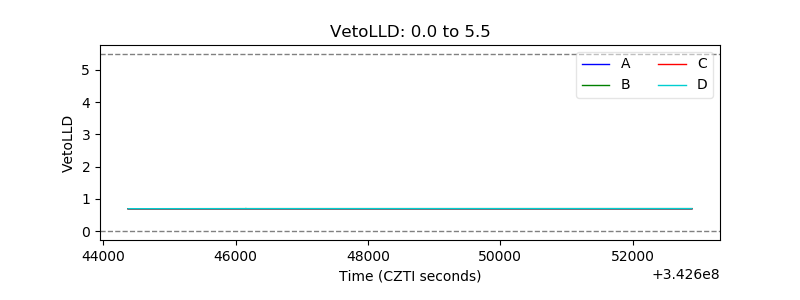 |
| Alpha Counter | 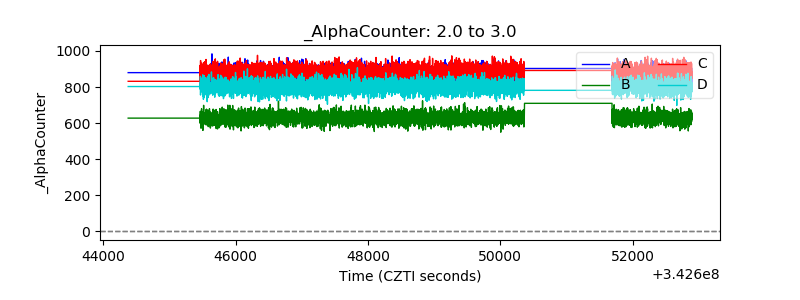 |
| _CPM_Rate | 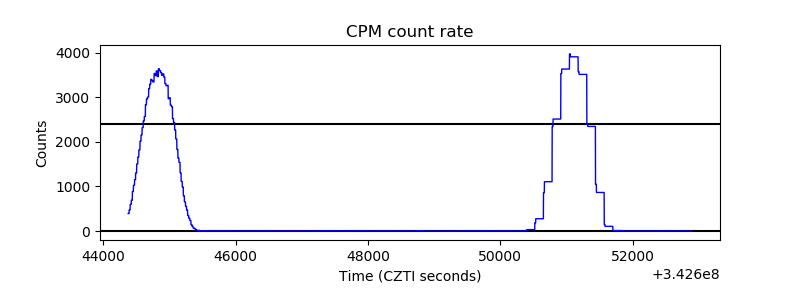 |
| CZT Counter | 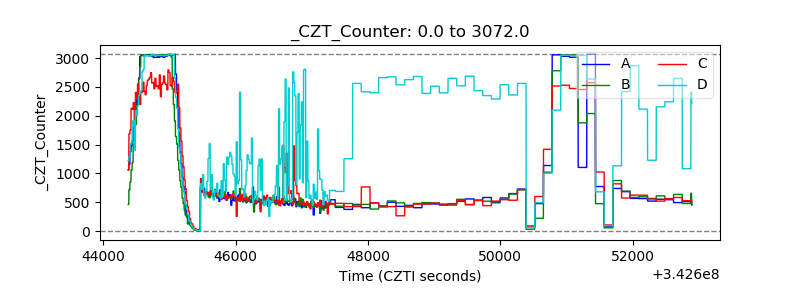 |
| +2.5 Volts monitor |  |
| +5 Volts monitor |  |
| _ROLL_ROT | 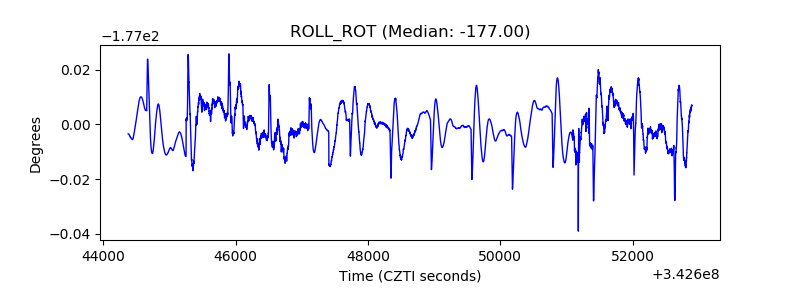 |
| _Roll_DEC | 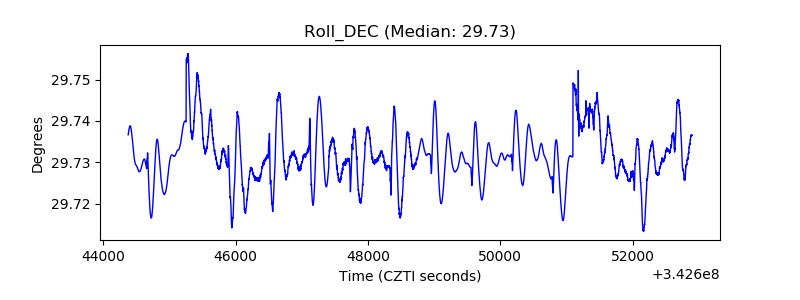 |
| _Roll_RA | 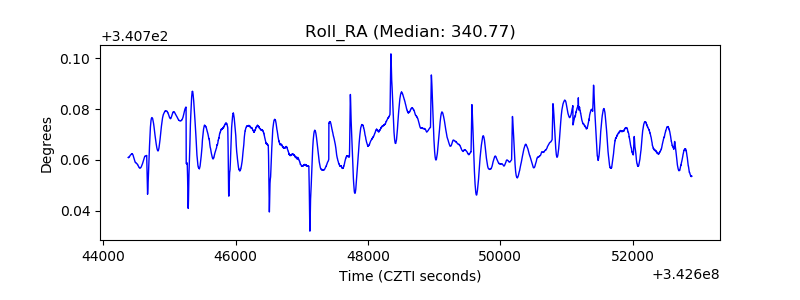 |
| Veto Counter |  |