| Param | Original file | Final file |
|---|---|---|
| Filename | modeM0/AS1T03_257T01_9000003976_27677cztM0_level2.evt | modeM0/AS1T03_257T01_9000003976_27677cztM0_level2_quad_clean.evt |
| Size (bytes) | 2,327,728,320 | 317,868,480 |
| Size | 2.2 GB | 303.1 MB |
| Events in quadrant A | 12,387,067 | 2,092,177 |
| Events in quadrant B | 12,948,025 | 2,153,349 |
| Events in quadrant C | 12,947,724 | 2,012,644 |
| Events in quadrant D | 30,526,822 | 1,646,678 |
| Mode M9 | |||
|---|---|---|---|
| Quadrant | BADHDUFLAG | Total packets | Discarded packets |
| A | 0 | 66 | 0 |
| B | 0 | 66 | 0 |
| C | 0 | 66 | 0 |
| D | 0 | 66 | 0 |
| Mode M0 | |||
|---|---|---|---|
| Quadrant | BADHDUFLAG | Total packets | Discarded packets |
| A | 0 | 52634 | 0 |
| B | 0 | 53901 | 0 |
| C | 0 | 53791 | 0 |
| D | 0 | 107624 | 0 |
| Quadrant | Total seconds | Saturated seconds | Saturation percentage |
|---|---|---|---|
| A | 25030 | 166 | 0.663204% |
| B | 25031 | 223 | 0.890895% |
| C | 25031 | 322 | 1.286405% |
| D | 25031 | 6921 | 27.649714% |
Noise dominated data is calculated using 1-second bins in cleaned event files. If a bin has >2000 counts, and if more than 50% of those come from <1% of pixels, then it is considered to be noise-dominated and hence unusable.
| Quadrant | # 1 sec bins | Bins with >0 counts | Bins with >2000 counts | High rate bins dominated by noise | Noise dominated (total time) | Noise dominated (detector-on time) | Marked lightcurve |
|---|---|---|---|---|---|---|---|
| A | 31490 | 25032 | 15 | 15 | 0.05% | 0.06% | 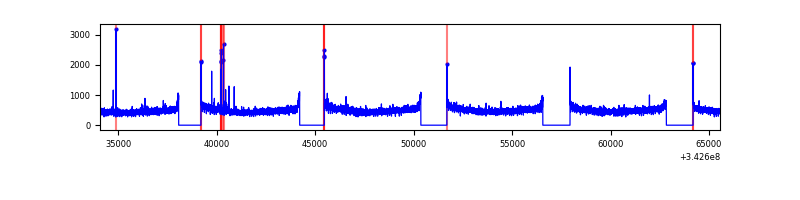 |
| B | 31491 | 25032 | 23 | 23 | 0.07% | 0.09% | 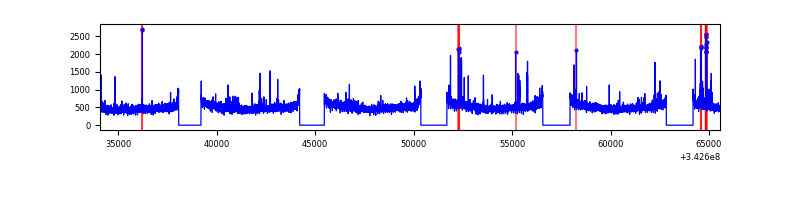 |
| C | 31491 | 25032 | 13 | 13 | 0.04% | 0.05% | 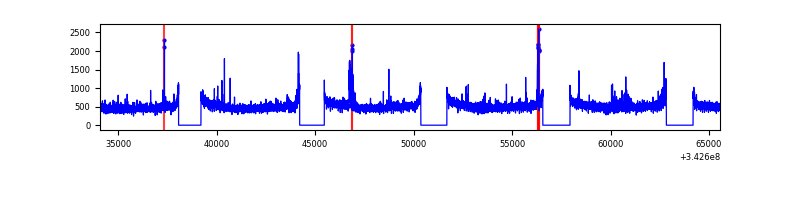 |
| D | 31491 | 25031 | 6745 | 6745 | 21.42% | 26.95% | 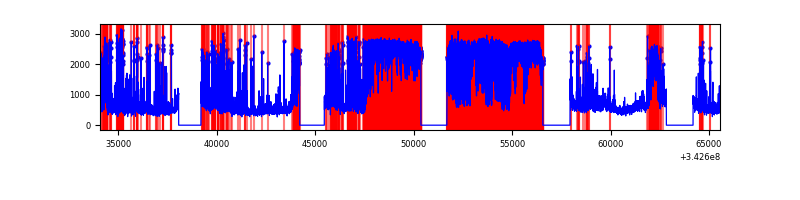 |
Top three noisy pixels from each quadrant. If the there are fewer than three noisy pixels in the level2.evt file, extra rows are filled as -1
| Pixel properties | Quadrant properties | ||||||
|---|---|---|---|---|---|---|---|
| Quadrant | DetID | PixID | Counts | Sigma | Mean | Median | Sigma |
| A | 13 | 248 | 51227 | 76.37 | 3188 | 3133 | 629.8 |
| A | 13 | 254 | 44243 | 65.28 | 3188 | 3133 | 629.8 |
| A | 8 | 192 | 34475 | 49.77 | 3188 | 3133 | 629.8 |
| B | 3 | 64 | 212953 | 353.07 | 3202 | 3126 | 594.3 |
| B | 0 | 230 | 102570 | 167.33 | 3202 | 3126 | 594.3 |
| B | 12 | 111 | 71064 | 114.32 | 3202 | 3126 | 594.3 |
| C | 14 | 238 | 498172 | 696.84 | 3073 | 3102 | 710.5 |
| C | 3 | 233 | 284157 | 395.6 | 3073 | 3102 | 710.5 |
| C | 15 | 208 | 92628 | 126.01 | 3073 | 3102 | 710.5 |
| D | 12 | 2 | 16021708 | 26236.92 | 2572 | 2507 | 610.6 |
| D | 1 | 52 | 2860945 | 4681.67 | 2572 | 2507 | 610.6 |
| D | 2 | 250 | 1220824 | 1995.41 | 2572 | 2507 | 610.6 |
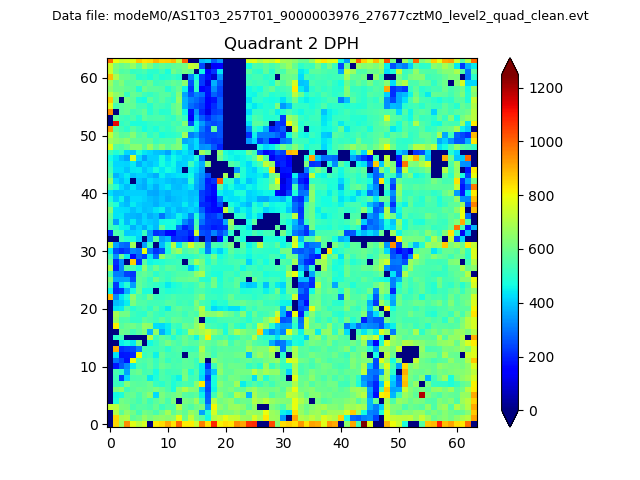
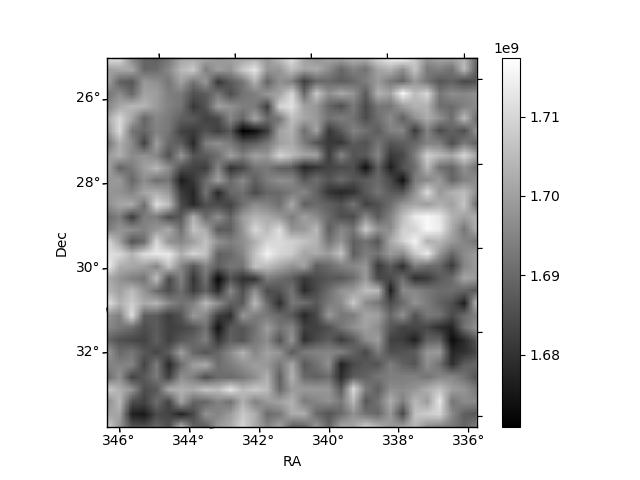
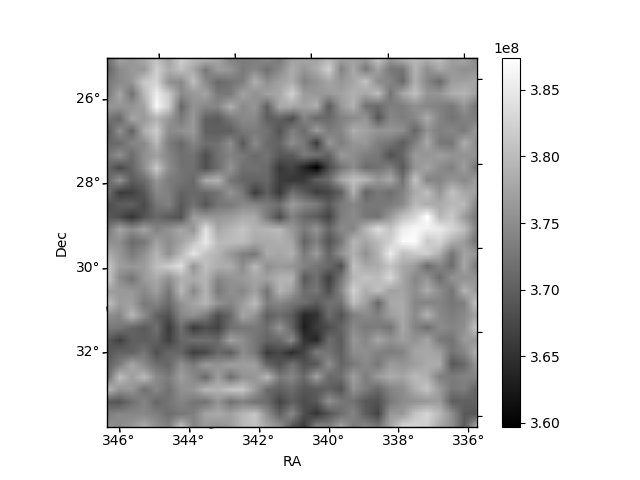
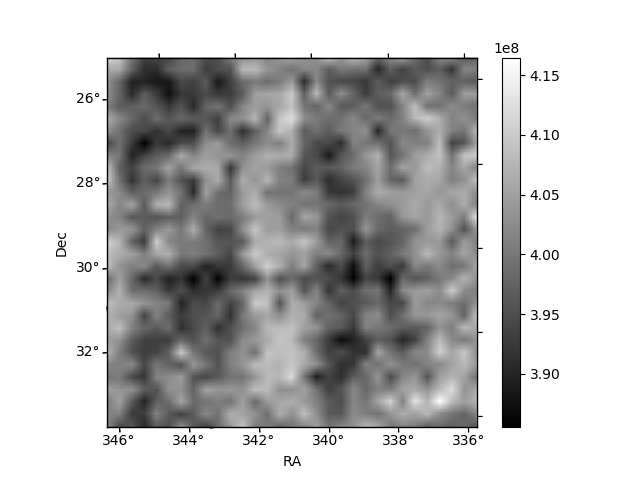
Histogram calculated using DETX and DETY for each event in the final _common_clean file
| Quadrant A | 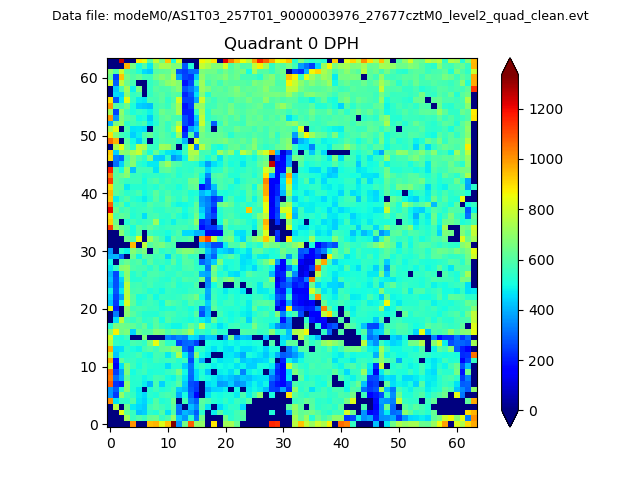 |
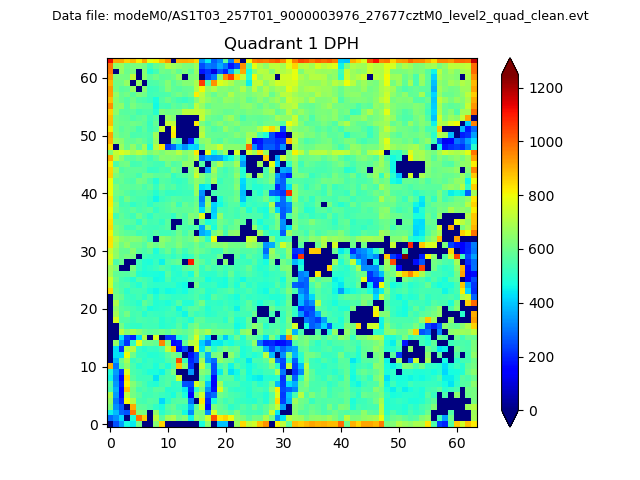 |
Quadrant B |
|---|---|---|---|
| Quadrant D | 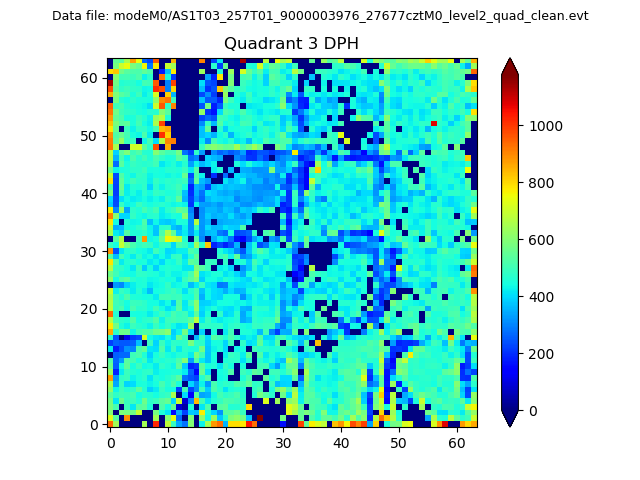 |
 |
Quadrant C |
| Plot type | Count rate plots | Images |
|---|---|---|
| Comparison with Poisson distribution Blue bars denote a histogram of data divided into 1 sec bins. Red curve is a Poisson curve with rate = median count rate of data. |
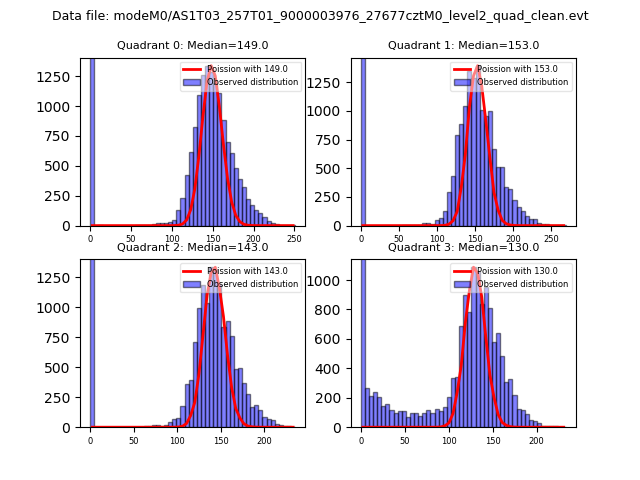 |
 |
| Quadrant-wise count rates Data is divided into 100 sec bins |
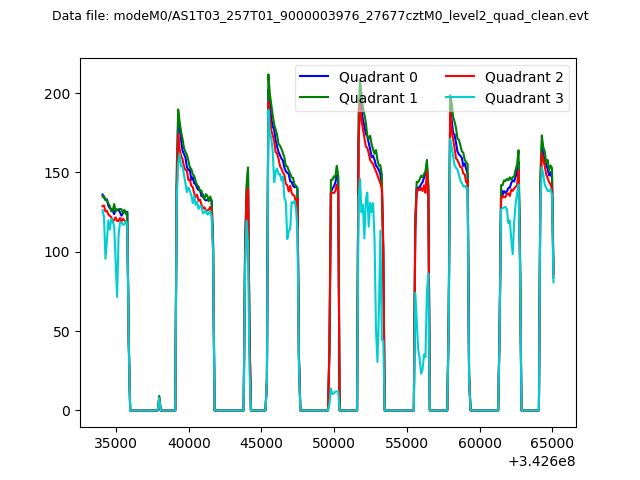 |
|
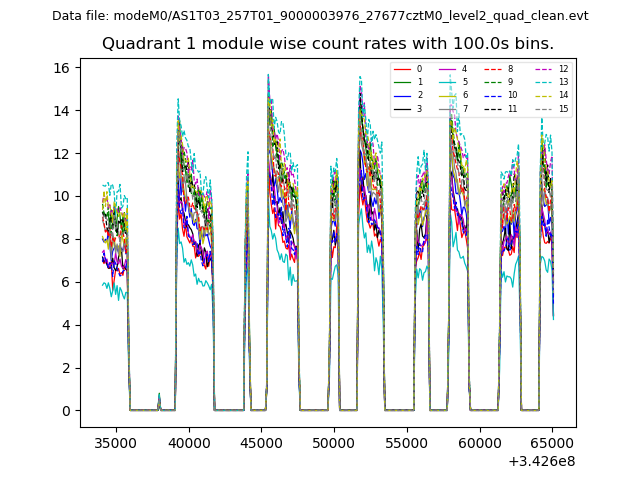
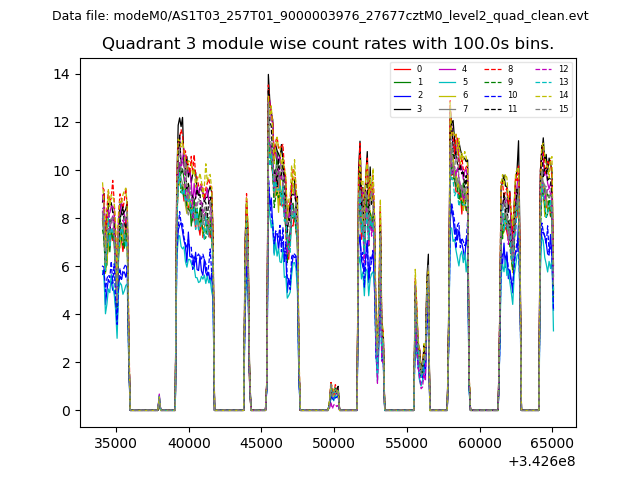
| Module-wise count rates for Quadrant A Data is divided into 100 sec bins |
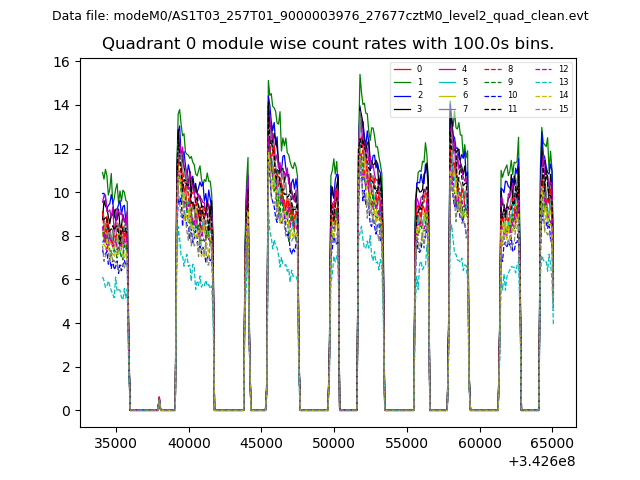 |
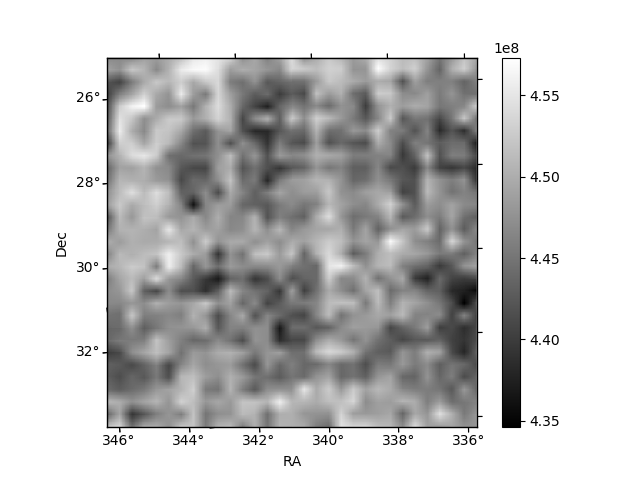 |
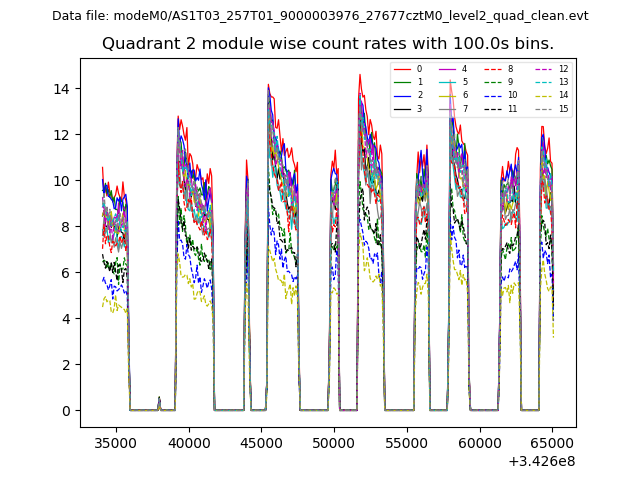
| Module-wise count rates for Quadrant B Data is divided into 100 sec bins |
 |
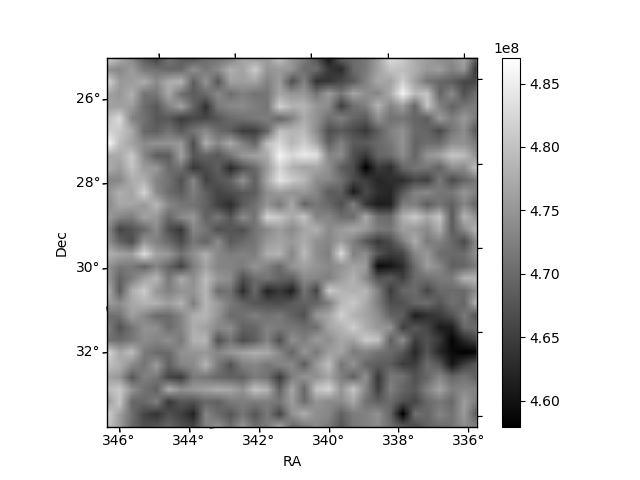 |
| Module-wise count rates for Quadrant C Data is divided into 100 sec bins |
 |
 |
| Module-wise count rates for Quadrant D Data is divided into 100 sec bins |
 |
 |
| Parameter | Plot |
|---|---|
| CZT HV Monitor | 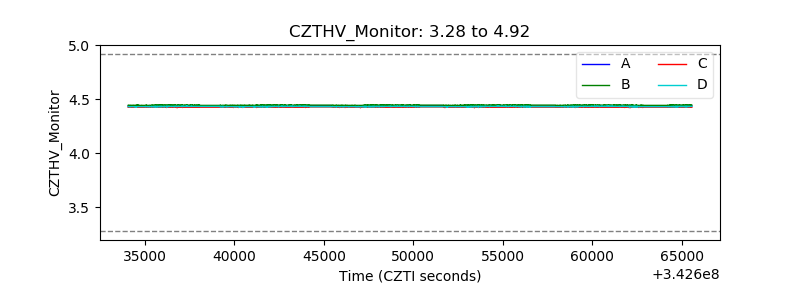 |
| D_VDD | 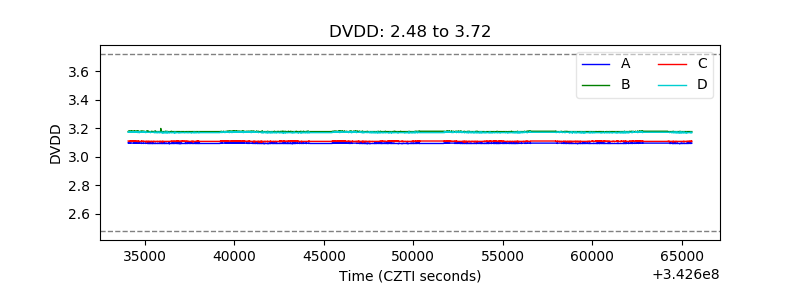 |
| Temperature 1 | 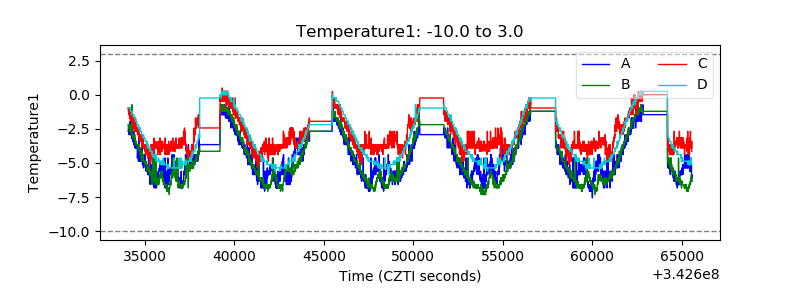 |
| Veto HV Monitor | 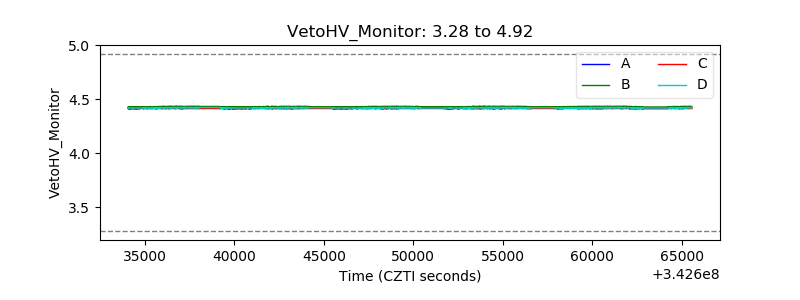 |
| Veto LLD | 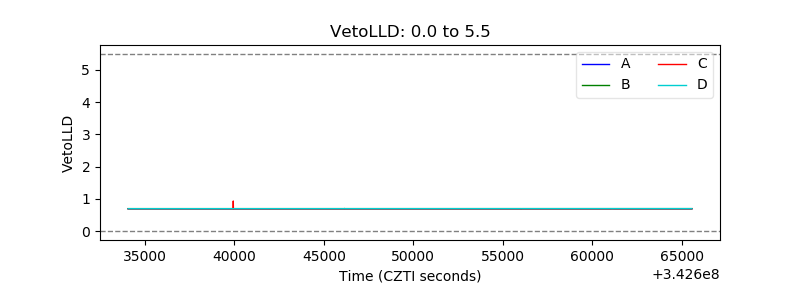 |
| Alpha Counter | 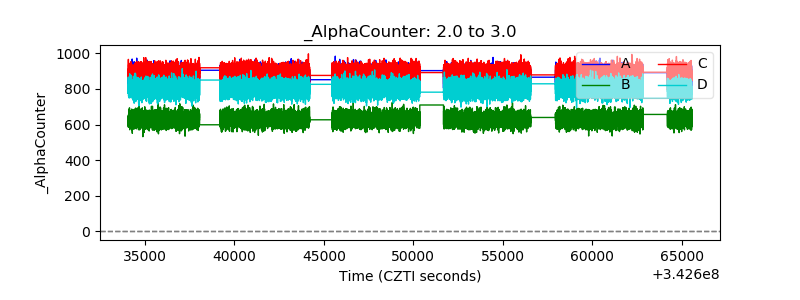 |
| _CPM_Rate | 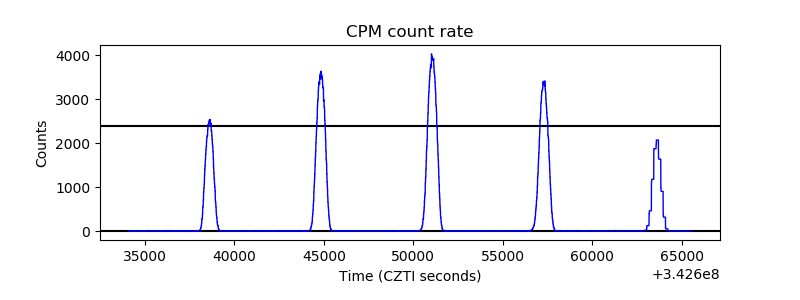 |
| CZT Counter | 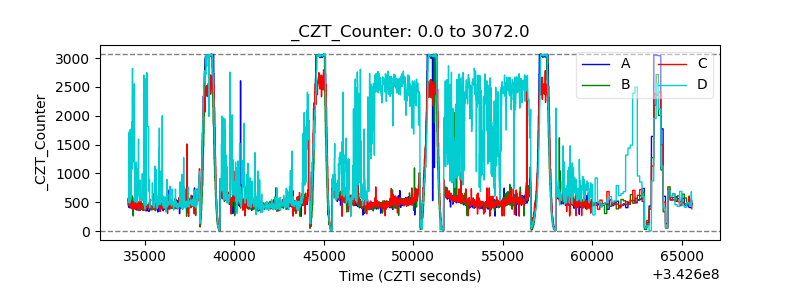 |
| +2.5 Volts monitor |  |
| +5 Volts monitor | 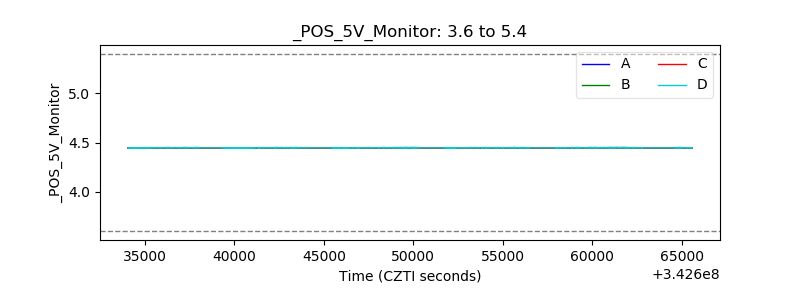 |
| _ROLL_ROT | 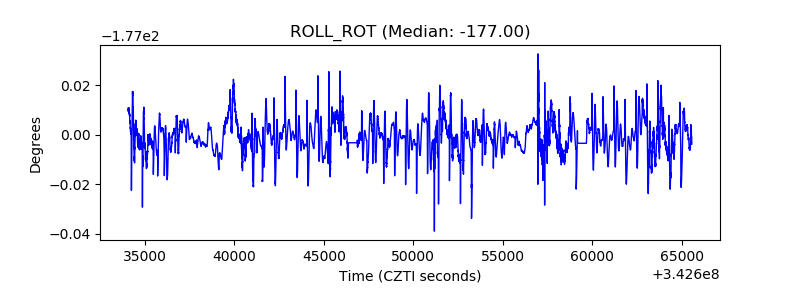 |
| _Roll_DEC | 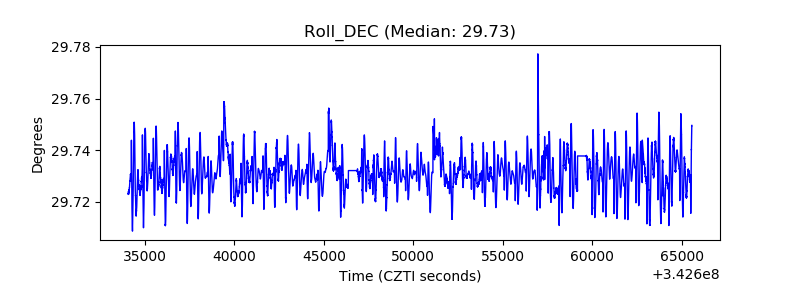 |
| _Roll_RA | 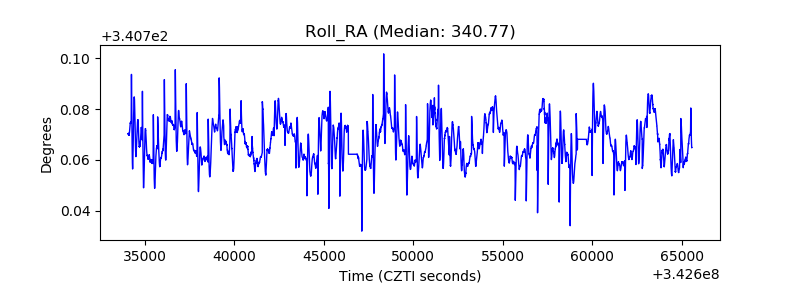 |
| Veto Counter | 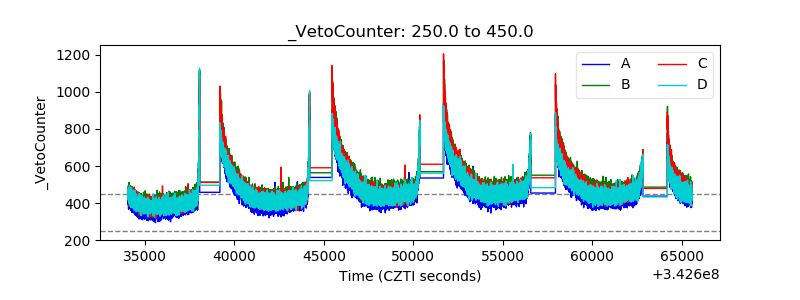 |