| Param | Original file | Final file |
|---|---|---|
| Filename | modeM0/AS1T03_257T01_9000003976_27678cztM0_level2.evt | modeM0/AS1T03_257T01_9000003976_27678cztM0_level2_quad_clean.evt |
| Size (bytes) | 516,329,280 | 81,515,520 |
| Size | 492.4 MB | 77.7 MB |
| Events in quadrant A | 3,310,710 | 510,760 |
| Events in quadrant B | 3,488,618 | 527,721 |
| Events in quadrant C | 3,485,387 | 491,934 |
| Events in quadrant D | 4,892,779 | 465,750 |
| Mode M9 | |||
|---|---|---|---|
| Quadrant | BADHDUFLAG | Total packets | Discarded packets |
| A | 0 | 16 | 0 |
| B | 0 | 17 | 0 |
| C | 0 | 17 | 0 |
| D | 0 | 17 | 0 |
| Mode M0 | |||
|---|---|---|---|
| Quadrant | BADHDUFLAG | Total packets | Discarded packets |
| A | 0 | 14009 | 0 |
| B | 0 | 14491 | 0 |
| C | 0 | 14448 | 0 |
| D | 0 | 19157 | 0 |
| Quadrant | Total seconds | Saturated seconds | Saturation percentage |
|---|---|---|---|
| A | 6780 | 38 | 0.560472% |
| B | 6780 | 65 | 0.958702% |
| C | 6780 | 86 | 1.268437% |
| D | 6780 | 209 | 3.082596% |
Noise dominated data is calculated using 1-second bins in cleaned event files. If a bin has >2000 counts, and if more than 50% of those come from <1% of pixels, then it is considered to be noise-dominated and hence unusable.
| Quadrant | # 1 sec bins | Bins with >0 counts | Bins with >2000 counts | High rate bins dominated by noise | Noise dominated (total time) | Noise dominated (detector-on time) | Marked lightcurve |
|---|---|---|---|---|---|---|---|
| A | 7880 | 6781 | 2 | 2 | 0.03% | 0.03% | 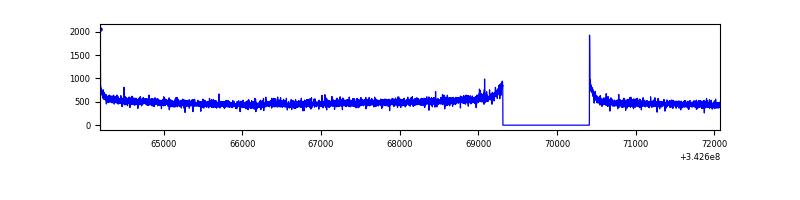 |
| B | 7880 | 6780 | 15 | 15 | 0.19% | 0.22% | 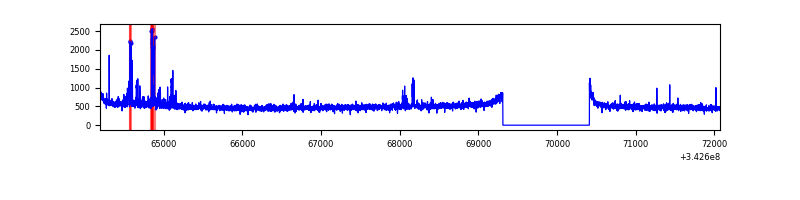 |
| C | 7880 | 6780 | 13 | 13 | 0.16% | 0.19% | 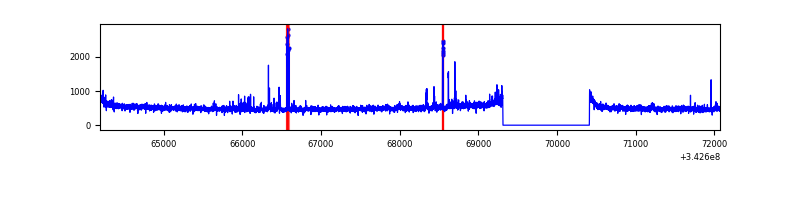 |
| D | 7880 | 6781 | 152 | 152 | 1.93% | 2.24% | 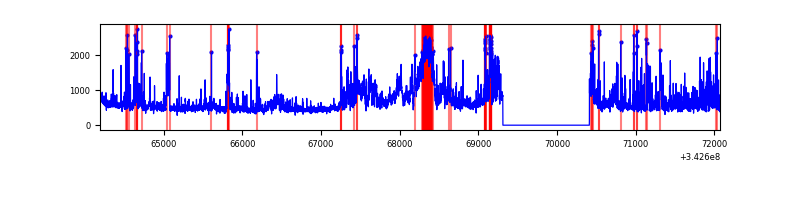 |
Top three noisy pixels from each quadrant. If the there are fewer than three noisy pixels in the level2.evt file, extra rows are filled as -1
| Pixel properties | Quadrant properties | ||||||
|---|---|---|---|---|---|---|---|
| Quadrant | DetID | PixID | Counts | Sigma | Mean | Median | Sigma |
| A | 8 | 192 | 12572 | 68.11 | 851 | 836 | 172.3 |
| A | 13 | 254 | 11444 | 61.56 | 851 | 836 | 172.3 |
| A | 15 | 174 | 9061 | 47.73 | 851 | 836 | 172.3 |
| B | 3 | 64 | 95381 | 580.08 | 855 | 833 | 163.0 |
| B | 0 | 230 | 22670 | 133.98 | 855 | 833 | 163.0 |
| B | 12 | 111 | 19465 | 114.31 | 855 | 833 | 163.0 |
| C | 14 | 238 | 133899 | 692.41 | 819 | 823 | 192.2 |
| C | 3 | 233 | 82197 | 423.4 | 819 | 823 | 192.2 |
| C | 8 | 208 | 70477 | 362.42 | 819 | 823 | 192.2 |
| D | 1 | 52 | 802438 | 4111.25 | 811 | 790 | 195.0 |
| D | 12 | 2 | 767421 | 3931.67 | 811 | 790 | 195.0 |
| D | 2 | 250 | 144089 | 734.91 | 811 | 790 | 195.0 |
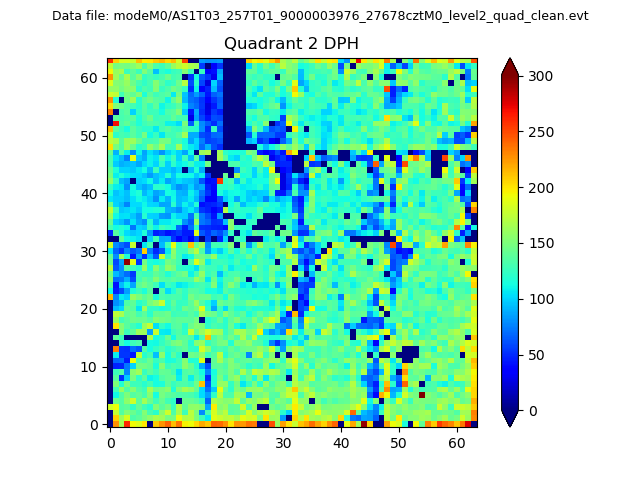
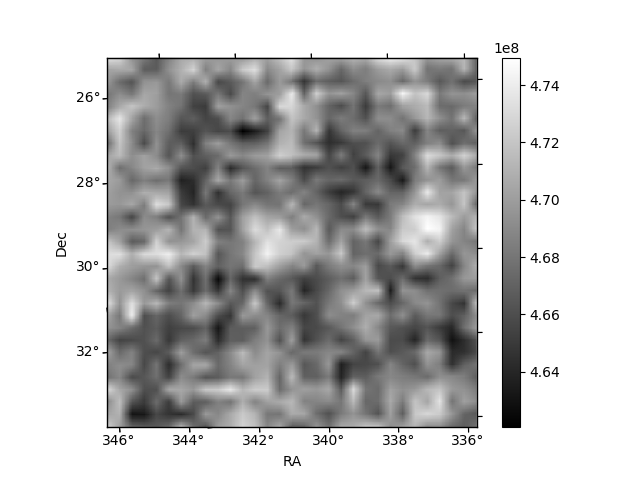
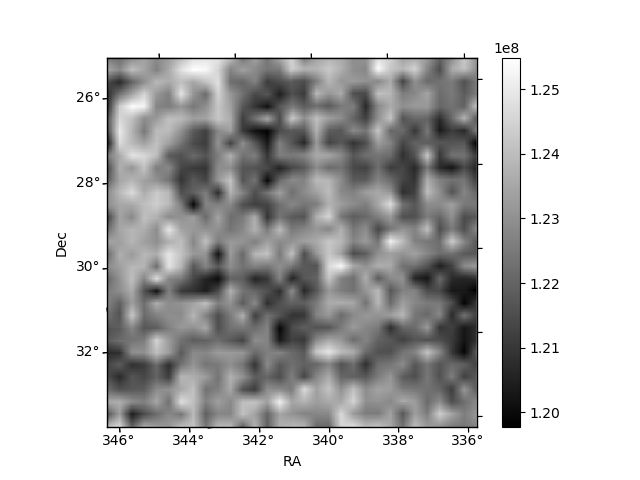
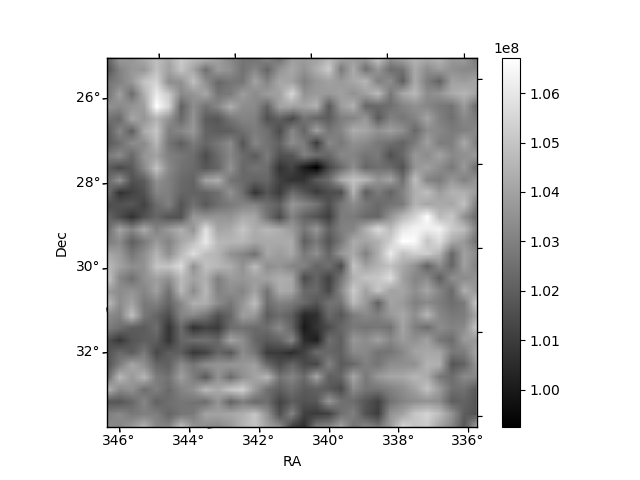
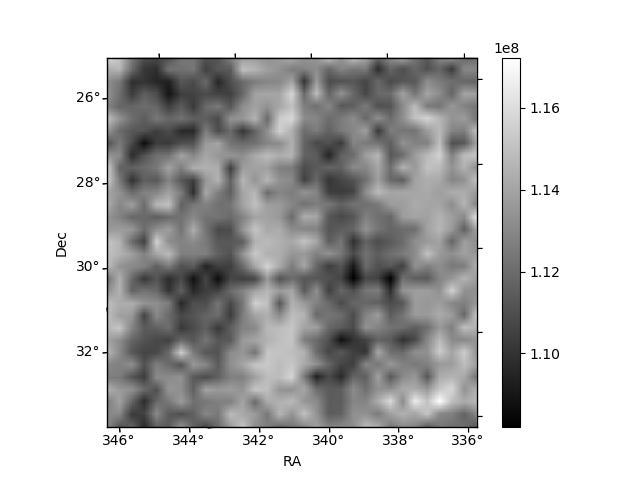
Histogram calculated using DETX and DETY for each event in the final _common_clean file
| Quadrant A | 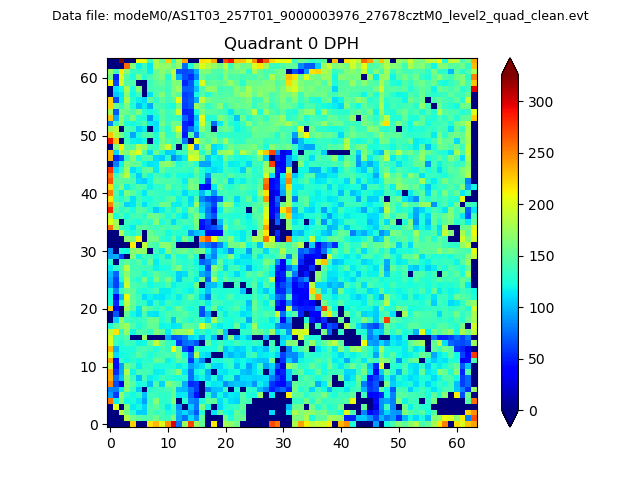 |
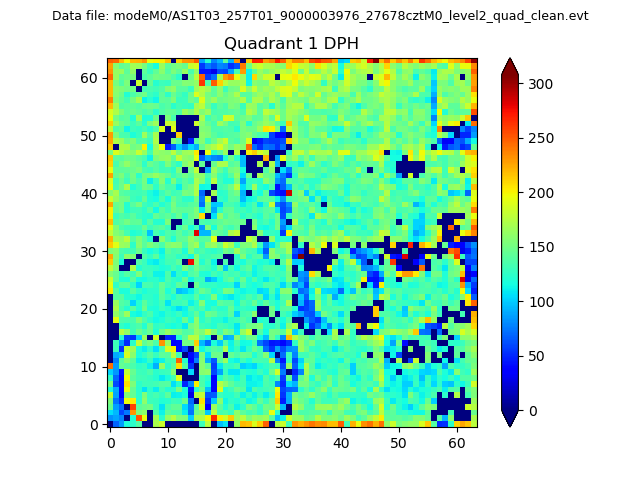 |
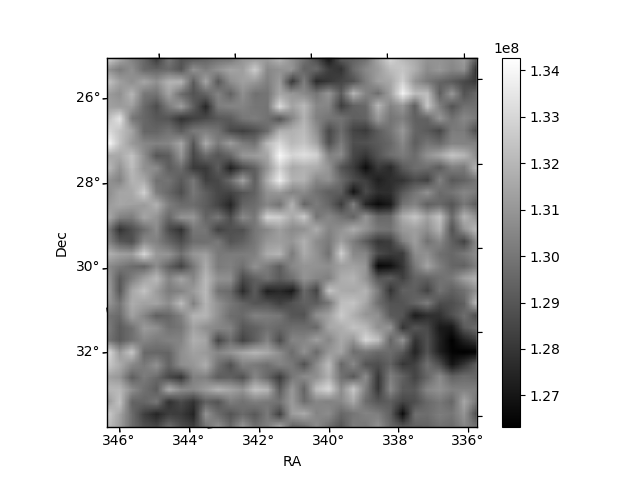
Quadrant B |
|---|---|---|---|
| Quadrant D | 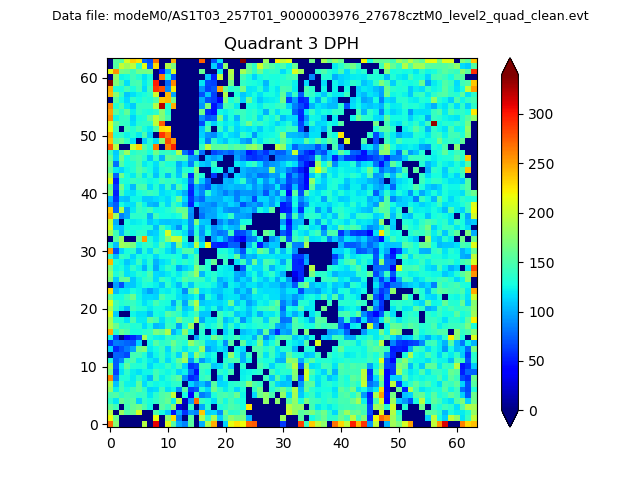 |
 |
Quadrant C |
| Plot type | Count rate plots | Images |
|---|---|---|
| Comparison with Poisson distribution Blue bars denote a histogram of data divided into 1 sec bins. Red curve is a Poisson curve with rate = median count rate of data. |
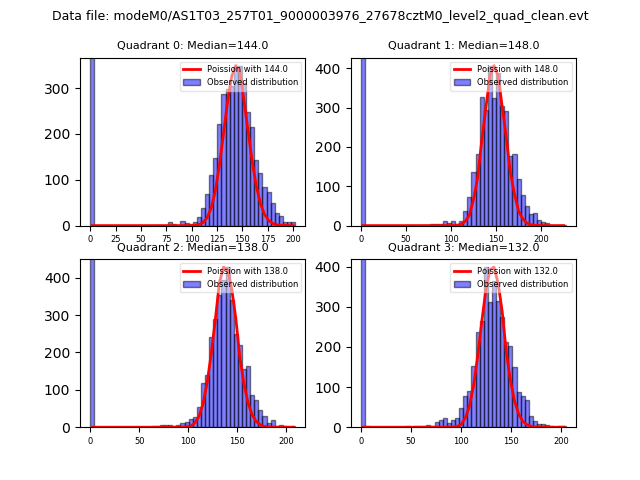 |
 |
| Quadrant-wise count rates Data is divided into 100 sec bins |
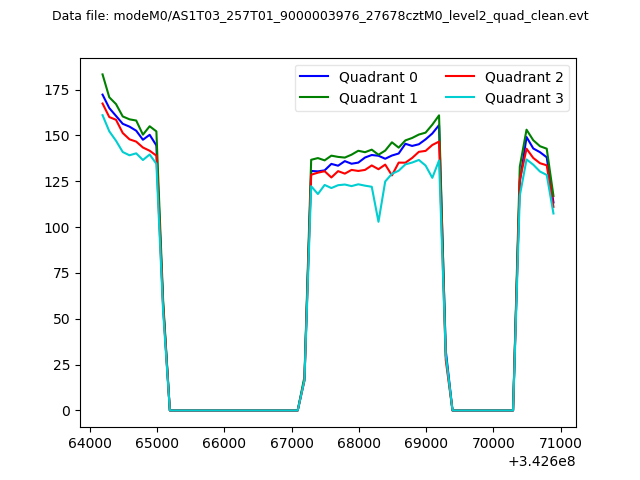 |
|
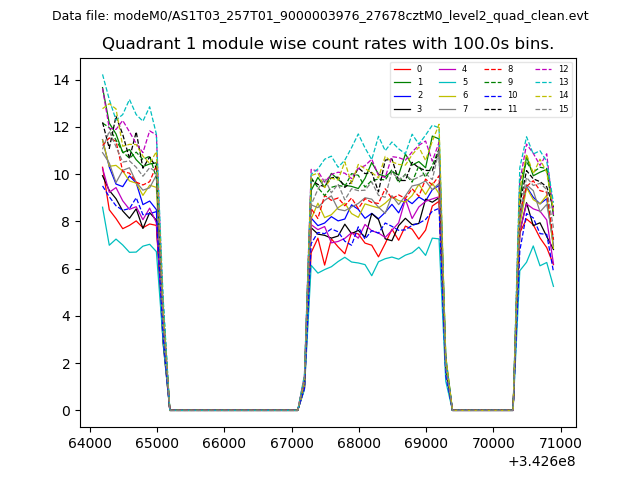
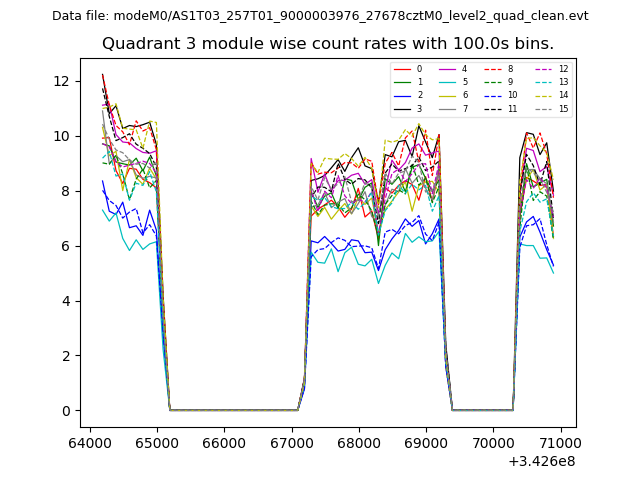
| Module-wise count rates for Quadrant A Data is divided into 100 sec bins |
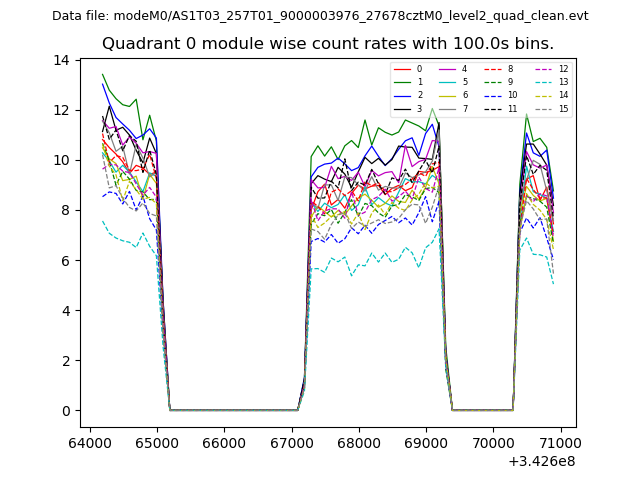 |
 |
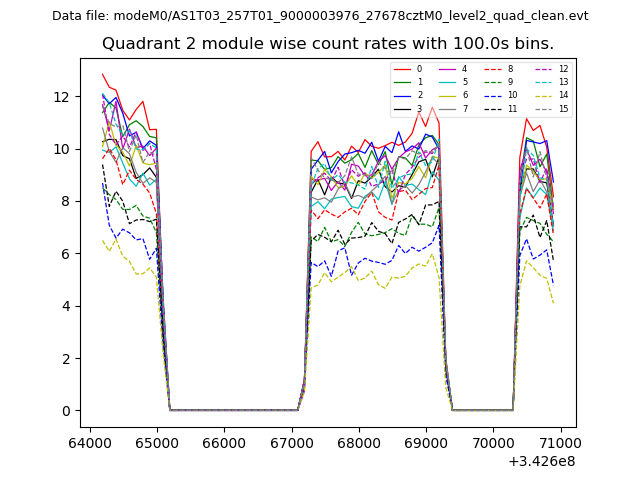
| Module-wise count rates for Quadrant B Data is divided into 100 sec bins |
 |
 |
| Module-wise count rates for Quadrant C Data is divided into 100 sec bins |
 |
 |
| Module-wise count rates for Quadrant D Data is divided into 100 sec bins |
 |
 |
| Parameter | Plot |
|---|---|
| CZT HV Monitor | 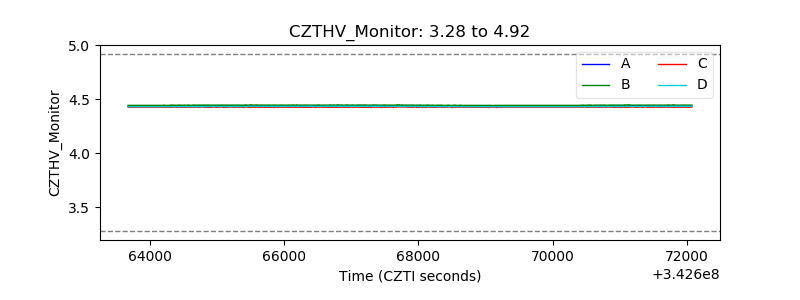 |
| D_VDD | 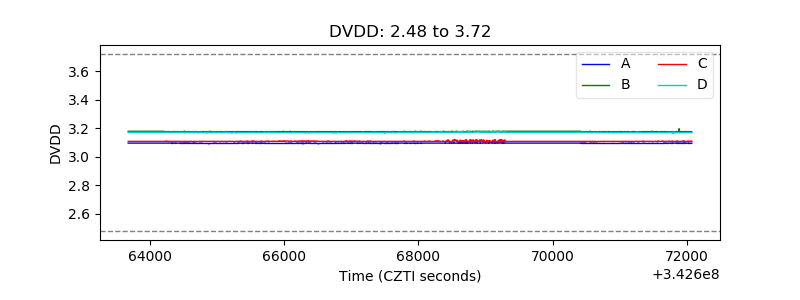 |
| Temperature 1 | 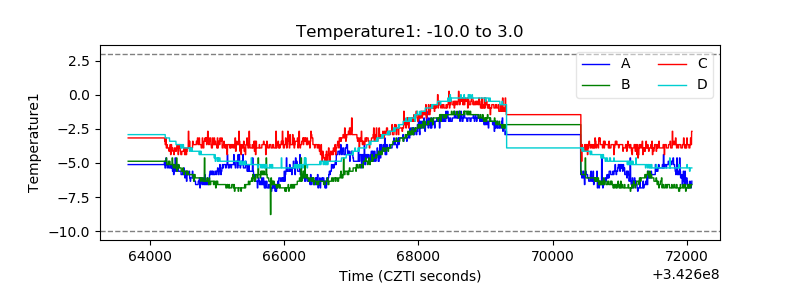 |
| Veto HV Monitor | 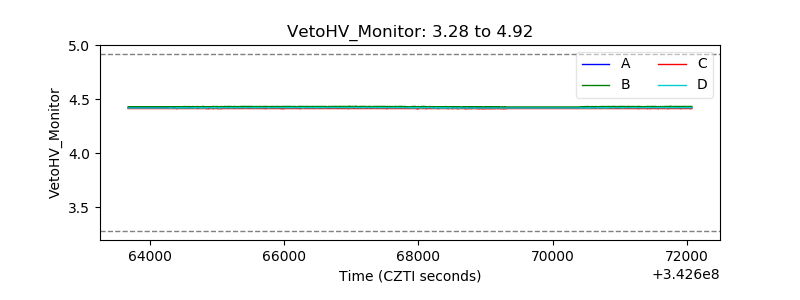 |
| Veto LLD | 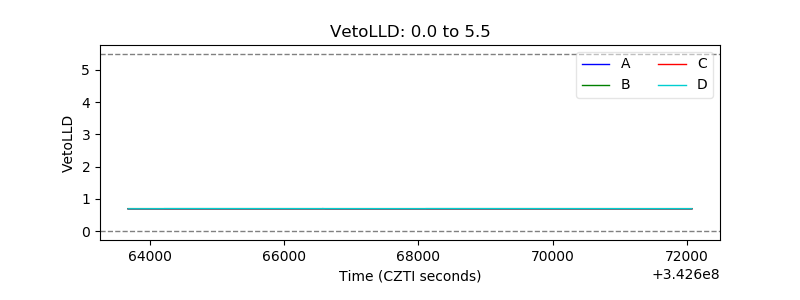 |
| Alpha Counter | 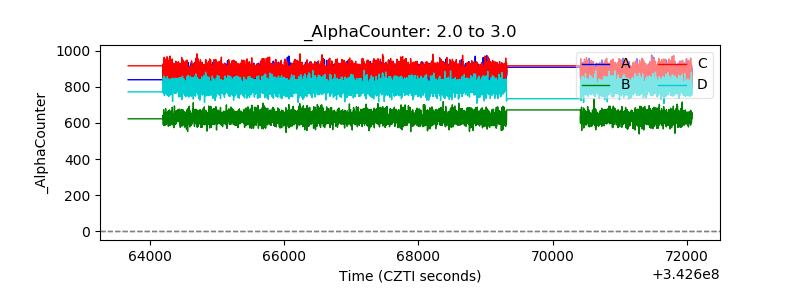 |
| _CPM_Rate | 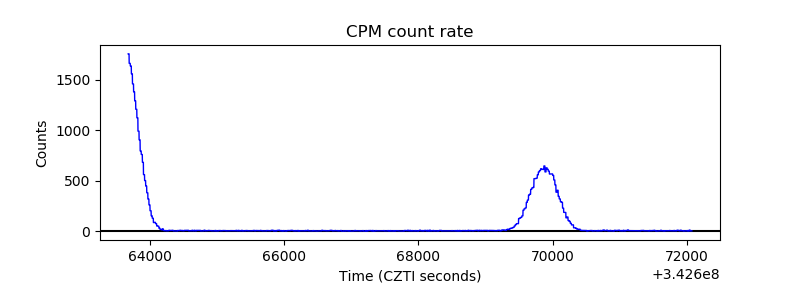 |
| CZT Counter | 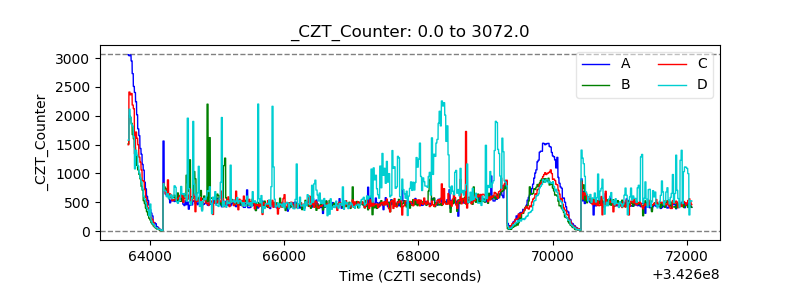 |
| +2.5 Volts monitor |  |
| +5 Volts monitor |  |
| _ROLL_ROT | 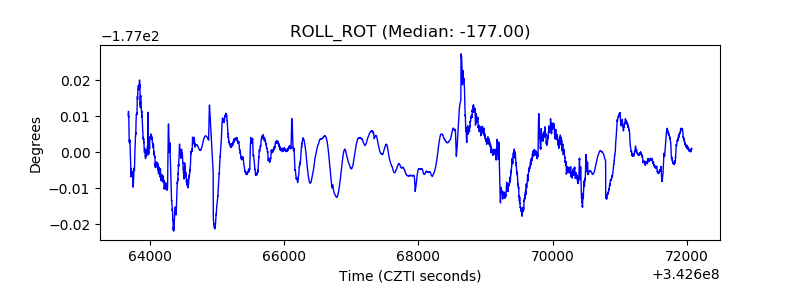 |
| _Roll_DEC | 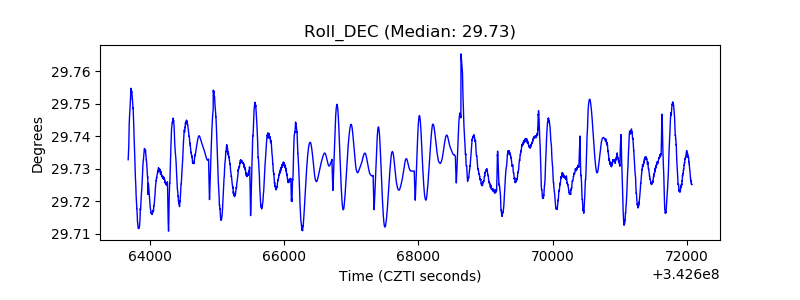 |
| _Roll_RA | 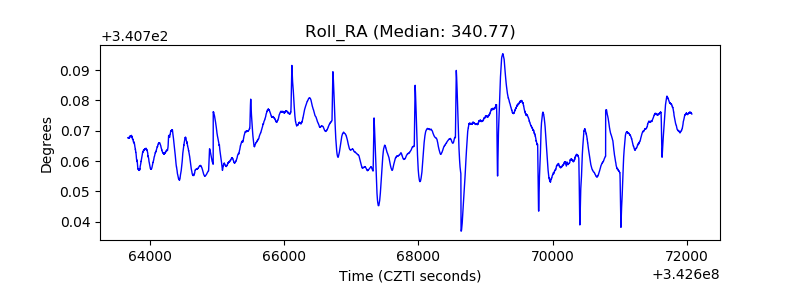 |
| Veto Counter | 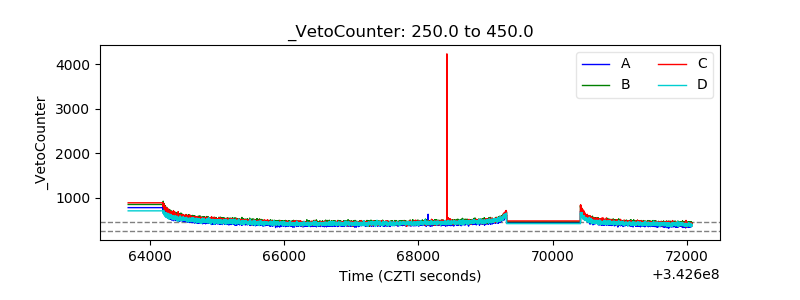 |