| Param | Original file | Final file |
|---|---|---|
| Filename | modeM0/AS1T03_257T01_9000003976_27679cztM0_level2.evt | modeM0/AS1T03_257T01_9000003976_27679cztM0_level2_quad_clean.evt |
| Size (bytes) | 534,196,800 | 69,672,960 |
| Size | 509.4 MB | 66.4 MB |
| Events in quadrant A | 3,204,586 | 423,158 |
| Events in quadrant B | 3,280,944 | 433,426 |
| Events in quadrant C | 3,382,639 | 410,477 |
| Events in quadrant D | 5,850,693 | 370,434 |
| Mode M9 | |||
|---|---|---|---|
| Quadrant | BADHDUFLAG | Total packets | Discarded packets |
| A | 0 | 7 | 0 |
| B | 0 | 7 | 0 |
| C | 0 | 7 | 0 |
| D | 0 | 7 | 0 |
| Mode M0 | |||
|---|---|---|---|
| Quadrant | BADHDUFLAG | Total packets | Discarded packets |
| A | 0 | 13890 | 0 |
| B | 0 | 13950 | 0 |
| C | 0 | 14220 | 0 |
| D | 0 | 22048 | 0 |
| Quadrant | Total seconds | Saturated seconds | Saturation percentage |
|---|---|---|---|
| A | 6766 | 84 | 1.241502% |
| B | 6767 | 106 | 1.566425% |
| C | 6767 | 108 | 1.595980% |
| D | 6767 | 700 | 10.344318% |
Noise dominated data is calculated using 1-second bins in cleaned event files. If a bin has >2000 counts, and if more than 50% of those come from <1% of pixels, then it is considered to be noise-dominated and hence unusable.
| Quadrant | # 1 sec bins | Bins with >0 counts | Bins with >2000 counts | High rate bins dominated by noise | Noise dominated (total time) | Noise dominated (detector-on time) | Marked lightcurve |
|---|---|---|---|---|---|---|---|
| A | 7451 | 6766 | 0 | 0 | 0.00% | 0.00% | 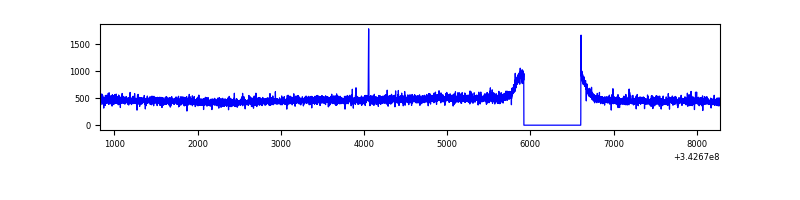 |
| B | 7452 | 6767 | 0 | 0 | 0.00% | 0.00% | 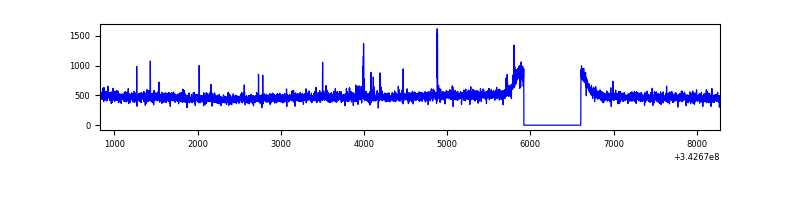 |
| C | 7452 | 6767 | 1 | 1 | 0.01% | 0.01% | 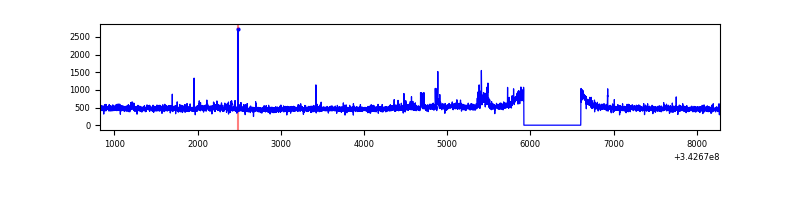 |
| D | 7452 | 6767 | 660 | 660 | 8.86% | 9.75% | 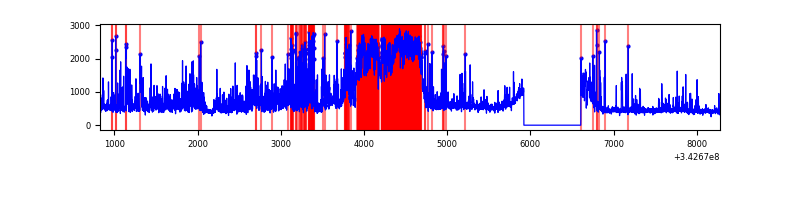 |
Top three noisy pixels from each quadrant. If the there are fewer than three noisy pixels in the level2.evt file, extra rows are filled as -1
| Pixel properties | Quadrant properties | ||||||
|---|---|---|---|---|---|---|---|
| Quadrant | DetID | PixID | Counts | Sigma | Mean | Median | Sigma |
| A | 13 | 254 | 11258 | 62.15 | 827 | 807 | 168.2 |
| A | 15 | 174 | 8855 | 47.86 | 827 | 807 | 168.2 |
| A | 3 | 137 | 8037 | 43.0 | 827 | 807 | 168.2 |
| B | 12 | 111 | 19721 | 118.82 | 828 | 806 | 159.2 |
| B | 11 | 111 | 17893 | 107.34 | 828 | 806 | 159.2 |
| B | 14 | 111 | 15992 | 95.4 | 828 | 806 | 159.2 |
| C | 14 | 238 | 127739 | 676.32 | 796 | 801 | 187.7 |
| C | 3 | 233 | 122185 | 646.73 | 796 | 801 | 187.7 |
| C | 8 | 208 | 25829 | 133.35 | 796 | 801 | 187.7 |
| D | 12 | 2 | 1481058 | 7951.73 | 777 | 756 | 186.2 |
| D | 1 | 52 | 1243456 | 6675.41 | 777 | 756 | 186.2 |
| D | 2 | 250 | 114260 | 609.71 | 777 | 756 | 186.2 |
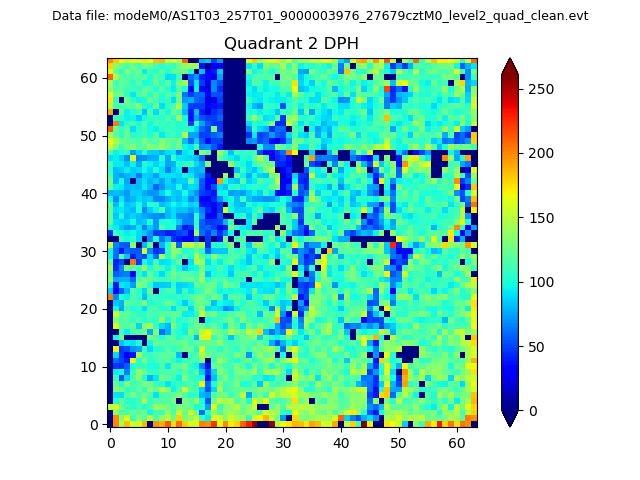
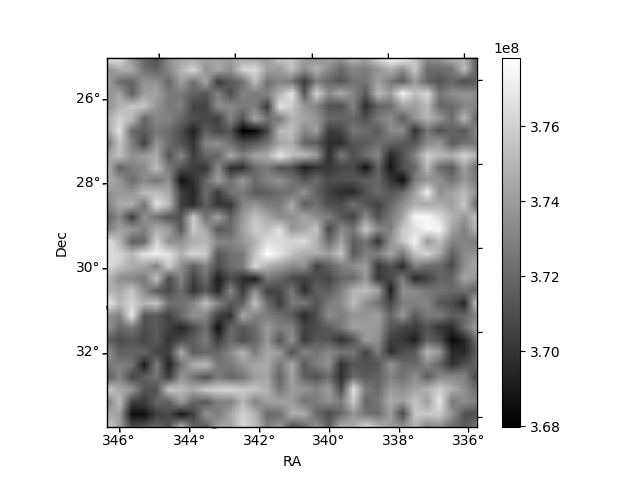
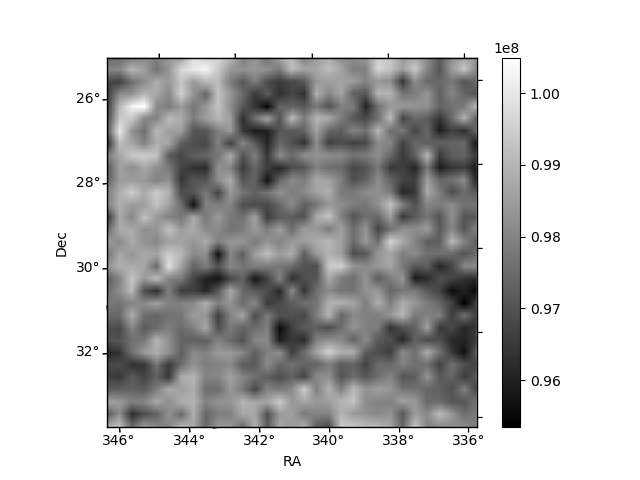
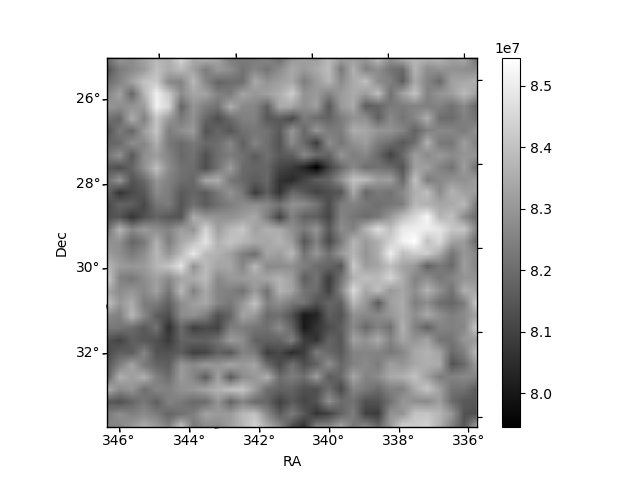
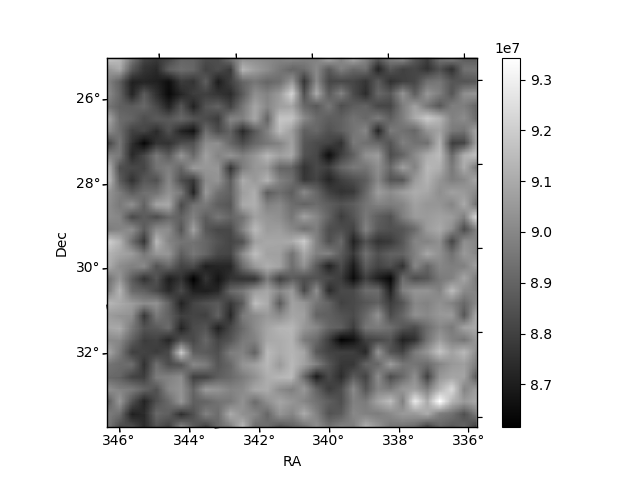
Histogram calculated using DETX and DETY for each event in the final _common_clean file
| Quadrant A | 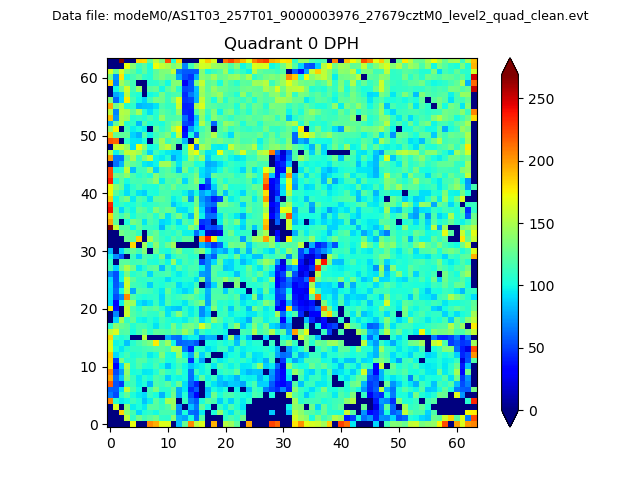 |
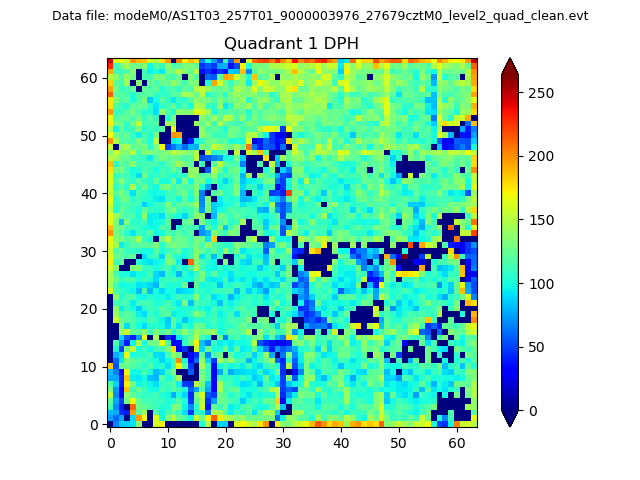 |
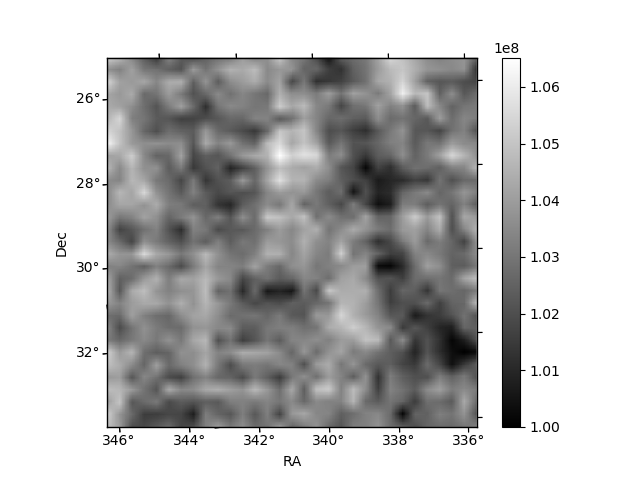
Quadrant B |
|---|---|---|---|
| Quadrant D | 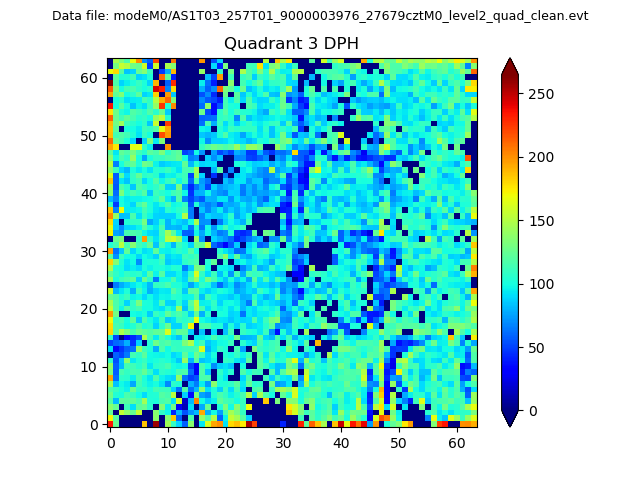 |
 |
Quadrant C |
| Plot type | Count rate plots | Images |
|---|---|---|
| Comparison with Poisson distribution Blue bars denote a histogram of data divided into 1 sec bins. Red curve is a Poisson curve with rate = median count rate of data. |
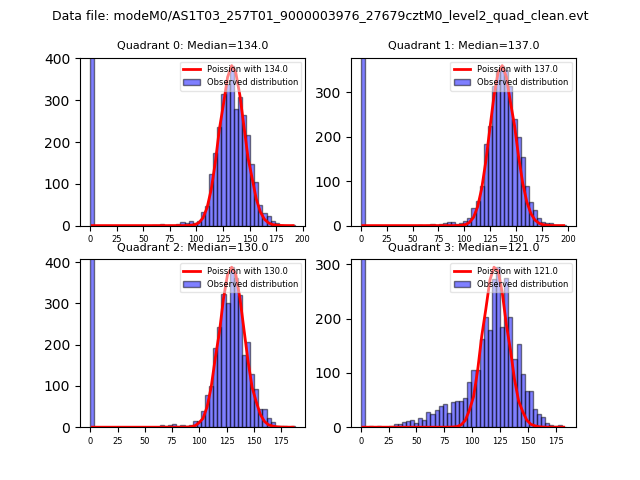 |
 |
| Quadrant-wise count rates Data is divided into 100 sec bins |
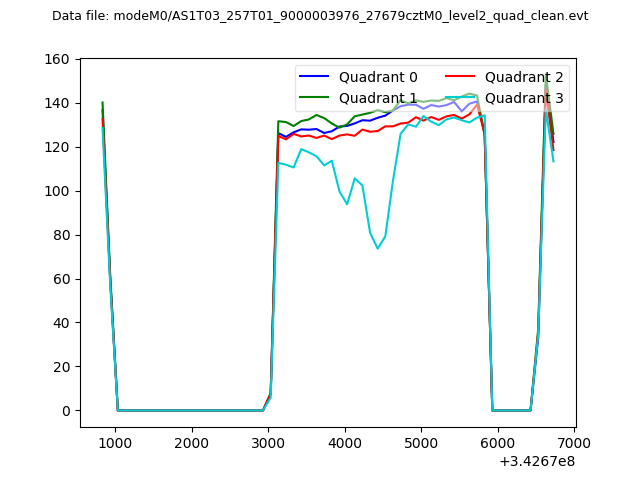 |
|
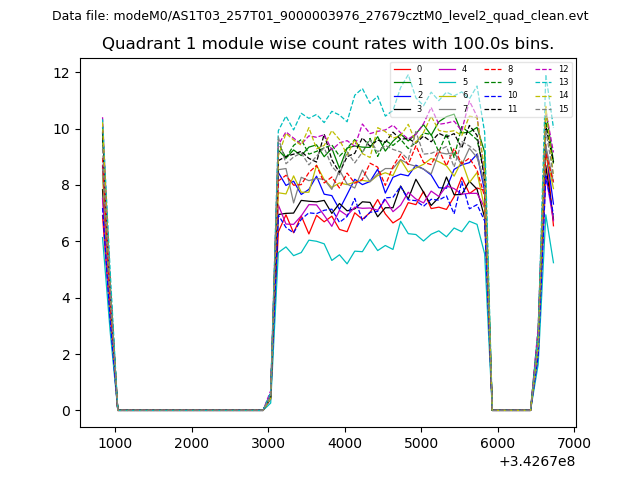
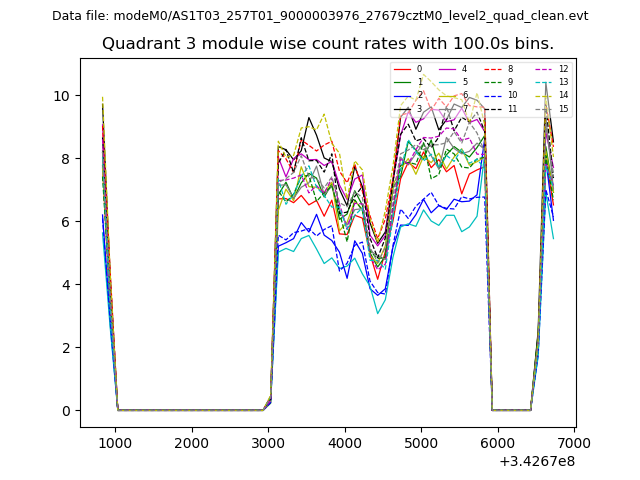
| Module-wise count rates for Quadrant A Data is divided into 100 sec bins |
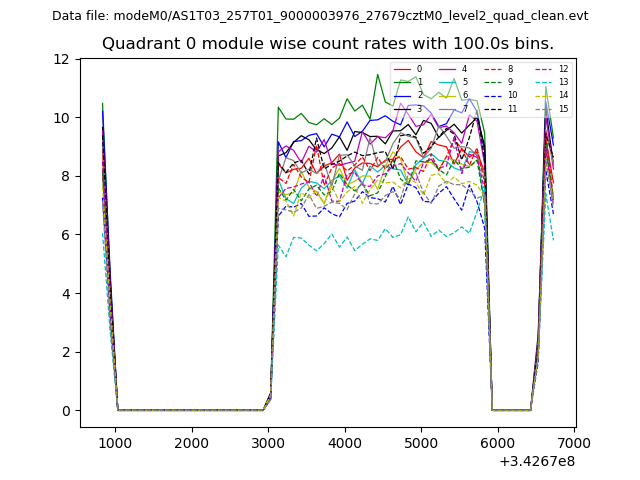 |
 |
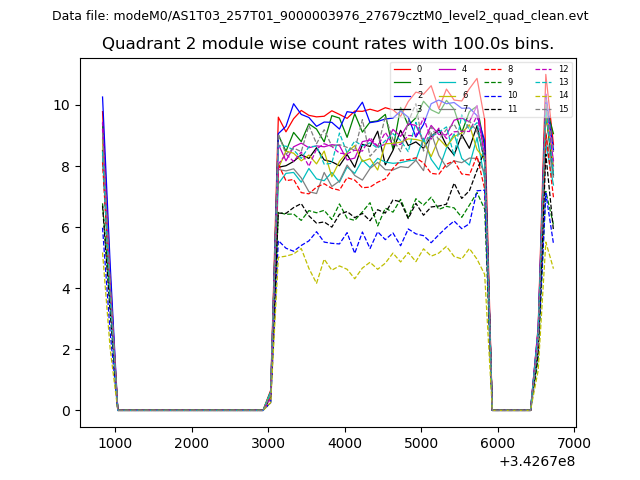
| Module-wise count rates for Quadrant B Data is divided into 100 sec bins |
 |
 |
| Module-wise count rates for Quadrant C Data is divided into 100 sec bins |
 |
 |
| Module-wise count rates for Quadrant D Data is divided into 100 sec bins |
 |
 |
| Parameter | Plot |
|---|---|
| CZT HV Monitor | 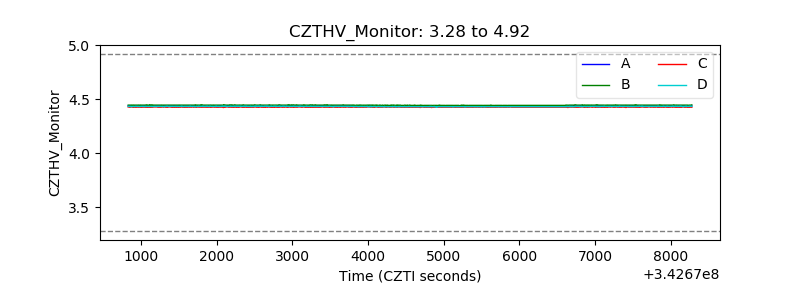 |
| D_VDD | 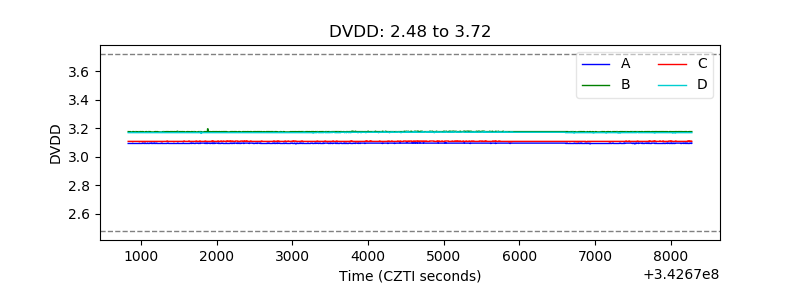 |
| Temperature 1 | 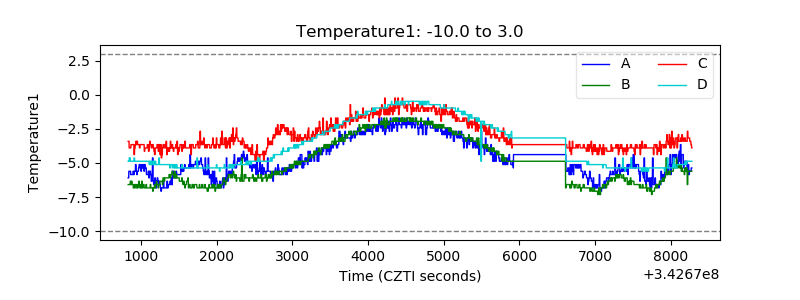 |
| Veto HV Monitor | 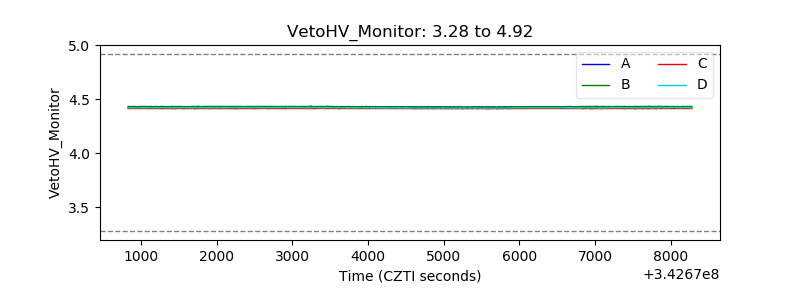 |
| Veto LLD | 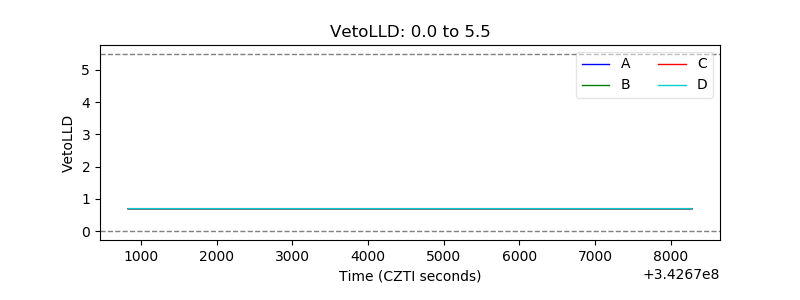 |
| Alpha Counter | 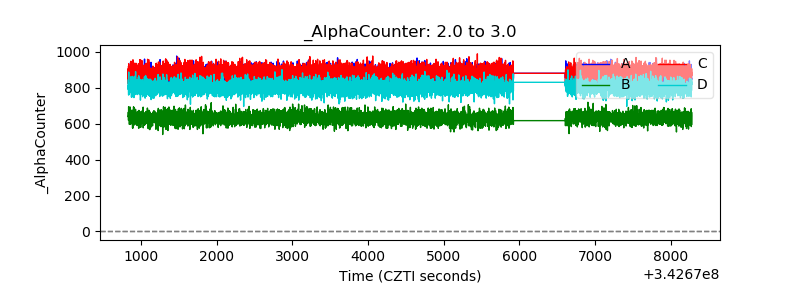 |
| _CPM_Rate | 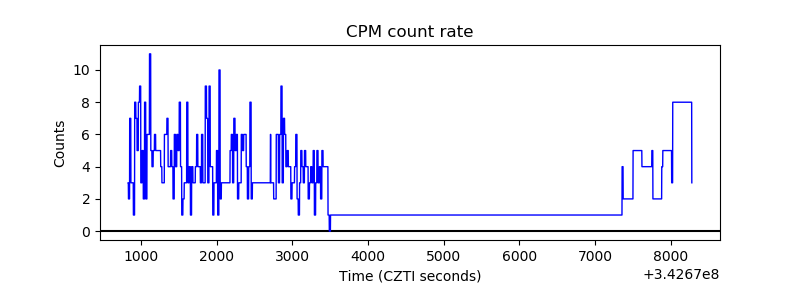 |
| CZT Counter | 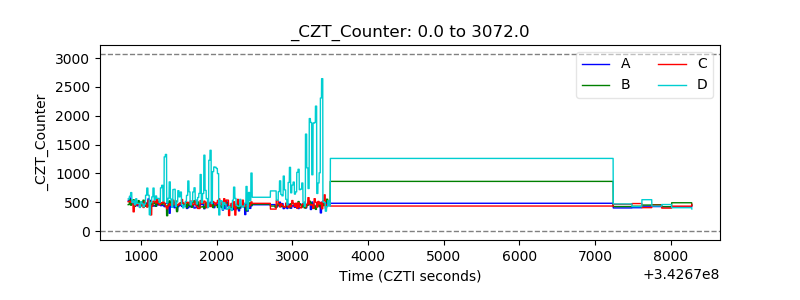 |
| +2.5 Volts monitor | 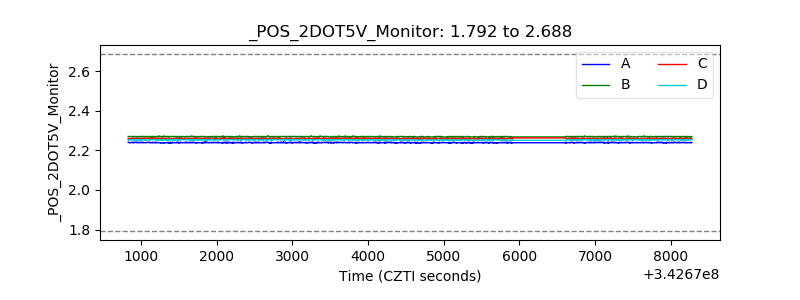 |
| +5 Volts monitor | 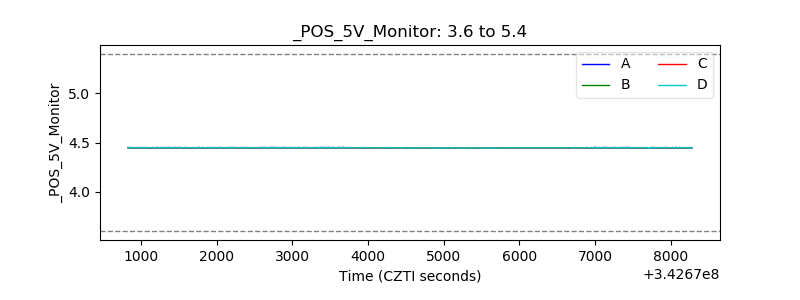 |
| _ROLL_ROT | 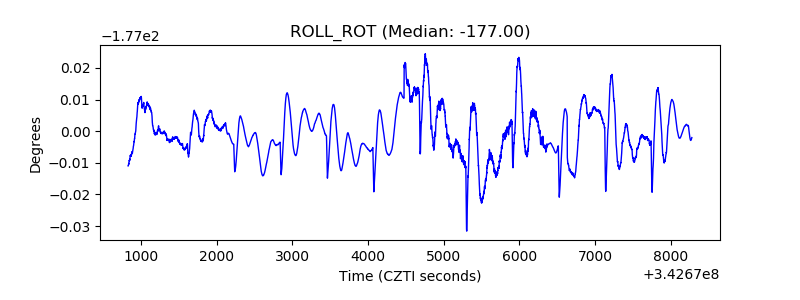 |
| _Roll_DEC | 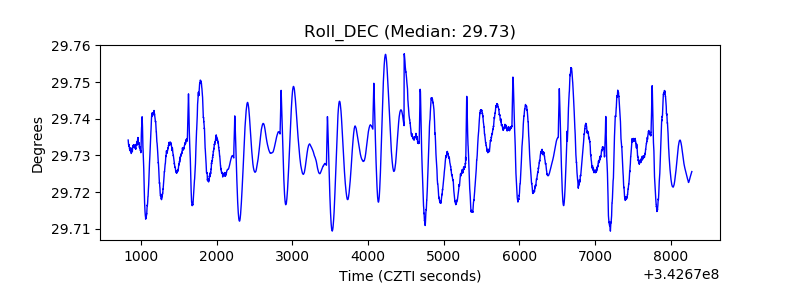 |
| _Roll_RA | 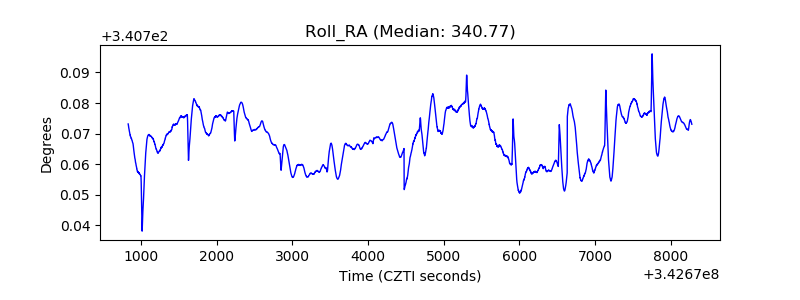 |
| Veto Counter | 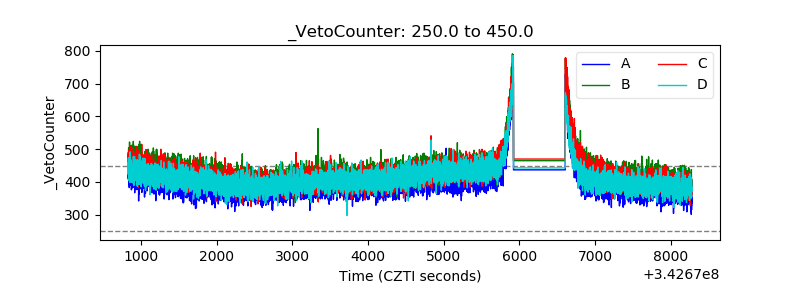 |