| Param | Original file | Final file |
|---|---|---|
| Filename | modeM0/AS1T03_257T01_9000003976_27680cztM0_level2.evt | modeM0/AS1T03_257T01_9000003976_27680cztM0_level2_quad_clean.evt |
| Size (bytes) | 569,185,920 | 82,016,640 |
| Size | 542.8 MB | 78.2 MB |
| Events in quadrant A | 3,653,259 | 499,855 |
| Events in quadrant B | 3,727,513 | 507,233 |
| Events in quadrant C | 3,813,553 | 486,147 |
| Events in quadrant D | 5,524,503 | 457,943 |
| Mode M9 | |||
|---|---|---|---|
| Quadrant | BADHDUFLAG | Total packets | Discarded packets |
| A | 0 | 10 | 0 |
| B | 0 | 10 | 0 |
| C | 0 | 10 | 0 |
| D | 0 | 10 | 0 |
| Mode M0 | |||
|---|---|---|---|
| Quadrant | BADHDUFLAG | Total packets | Discarded packets |
| A | 0 | 15860 | 0 |
| B | 0 | 15892 | 0 |
| C | 0 | 16099 | 0 |
| D | 0 | 21864 | 0 |
| Quadrant | Total seconds | Saturated seconds | Saturation percentage |
|---|---|---|---|
| A | 7643 | 168 | 2.198090% |
| B | 7643 | 229 | 2.996206% |
| C | 7643 | 200 | 2.616774% |
| D | 7643 | 486 | 6.358760% |
Noise dominated data is calculated using 1-second bins in cleaned event files. If a bin has >2000 counts, and if more than 50% of those come from <1% of pixels, then it is considered to be noise-dominated and hence unusable.
| Quadrant | # 1 sec bins | Bins with >0 counts | Bins with >2000 counts | High rate bins dominated by noise | Noise dominated (total time) | Noise dominated (detector-on time) | Marked lightcurve |
|---|---|---|---|---|---|---|---|
| A | 8608 | 7643 | 0 | 0 | 0.00% | 0.00% | 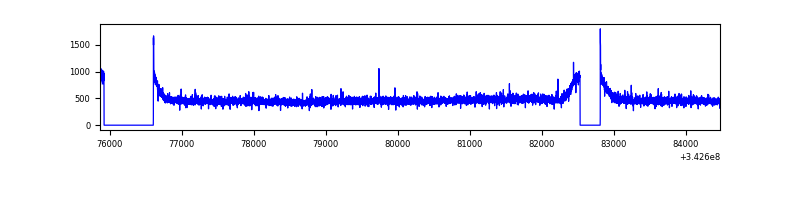 |
| B | 8608 | 7643 | 1 | 1 | 0.01% | 0.01% | 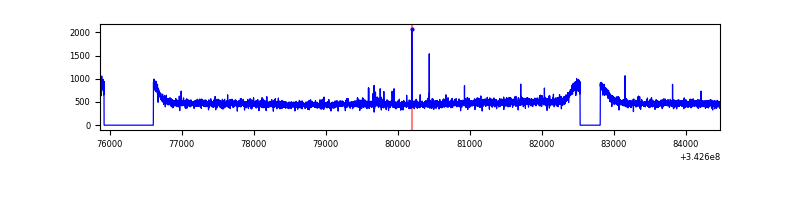 |
| C | 8608 | 7643 | 7 | 7 | 0.08% | 0.09% | 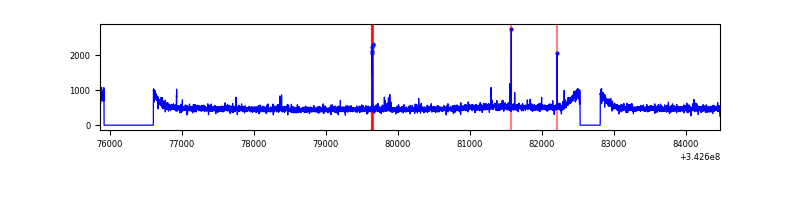 |
| D | 8608 | 7643 | 467 | 467 | 5.43% | 6.11% | 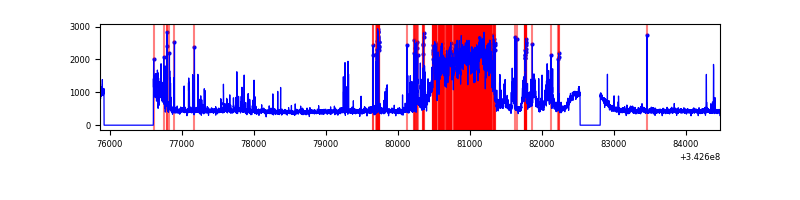 |
Top three noisy pixels from each quadrant. If the there are fewer than three noisy pixels in the level2.evt file, extra rows are filled as -1
| Pixel properties | Quadrant properties | ||||||
|---|---|---|---|---|---|---|---|
| Quadrant | DetID | PixID | Counts | Sigma | Mean | Median | Sigma |
| A | 13 | 254 | 12088 | 58.61 | 944 | 922 | 190.5 |
| A | 8 | 192 | 11268 | 54.3 | 944 | 922 | 190.5 |
| A | 3 | 137 | 9573 | 45.41 | 944 | 922 | 190.5 |
| B | 12 | 111 | 23222 | 121.33 | 943 | 917 | 183.8 |
| B | 11 | 111 | 20413 | 106.05 | 943 | 917 | 183.8 |
| B | 14 | 111 | 18500 | 95.64 | 943 | 917 | 183.8 |
| C | 14 | 238 | 143694 | 659.25 | 913 | 920 | 216.6 |
| C | 3 | 233 | 101189 | 462.99 | 913 | 920 | 216.6 |
| C | 15 | 208 | 9115 | 37.84 | 913 | 920 | 216.6 |
| D | 12 | 2 | 1514249 | 6981.31 | 904 | 879 | 216.8 |
| D | 1 | 52 | 430734 | 1982.96 | 904 | 879 | 216.8 |
| D | 2 | 250 | 120617 | 552.36 | 904 | 879 | 216.8 |
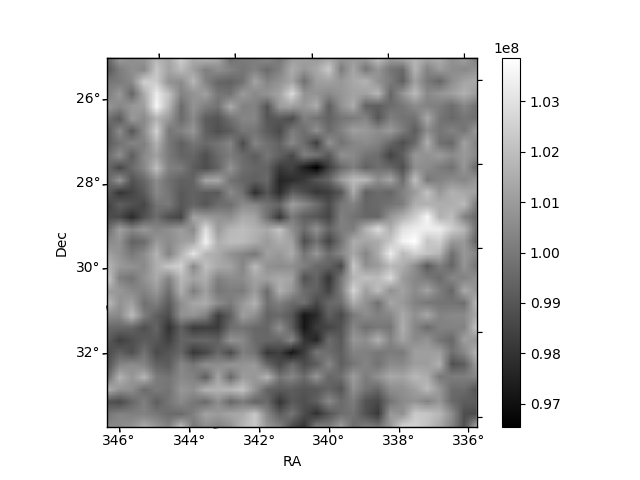
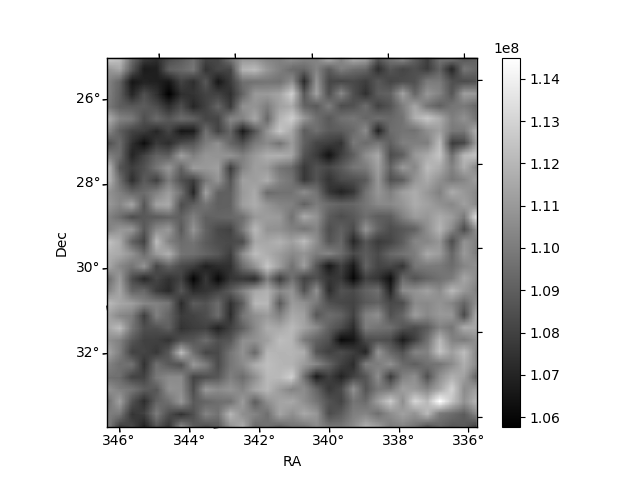
Histogram calculated using DETX and DETY for each event in the final _common_clean file
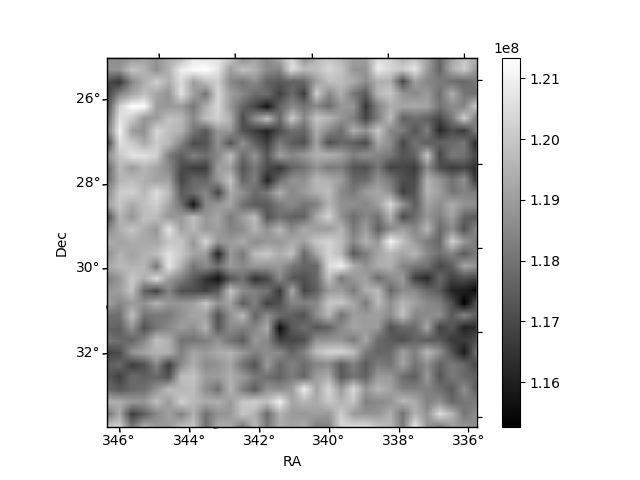
| Quadrant A |  |
 |
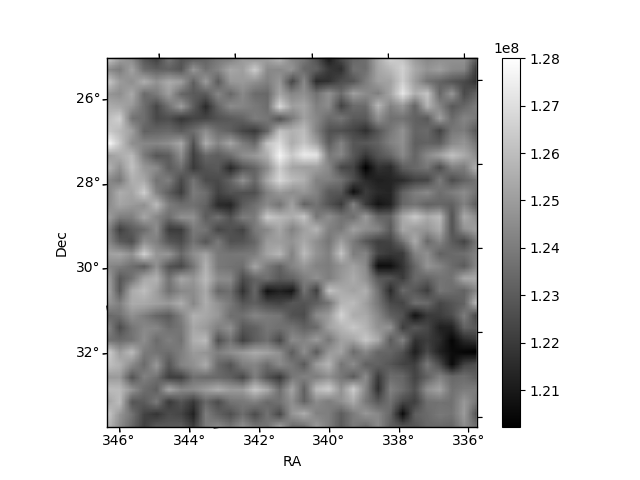
Quadrant B |
|---|---|---|---|
| Quadrant D |  |
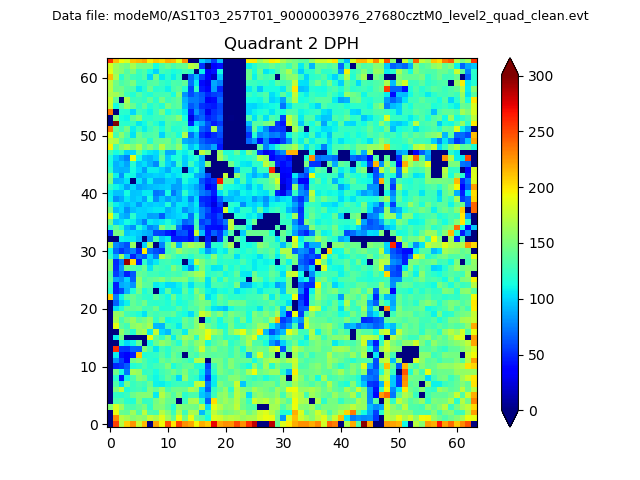 |
Quadrant C |
| Plot type | Count rate plots | Images |
|---|---|---|
| Comparison with Poisson distribution Blue bars denote a histogram of data divided into 1 sec bins. Red curve is a Poisson curve with rate = median count rate of data. |
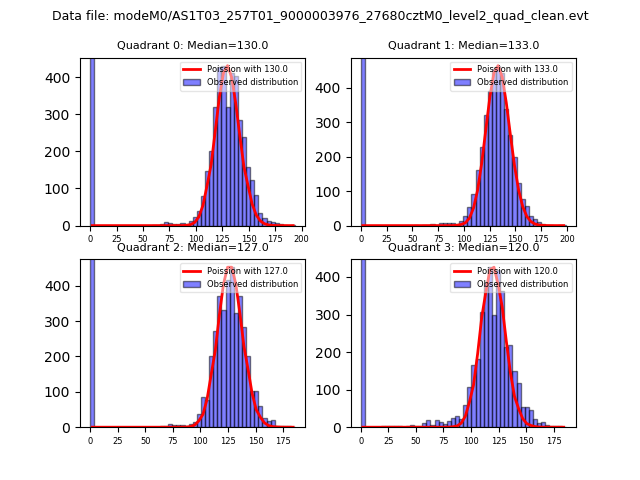 |
 |
| Quadrant-wise count rates Data is divided into 100 sec bins |
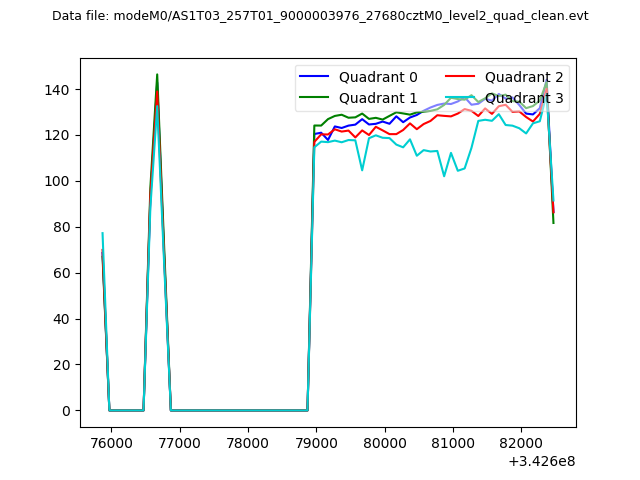 |
|
| Module-wise count rates for Quadrant A Data is divided into 100 sec bins |
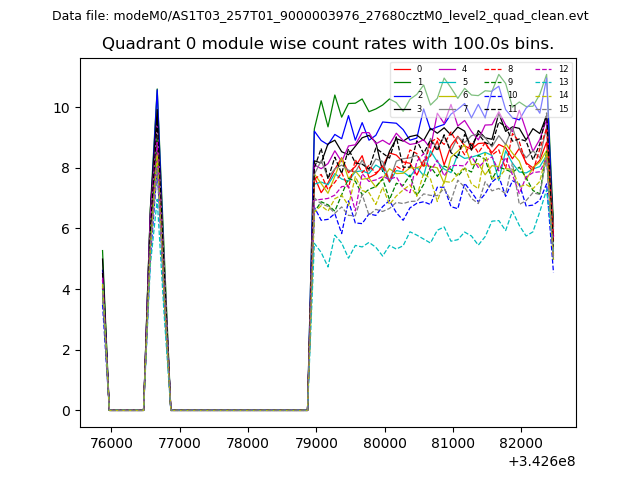 |
 |
| Module-wise count rates for Quadrant B Data is divided into 100 sec bins |
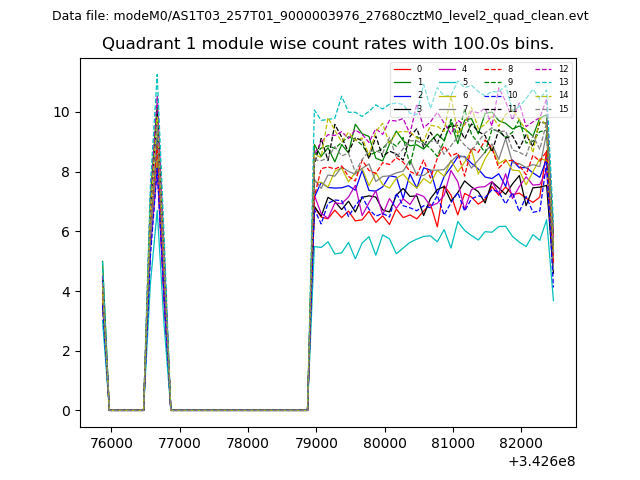 |
 |
| Module-wise count rates for Quadrant C Data is divided into 100 sec bins |
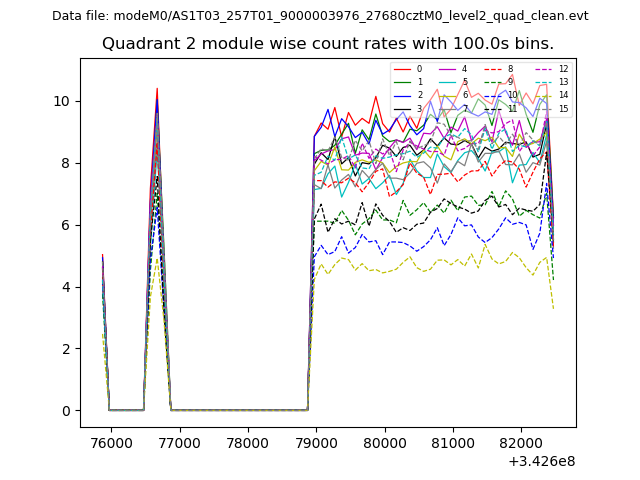 |
 |
| Module-wise count rates for Quadrant D Data is divided into 100 sec bins |
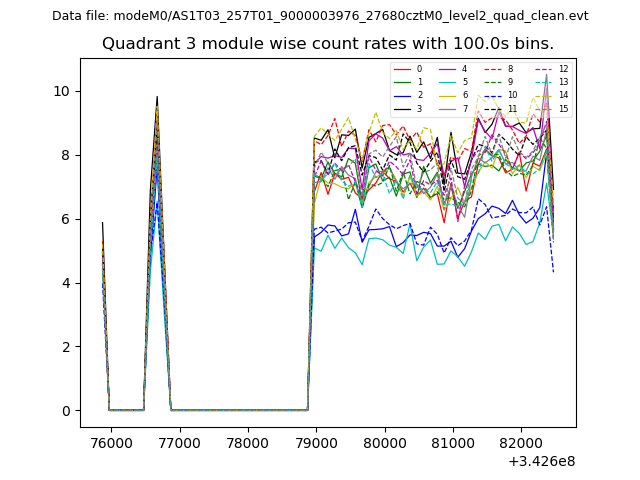 |
 |
| Parameter | Plot |
|---|---|
| CZT HV Monitor | 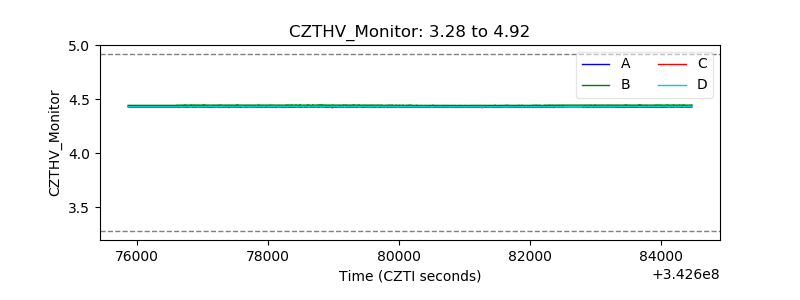 |
| D_VDD | 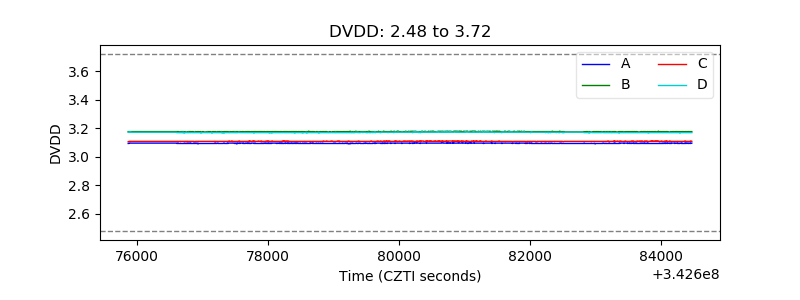 |
| Temperature 1 | 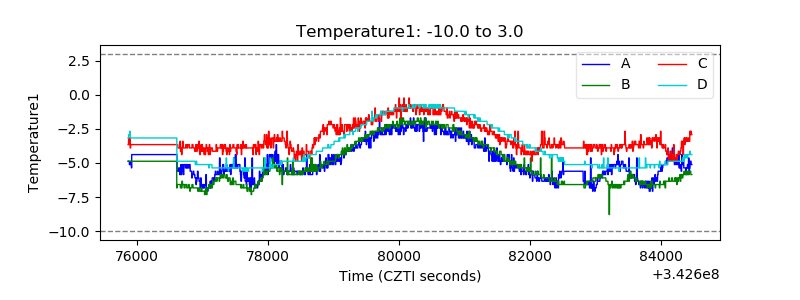 |
| Veto HV Monitor | 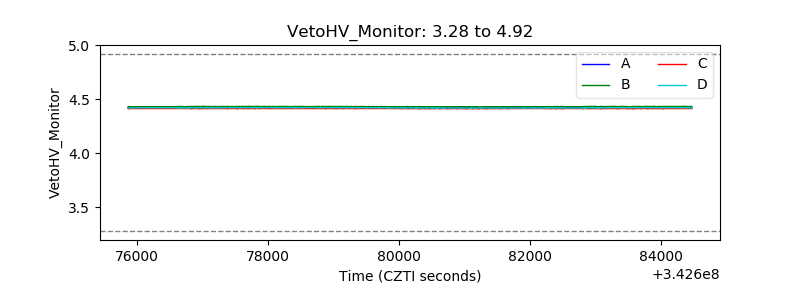 |
| Veto LLD | 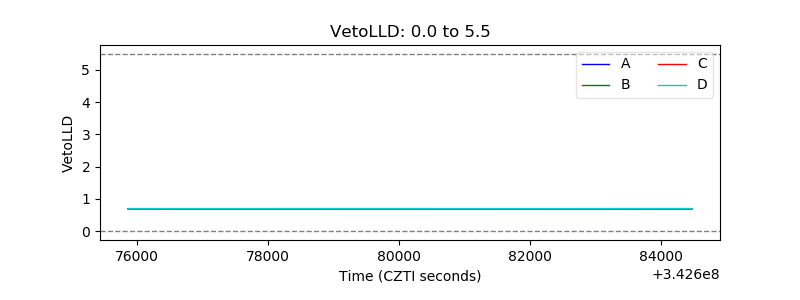 |
| Alpha Counter | 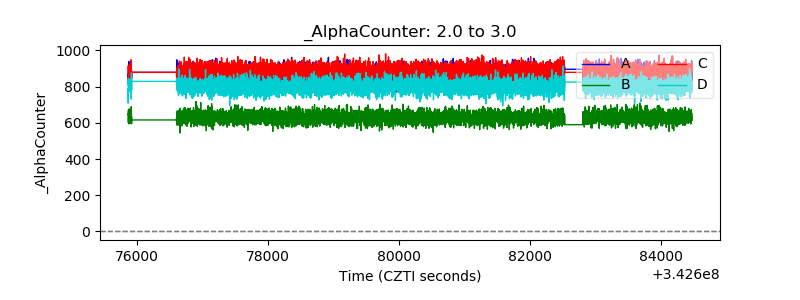 |
| _CPM_Rate | 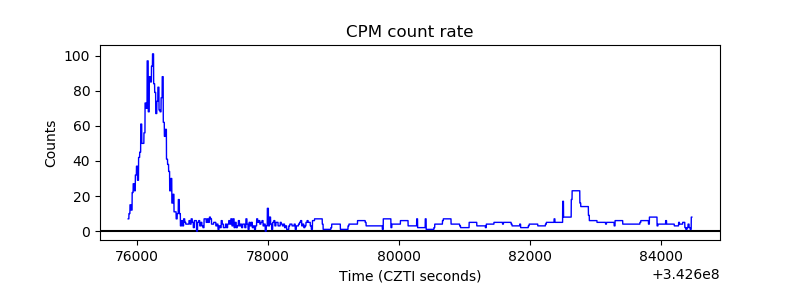 |
| CZT Counter | 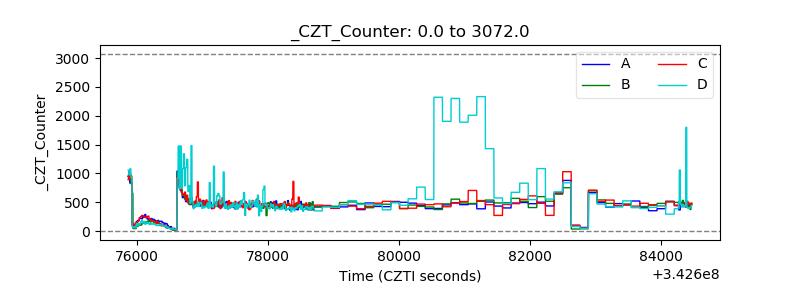 |
| +2.5 Volts monitor |  |
| +5 Volts monitor | 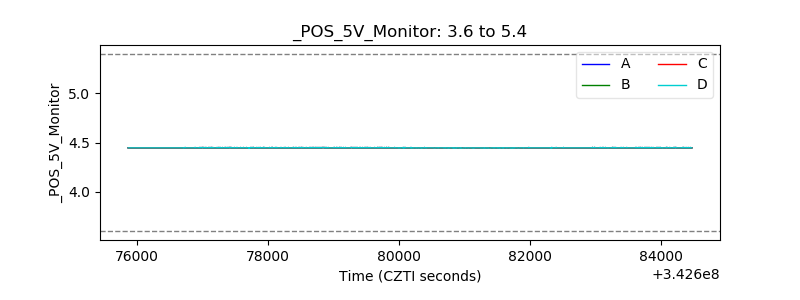 |
| _ROLL_ROT | 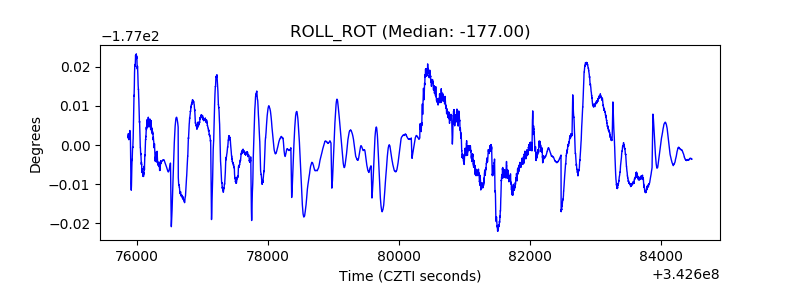 |
| _Roll_DEC | 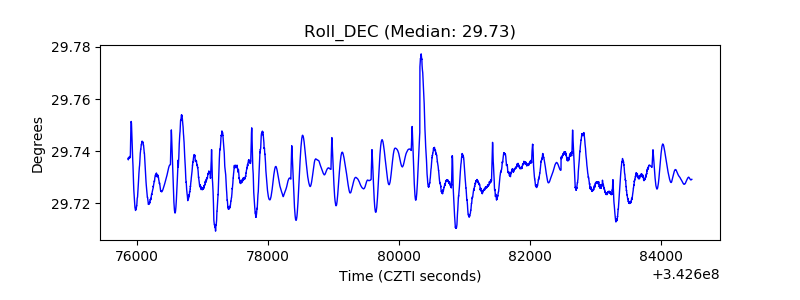 |
| _Roll_RA | 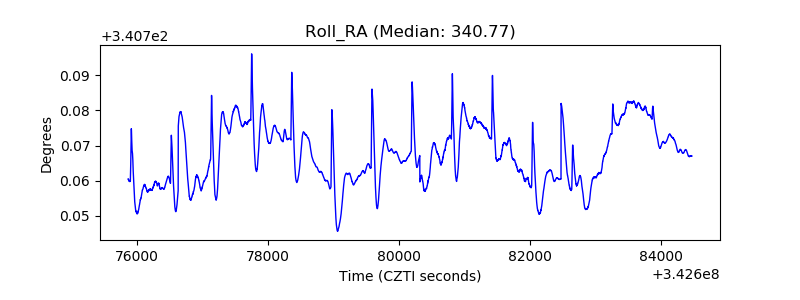 |
| Veto Counter | 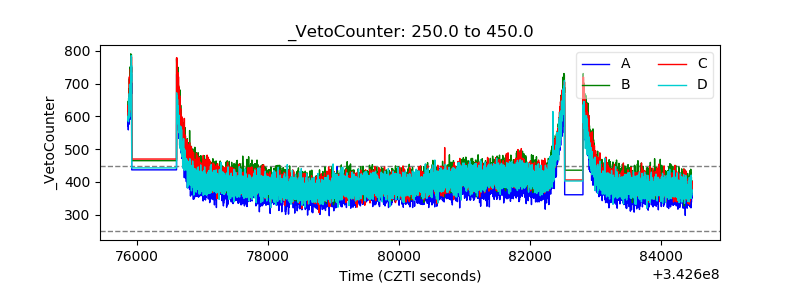 |