| Param | Original file | Final file |
|---|---|---|
| Filename | modeM0/AS1T03_257T01_9000003976_27681cztM0_level2.evt | modeM0/AS1T03_257T01_9000003976_27681cztM0_level2_quad_clean.evt |
| Size (bytes) | 599,342,400 | 77,947,200 |
| Size | 571.6 MB | 74.3 MB |
| Events in quadrant A | 3,686,683 | 475,530 |
| Events in quadrant B | 3,762,987 | 484,048 |
| Events in quadrant C | 3,906,030 | 460,727 |
| Events in quadrant D | 6,269,331 | 400,476 |
| Mode M9 | |||
|---|---|---|---|
| Quadrant | BADHDUFLAG | Total packets | Discarded packets |
| A | 0 | 2 | 0 |
| B | 0 | 2 | 0 |
| C | 0 | 2 | 0 |
| D | 0 | 2 | 0 |
| Mode M0 | |||
|---|---|---|---|
| Quadrant | BADHDUFLAG | Total packets | Discarded packets |
| A | 0 | 16024 | 0 |
| B | 0 | 16115 | 0 |
| C | 0 | 16412 | 0 |
| D | 0 | 23958 | 0 |
| Quadrant | Total seconds | Saturated seconds | Saturation percentage |
|---|---|---|---|
| A | 7752 | 175 | 2.257482% |
| B | 7753 | 234 | 3.018187% |
| C | 7753 | 230 | 2.966594% |
| D | 7753 | 1128 | 14.549207% |
Noise dominated data is calculated using 1-second bins in cleaned event files. If a bin has >2000 counts, and if more than 50% of those come from <1% of pixels, then it is considered to be noise-dominated and hence unusable.
| Quadrant | # 1 sec bins | Bins with >0 counts | Bins with >2000 counts | High rate bins dominated by noise | Noise dominated (total time) | Noise dominated (detector-on time) | Marked lightcurve |
|---|---|---|---|---|---|---|---|
| A | 7877 | 7752 | 0 | 0 | 0.00% | 0.00% |  |
| B | 7878 | 7753 | 0 | 0 | 0.00% | 0.00% |  |
| C | 7878 | 7753 | 15 | 15 | 0.19% | 0.19% |  |
| D | 7878 | 7753 | 849 | 849 | 10.78% | 10.95% | 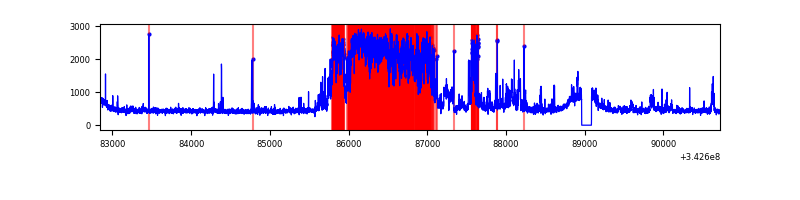 |
Top three noisy pixels from each quadrant. If the there are fewer than three noisy pixels in the level2.evt file, extra rows are filled as -1
| Pixel properties | Quadrant properties | ||||||
|---|---|---|---|---|---|---|---|
| Quadrant | DetID | PixID | Counts | Sigma | Mean | Median | Sigma |
| A | 15 | 174 | 15975 | 78.35 | 950 | 927 | 192.1 |
| A | 13 | 254 | 11681 | 55.99 | 950 | 927 | 192.1 |
| A | 3 | 137 | 9573 | 45.02 | 950 | 927 | 192.1 |
| B | 12 | 111 | 23458 | 122.34 | 947 | 919 | 184.2 |
| B | 0 | 230 | 22798 | 118.76 | 947 | 919 | 184.2 |
| B | 11 | 111 | 20758 | 107.69 | 947 | 919 | 184.2 |
| C | 3 | 233 | 176671 | 811.83 | 916 | 922 | 216.5 |
| C | 14 | 238 | 144195 | 661.82 | 916 | 922 | 216.5 |
| C | 15 | 208 | 6591 | 26.19 | 916 | 922 | 216.5 |
| D | 12 | 2 | 2199100 | 10237.24 | 886 | 862 | 214.7 |
| D | 1 | 52 | 609334 | 2833.67 | 886 | 862 | 214.7 |
| D | 2 | 250 | 77730 | 357.98 | 886 | 862 | 214.7 |
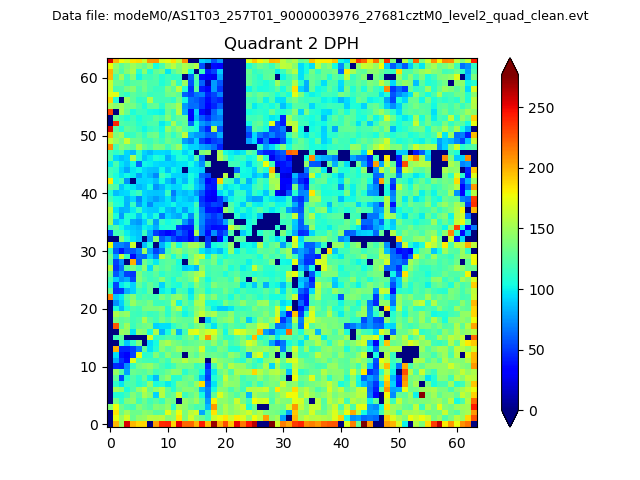
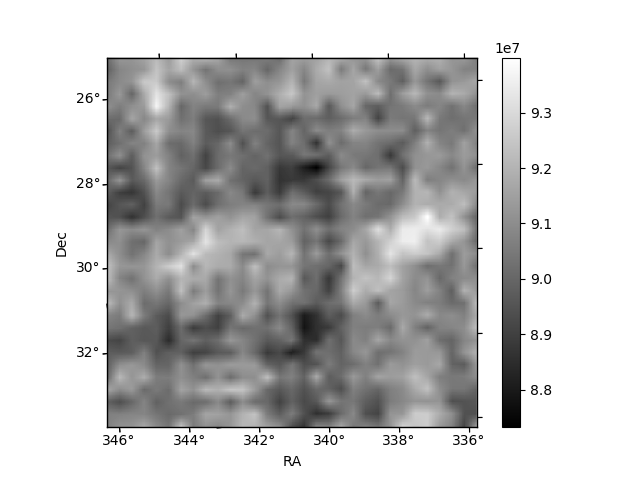
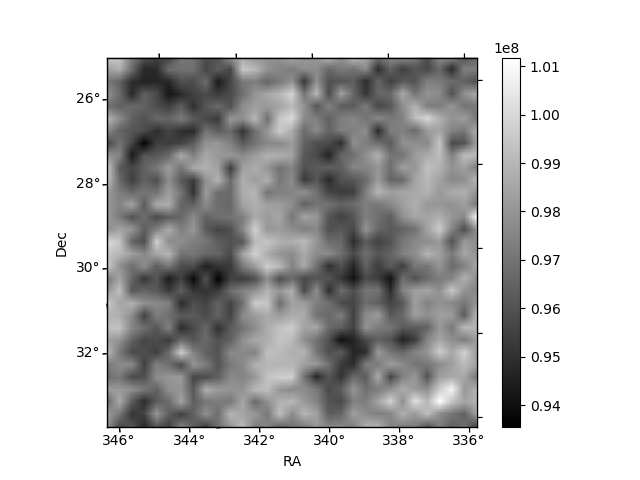
Histogram calculated using DETX and DETY for each event in the final _common_clean file
| Quadrant A | 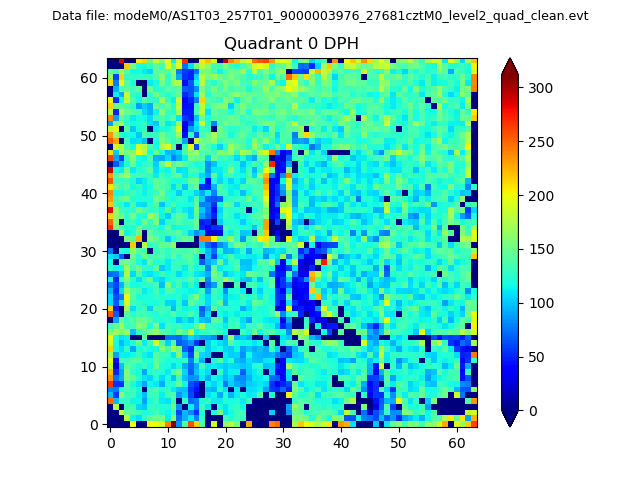 |
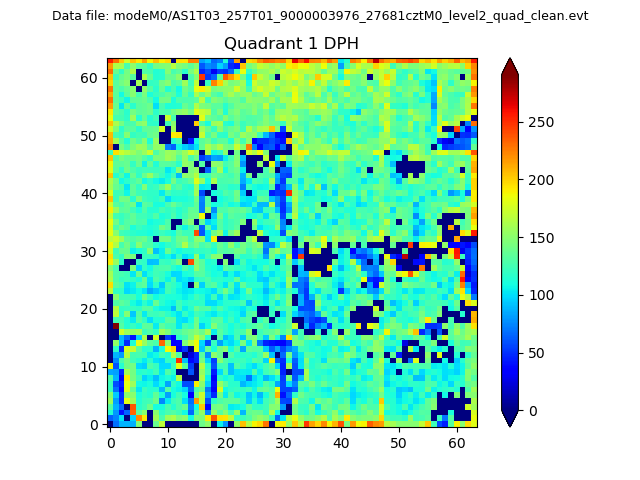 |
Quadrant B |
|---|---|---|---|
| Quadrant D | 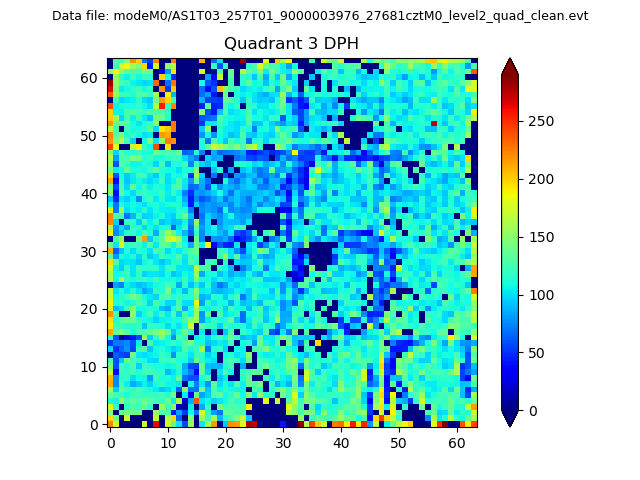 |
 |
Quadrant C |
| Plot type | Count rate plots | Images |
|---|---|---|
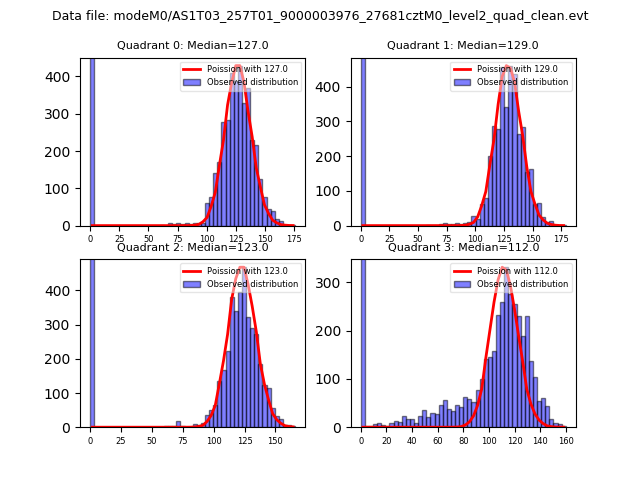
| Comparison with Poisson distribution Blue bars denote a histogram of data divided into 1 sec bins. Red curve is a Poisson curve with rate = median count rate of data. |
 |
 |
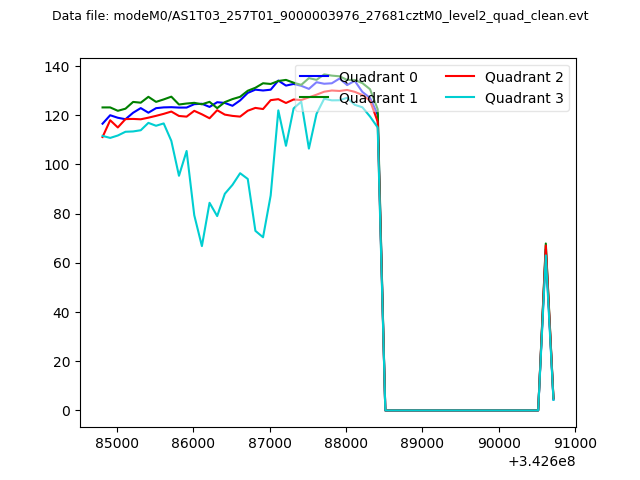
| Quadrant-wise count rates Data is divided into 100 sec bins |
 |
|
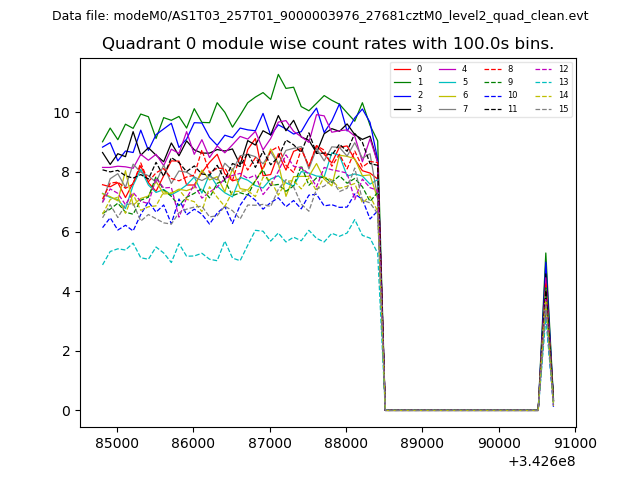
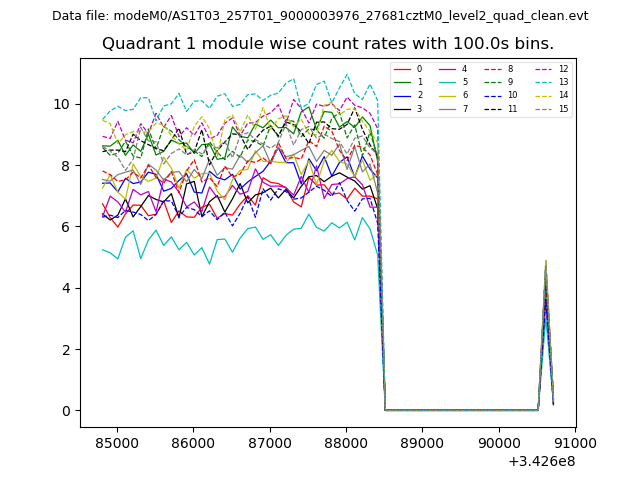
| Module-wise count rates for Quadrant A Data is divided into 100 sec bins |
 |
 |
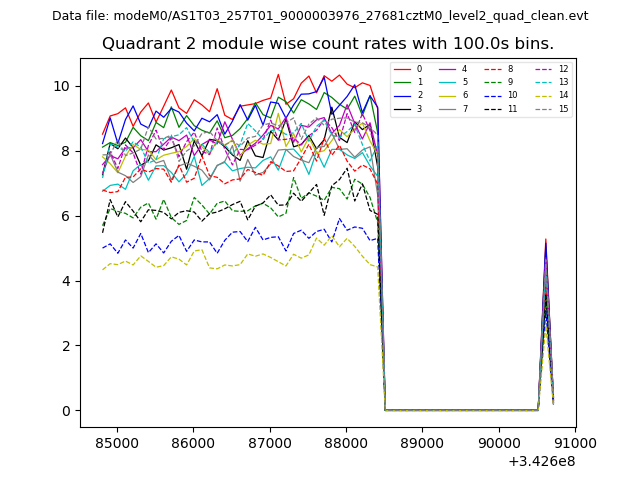
| Module-wise count rates for Quadrant B Data is divided into 100 sec bins |
 |
 |
| Module-wise count rates for Quadrant C Data is divided into 100 sec bins |
 |
 |
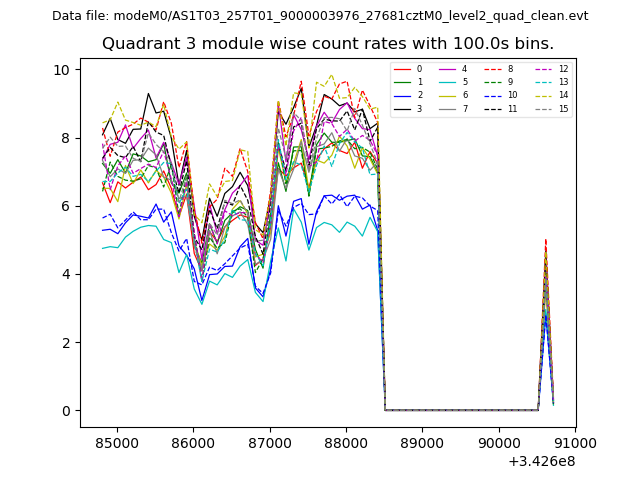
| Module-wise count rates for Quadrant D Data is divided into 100 sec bins |
 |
 |
| Parameter | Plot |
|---|---|
| CZT HV Monitor | 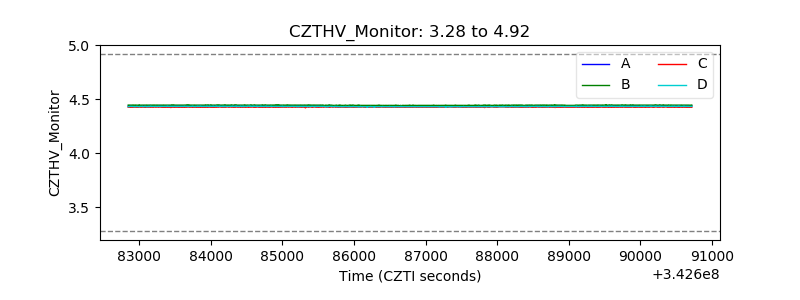 |
| D_VDD | 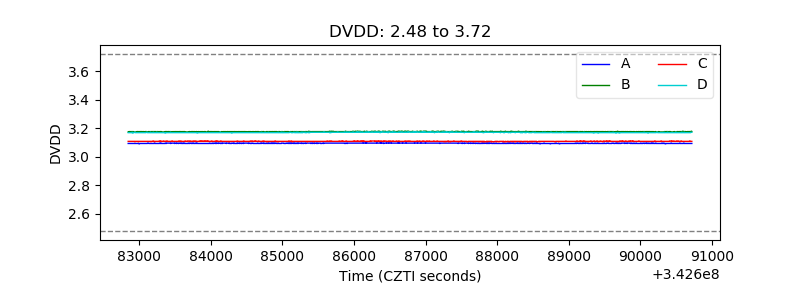 |
| Temperature 1 | 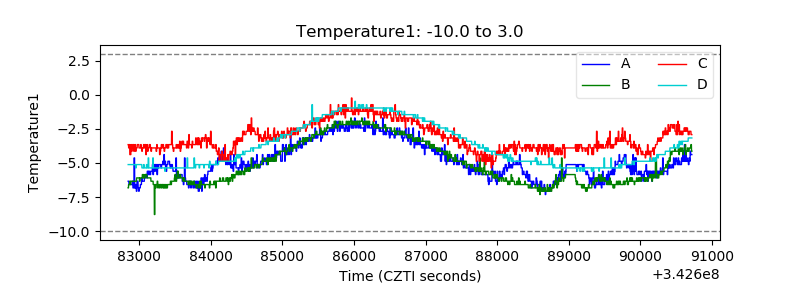 |
| Veto HV Monitor |  |
| Veto LLD | 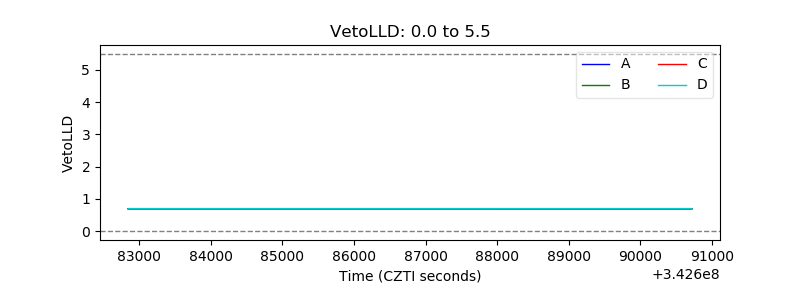 |
| Alpha Counter | 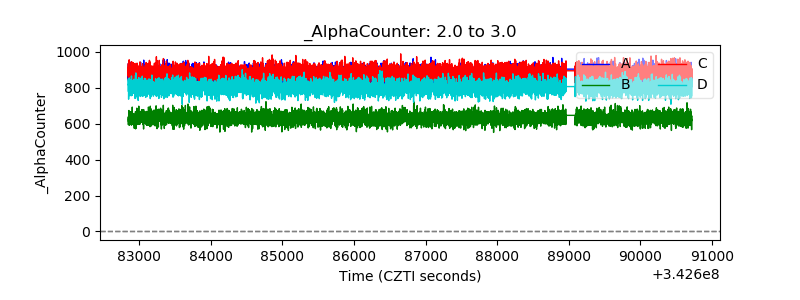 |
| _CPM_Rate |  |
| CZT Counter | 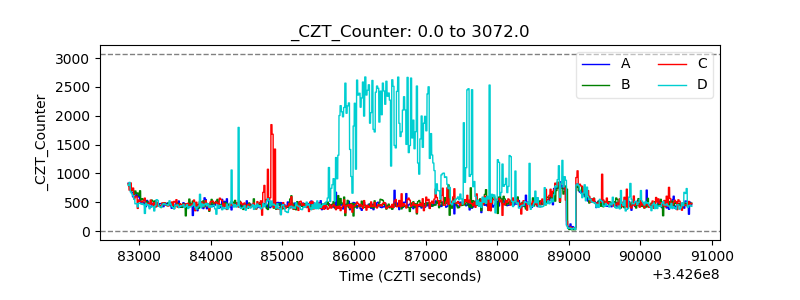 |
| +2.5 Volts monitor | 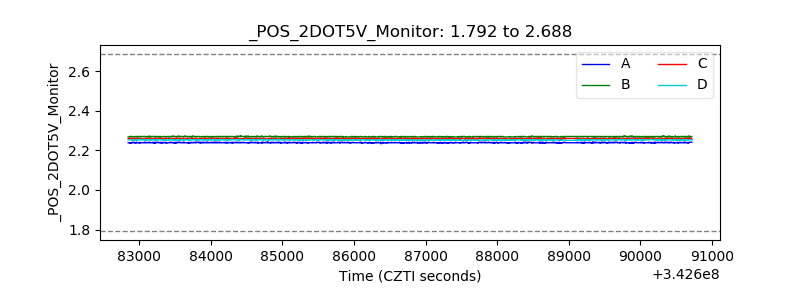 |
| +5 Volts monitor |  |
| _ROLL_ROT | 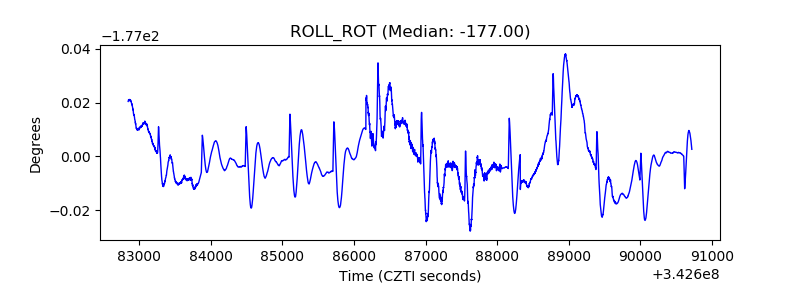 |
| _Roll_DEC | 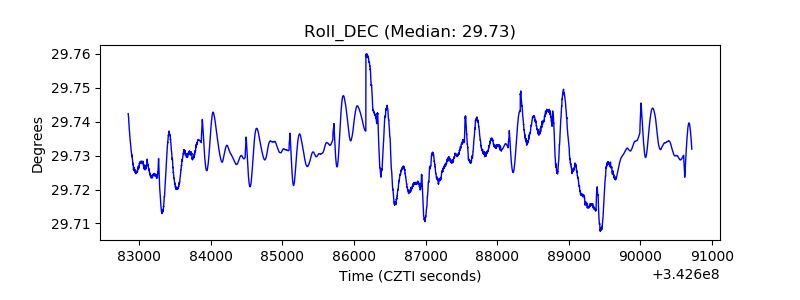 |
| _Roll_RA | 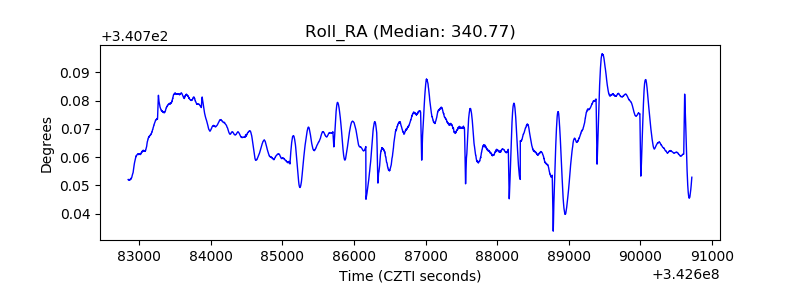 |
| Veto Counter | 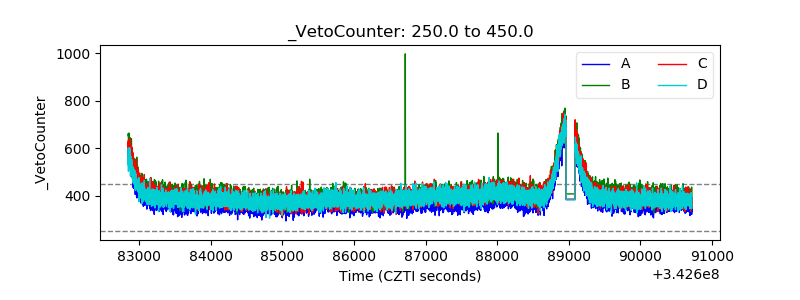 |