| Param | Original file | Final file |
|---|---|---|
| Filename | modeM0/AS1T03_257T01_9000003976_27684cztM0_level2.evt | modeM0/AS1T03_257T01_9000003976_27684cztM0_level2_quad_clean.evt |
| Size (bytes) | 278,559,360 | 34,502,400 |
| Size | 265.7 MB | 32.9 MB |
| Events in quadrant A | 1,817,227 | 201,318 |
| Events in quadrant B | 1,904,052 | 206,719 |
| Events in quadrant C | 1,870,825 | 198,654 |
| Events in quadrant D | 2,592,261 | 177,146 |
| Mode M9 | |||
|---|---|---|---|
| Quadrant | BADHDUFLAG | Total packets | Discarded packets |
| A | 0 | 2 | 0 |
| B | 0 | 2 | 0 |
| C | 0 | 2 | 0 |
| D | 0 | 2 | 0 |
| Mode M0 | |||
|---|---|---|---|
| Quadrant | BADHDUFLAG | Total packets | Discarded packets |
| A | 0 | 7787 | 0 |
| B | 0 | 7999 | 0 |
| C | 0 | 7836 | 0 |
| D | 0 | 10175 | 0 |
| Quadrant | Total seconds | Saturated seconds | Saturation percentage |
|---|---|---|---|
| A | 3684 | 172 | 4.668838% |
| B | 3684 | 214 | 5.808903% |
| C | 3684 | 190 | 5.157438% |
| D | 3684 | 348 | 9.446254% |
Noise dominated data is calculated using 1-second bins in cleaned event files. If a bin has >2000 counts, and if more than 50% of those come from <1% of pixels, then it is considered to be noise-dominated and hence unusable.
| Quadrant | # 1 sec bins | Bins with >0 counts | Bins with >2000 counts | High rate bins dominated by noise | Noise dominated (total time) | Noise dominated (detector-on time) | Marked lightcurve |
|---|---|---|---|---|---|---|---|
| A | 3809 | 3684 | 1 | 1 | 0.03% | 0.03% | 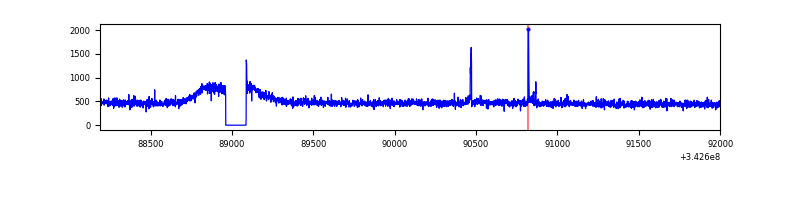 |
| B | 3809 | 3684 | 6 | 6 | 0.16% | 0.16% | 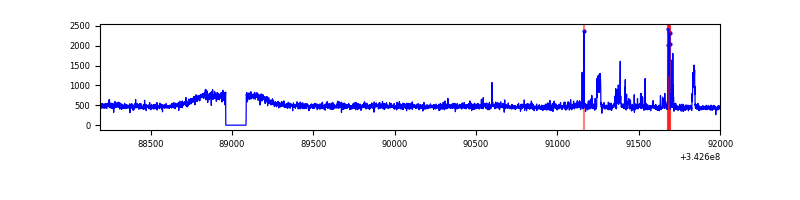 |
| C | 3809 | 3684 | 0 | 0 | 0.00% | 0.00% | 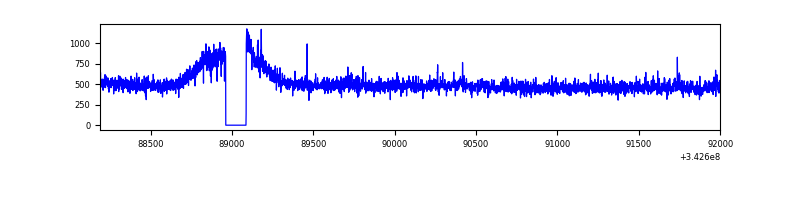 |
| D | 3808 | 3683 | 202 | 202 | 5.30% | 5.48% | 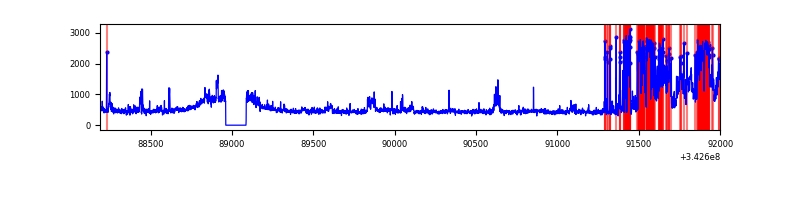 |
Top three noisy pixels from each quadrant. If the there are fewer than three noisy pixels in the level2.evt file, extra rows are filled as -1
| Pixel properties | Quadrant properties | ||||||
|---|---|---|---|---|---|---|---|
| Quadrant | DetID | PixID | Counts | Sigma | Mean | Median | Sigma |
| A | 15 | 174 | 29524 | 304.24 | 462 | 450 | 95.6 |
| A | 13 | 254 | 5758 | 55.54 | 462 | 450 | 95.6 |
| A | 3 | 137 | 4794 | 45.46 | 462 | 450 | 95.6 |
| B | 0 | 230 | 44600 | 481.12 | 458 | 444 | 91.8 |
| B | 15 | 32 | 23836 | 254.88 | 458 | 444 | 91.8 |
| B | 0 | 190 | 18642 | 198.28 | 458 | 444 | 91.8 |
| C | 14 | 238 | 69236 | 647.64 | 444 | 443 | 106.2 |
| C | 3 | 233 | 68723 | 642.81 | 444 | 443 | 106.2 |
| C | 13 | 61 | 3047 | 24.51 | 444 | 443 | 106.2 |
| D | 1 | 52 | 686576 | 6392.59 | 436 | 422 | 107.3 |
| D | 12 | 2 | 223632 | 2079.55 | 436 | 422 | 107.3 |
| D | 2 | 250 | 22216 | 203.04 | 436 | 422 | 107.3 |
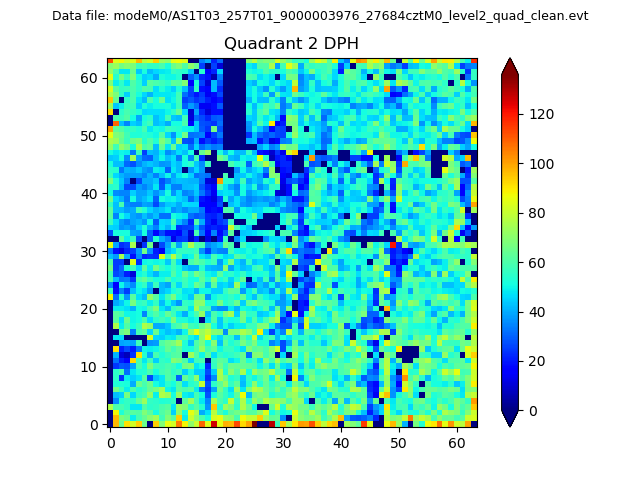
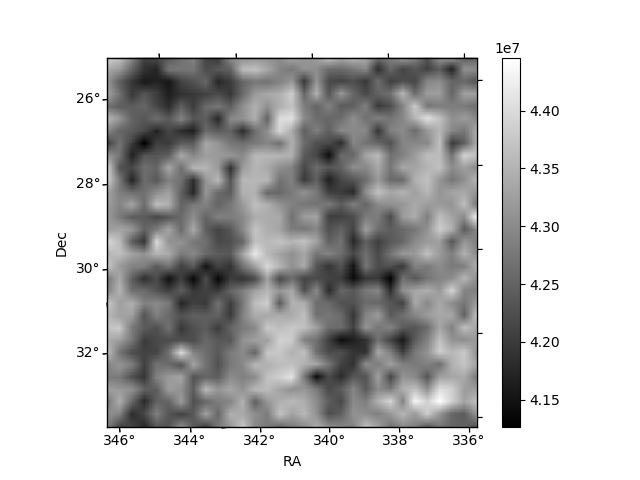
Histogram calculated using DETX and DETY for each event in the final _common_clean file
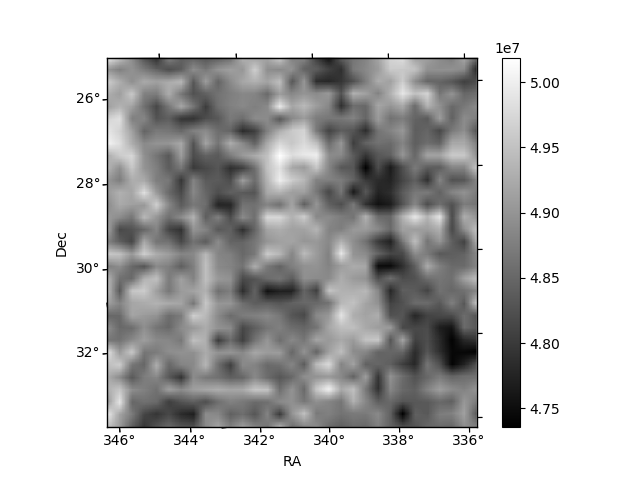
| Quadrant A | 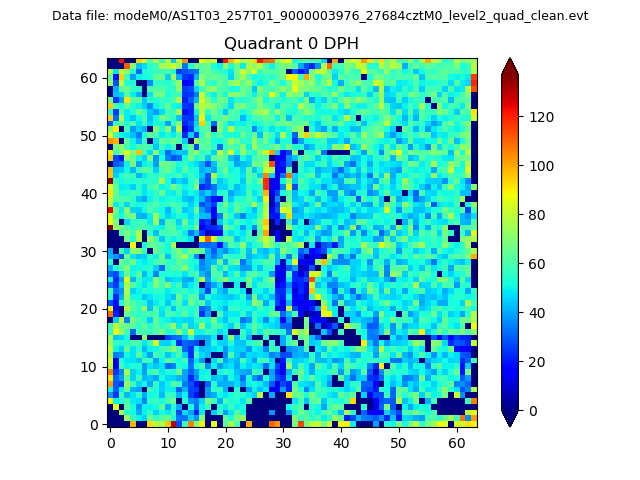 |
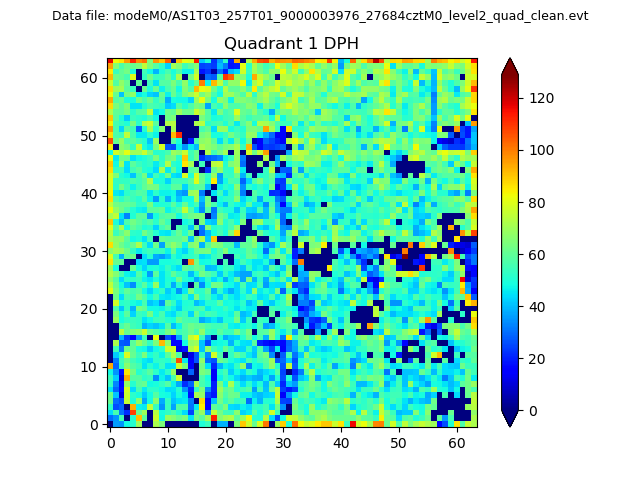 |
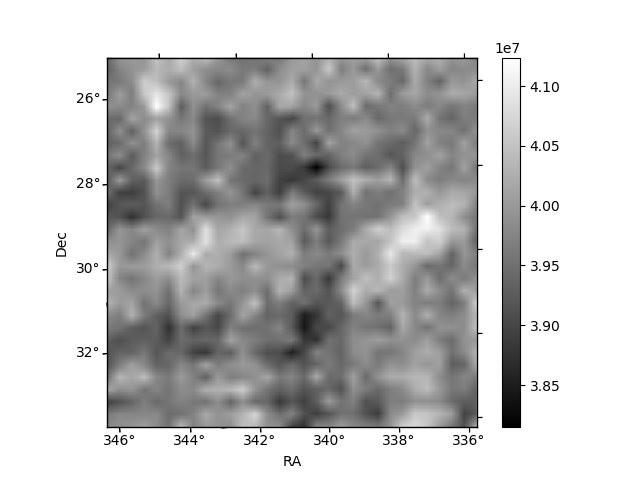
Quadrant B |
|---|---|---|---|
| Quadrant D | 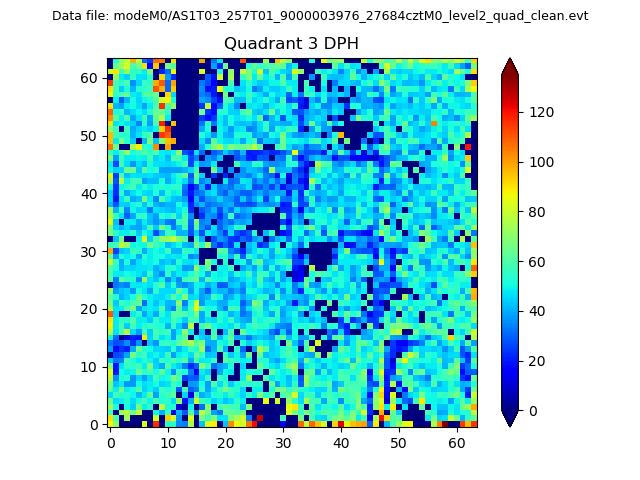 |
 |
Quadrant C |
| Plot type | Count rate plots | Images |
|---|---|---|
| Comparison with Poisson distribution Blue bars denote a histogram of data divided into 1 sec bins. Red curve is a Poisson curve with rate = median count rate of data. |
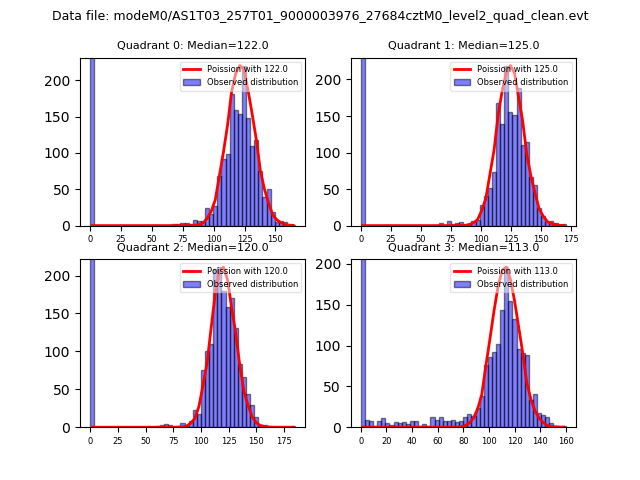 |
 |
| Quadrant-wise count rates Data is divided into 100 sec bins |
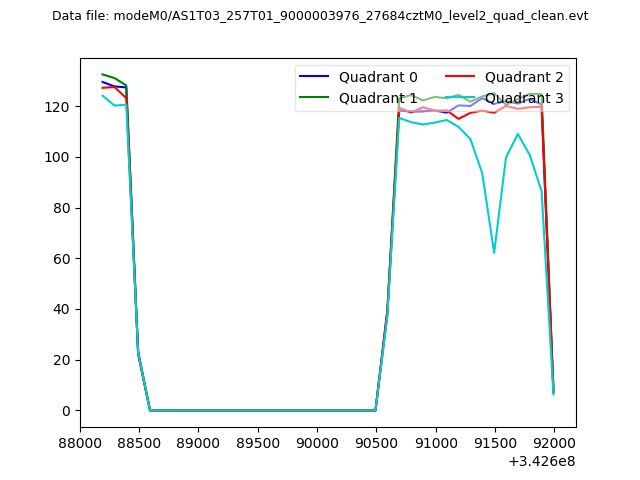 |
|
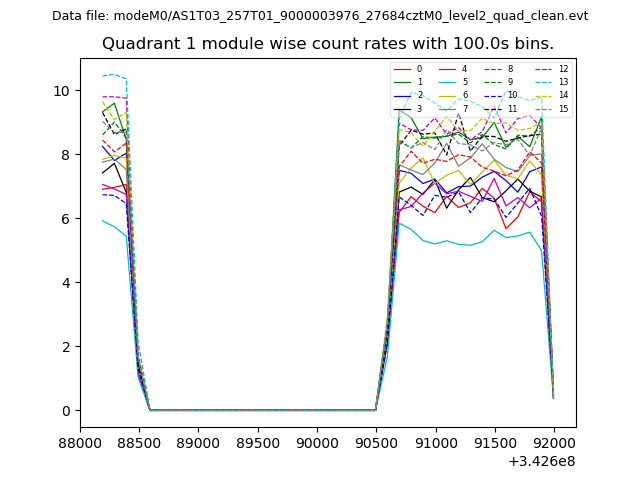
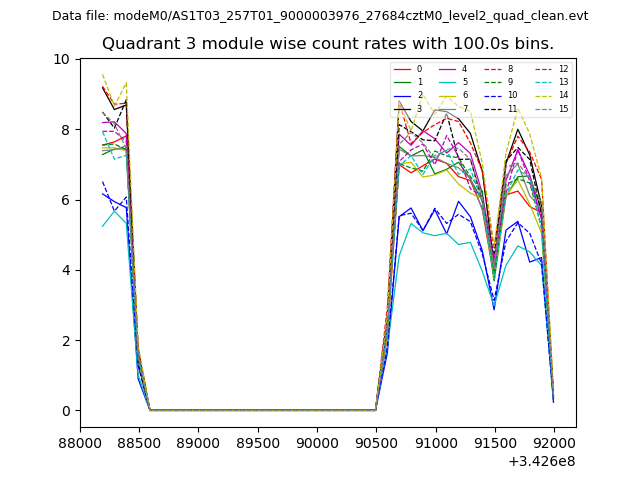
| Module-wise count rates for Quadrant A Data is divided into 100 sec bins |
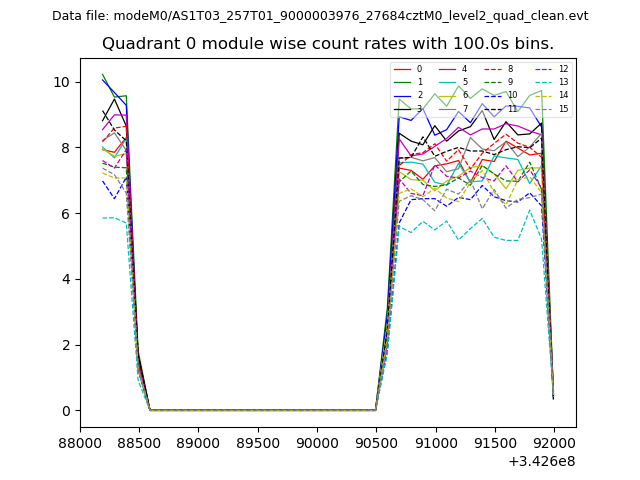 |
 |
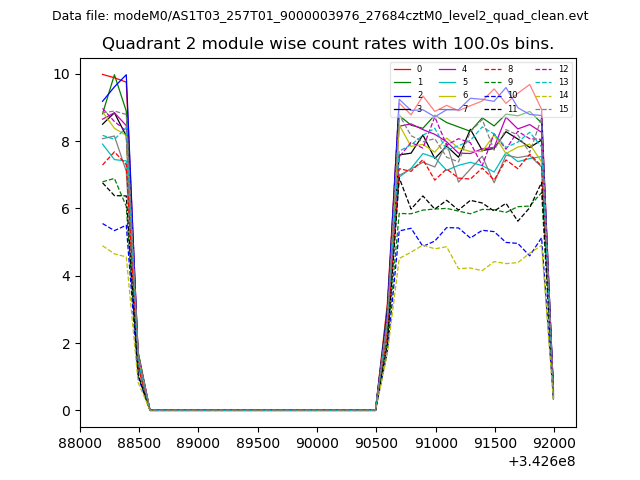
| Module-wise count rates for Quadrant B Data is divided into 100 sec bins |
 |
 |
| Module-wise count rates for Quadrant C Data is divided into 100 sec bins |
 |
 |
| Module-wise count rates for Quadrant D Data is divided into 100 sec bins |
 |
 |
| Parameter | Plot |
|---|---|
| CZT HV Monitor | 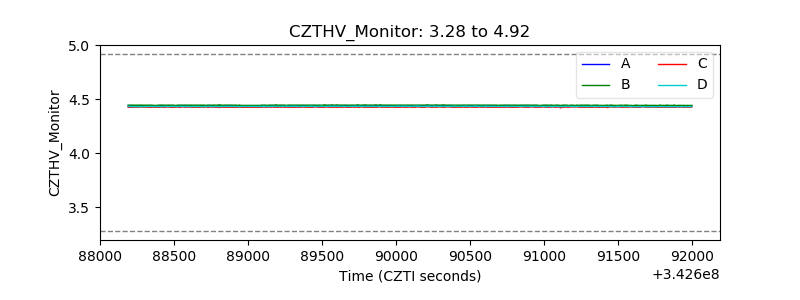 |
| D_VDD | 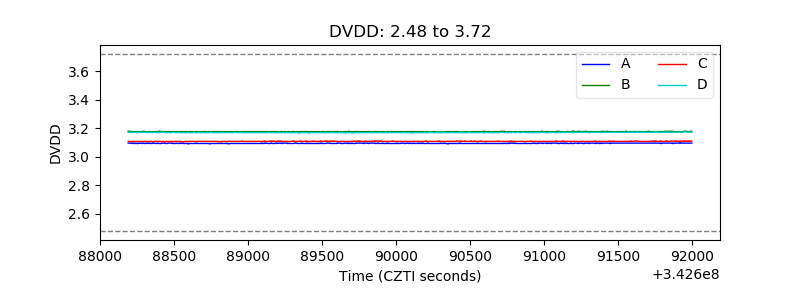 |
| Temperature 1 | 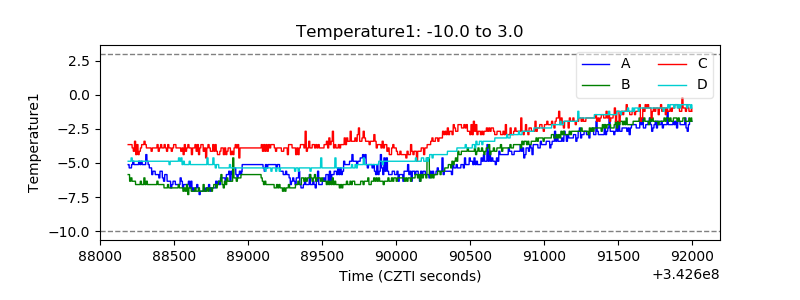 |
| Veto HV Monitor | 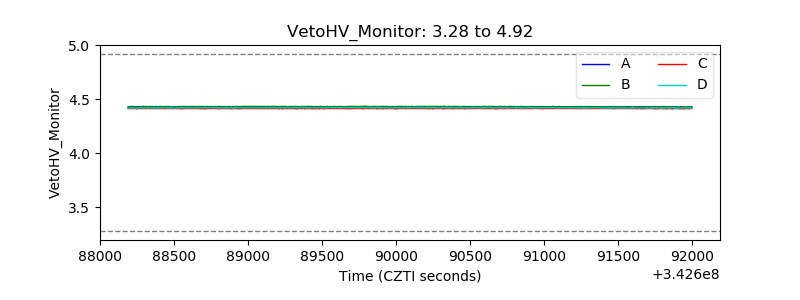 |
| Veto LLD | 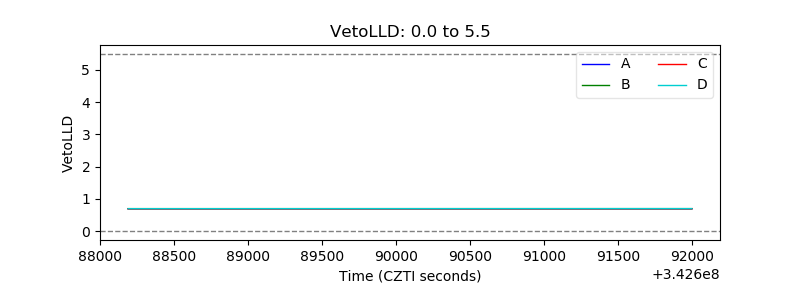 |
| Alpha Counter | 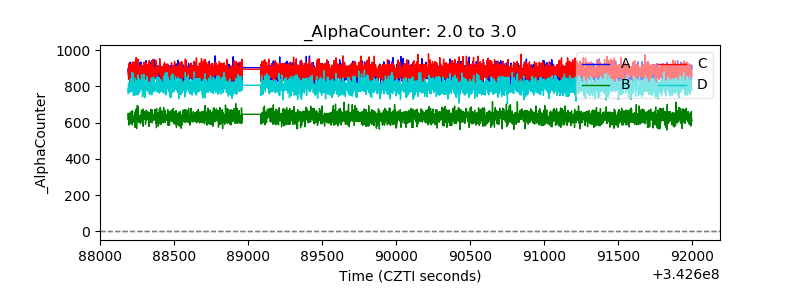 |
| _CPM_Rate | 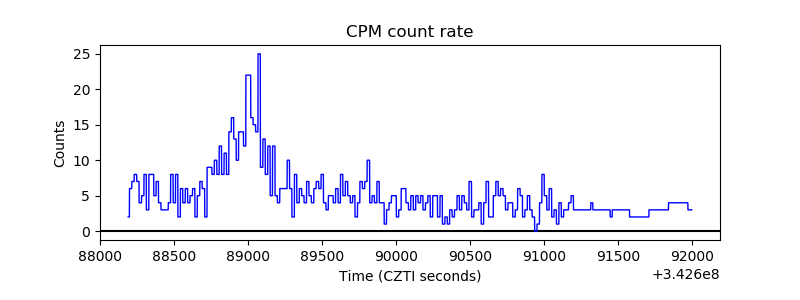 |
| CZT Counter | 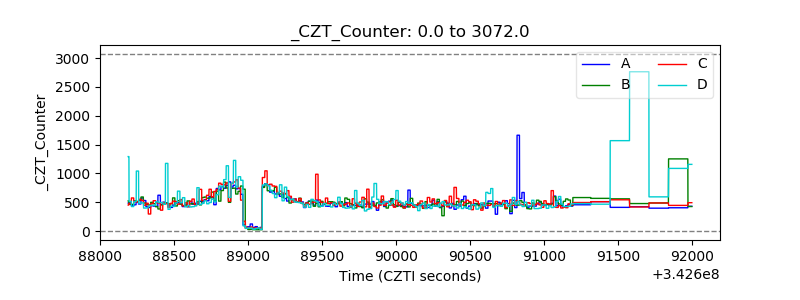 |
| +2.5 Volts monitor |  |
| +5 Volts monitor |  |
| _ROLL_ROT |  |
| _Roll_DEC | 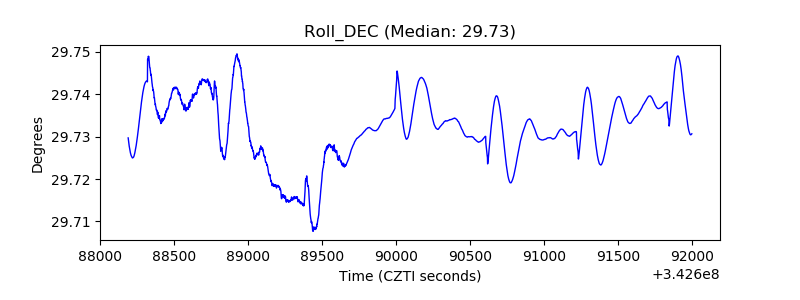 |
| _Roll_RA |  |
| Veto Counter | 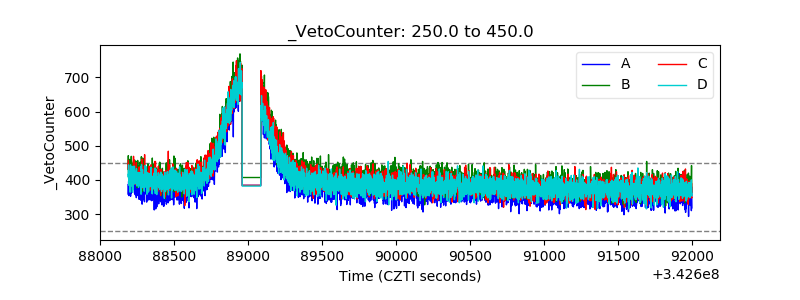 |