| Param | Original file | Final file |
|---|---|---|
| Filename | modeM0/AS1T03_257T01_9000003976_27685cztM0_level2.evt | modeM0/AS1T03_257T01_9000003976_27685cztM0_level2_quad_clean.evt |
| Size (bytes) | 206,150,400 | 34,692,480 |
| Size | 196.6 MB | 33.1 MB |
| Events in quadrant A | 845,863 | 240,016 |
| Events in quadrant B | 927,060 | 242,771 |
| Events in quadrant C | 1,005,106 | 230,942 |
| Events in quadrant D | 3,331,579 | 195,053 |
| Mode M0 | |||
|---|---|---|---|
| Quadrant | BADHDUFLAG | Total packets | Discarded packets |
| A | 0 | 3880 | 0 |
| B | 0 | 4086 | 0 |
| C | 0 | 4209 | 0 |
| D | 0 | 11246 | 0 |
| Quadrant | Total seconds | Saturated seconds | Saturation percentage |
|---|---|---|---|
| A | 1939 | 1 | 0.051573% |
| B | 1940 | 10 | 0.515464% |
| C | 1940 | 9 | 0.463918% |
| D | 1940 | 549 | 28.298969% |
Noise dominated data is calculated using 1-second bins in cleaned event files. If a bin has >2000 counts, and if more than 50% of those come from <1% of pixels, then it is considered to be noise-dominated and hence unusable.
| Quadrant | # 1 sec bins | Bins with >0 counts | Bins with >2000 counts | High rate bins dominated by noise | Noise dominated (total time) | Noise dominated (detector-on time) | Marked lightcurve |
|---|---|---|---|---|---|---|---|
| A | 1939 | 1939 | 0 | 0 | 0.00% | 0.00% | 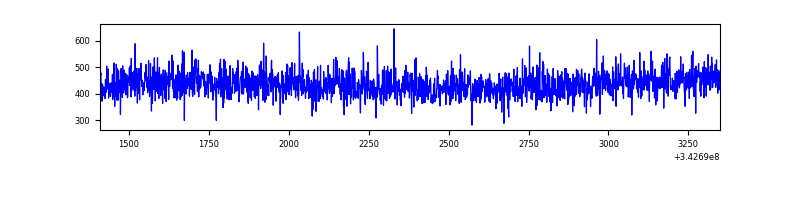 |
| B | 1940 | 1940 | 5 | 5 | 0.26% | 0.26% | 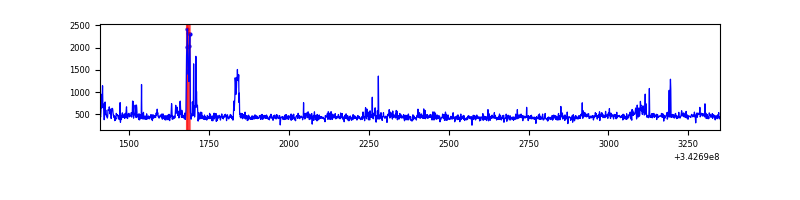 |
| C | 1940 | 1940 | 4 | 4 | 0.21% | 0.21% | 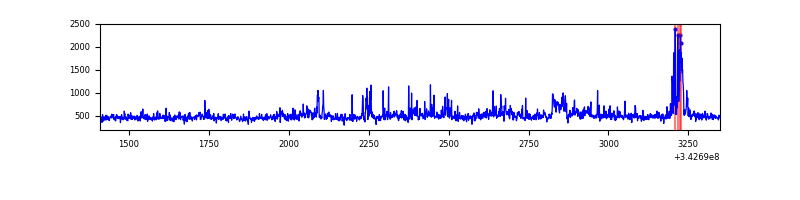 |
| D | 1940 | 1940 | 637 | 637 | 32.84% | 32.84% | 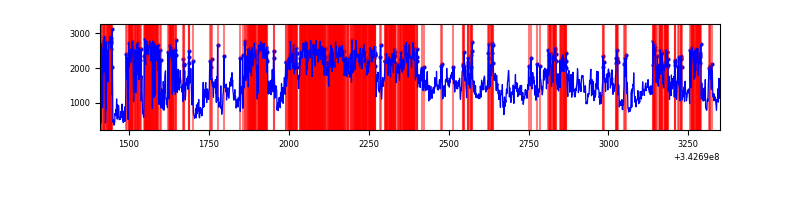 |
Top three noisy pixels from each quadrant. If the there are fewer than three noisy pixels in the level2.evt file, extra rows are filled as -1
| Pixel properties | Quadrant properties | ||||||
|---|---|---|---|---|---|---|---|
| Quadrant | DetID | PixID | Counts | Sigma | Mean | Median | Sigma |
| A | 13 | 254 | 3467 | 70.49 | 219 | 214 | 46.2 |
| A | 3 | 137 | 2051 | 39.8 | 219 | 214 | 46.2 |
| A | 0 | 226 | 1852 | 35.49 | 219 | 214 | 46.2 |
| B | 15 | 32 | 31821 | 730.12 | 216 | 210 | 43.3 |
| B | 0 | 230 | 28009 | 642.07 | 216 | 210 | 43.3 |
| B | 0 | 190 | 11042 | 250.19 | 216 | 210 | 43.3 |
| C | 3 | 233 | 136958 | 2709.26 | 207 | 207 | 50.5 |
| C | 14 | 238 | 33276 | 655.15 | 207 | 207 | 50.5 |
| C | 8 | 208 | 23870 | 468.8 | 207 | 207 | 50.5 |
| D | 12 | 2 | 1711438 | 36396.97 | 193 | 186 | 47.0 |
| D | 1 | 52 | 835719 | 17771.12 | 193 | 186 | 47.0 |
| D | 2 | 250 | 25221 | 532.47 | 193 | 186 | 47.0 |
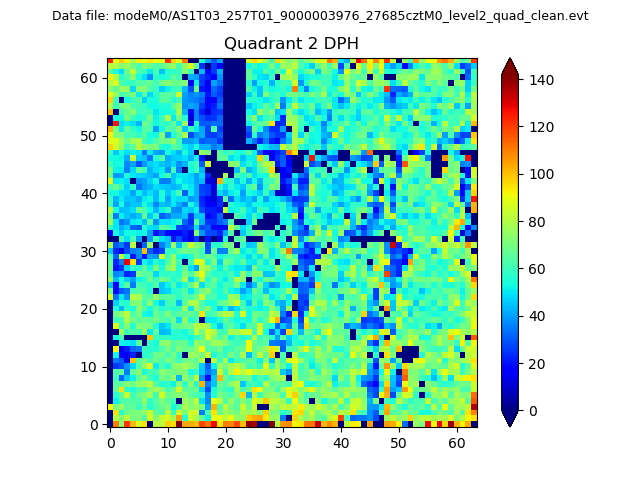
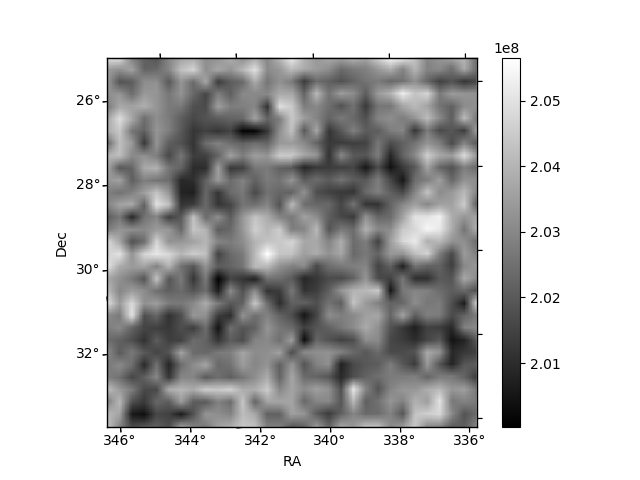
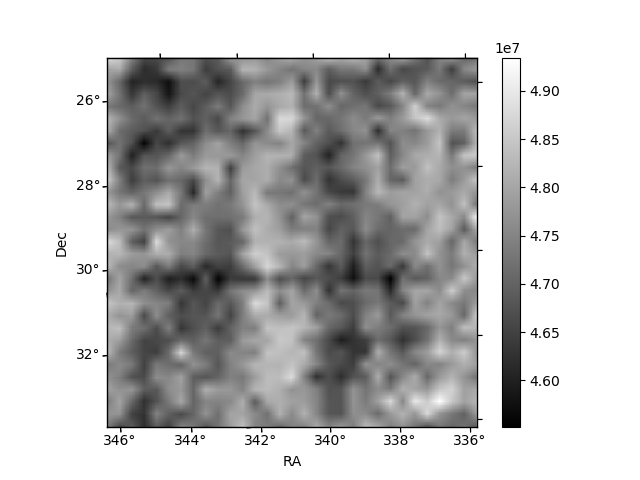
Histogram calculated using DETX and DETY for each event in the final _common_clean file
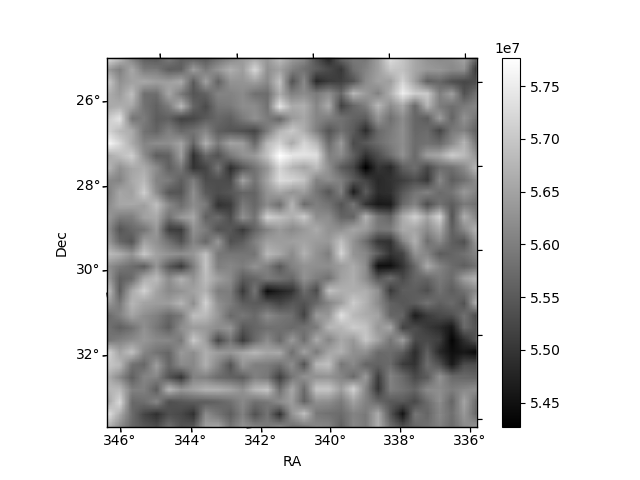
| Quadrant A | 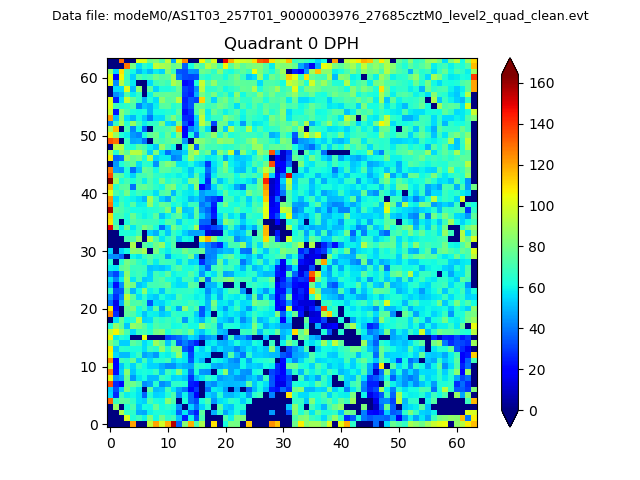 |
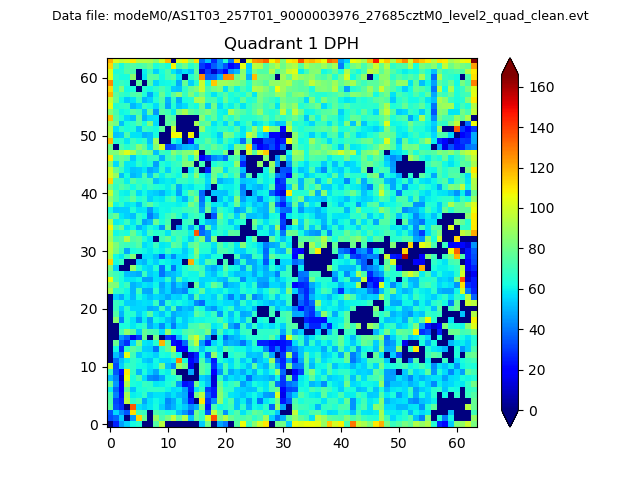 |
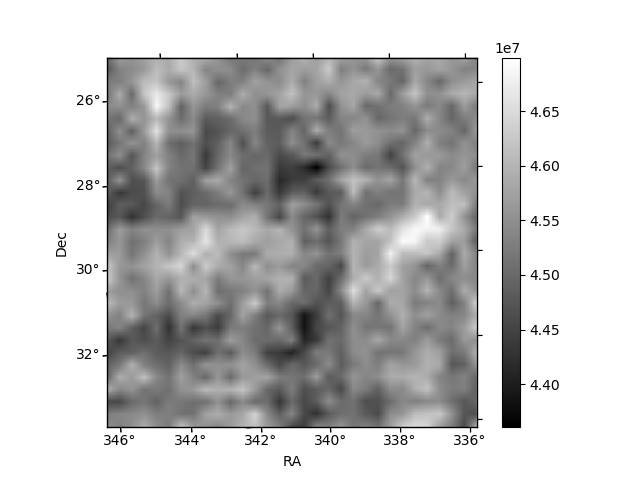
Quadrant B |
|---|---|---|---|
| Quadrant D | 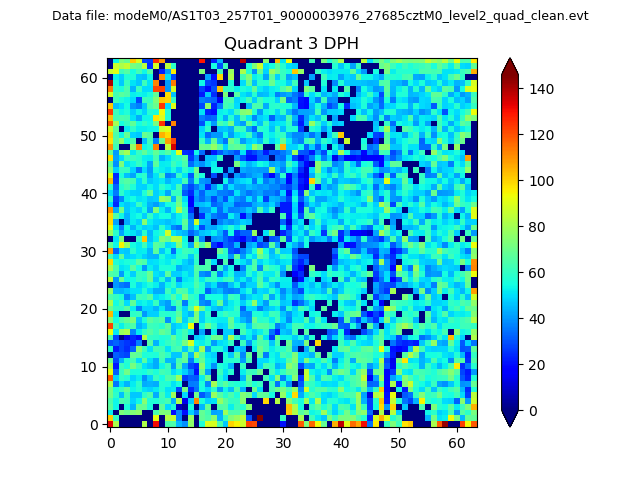 |
 |
Quadrant C |
| Plot type | Count rate plots | Images |
|---|---|---|
| Comparison with Poisson distribution Blue bars denote a histogram of data divided into 1 sec bins. Red curve is a Poisson curve with rate = median count rate of data. |
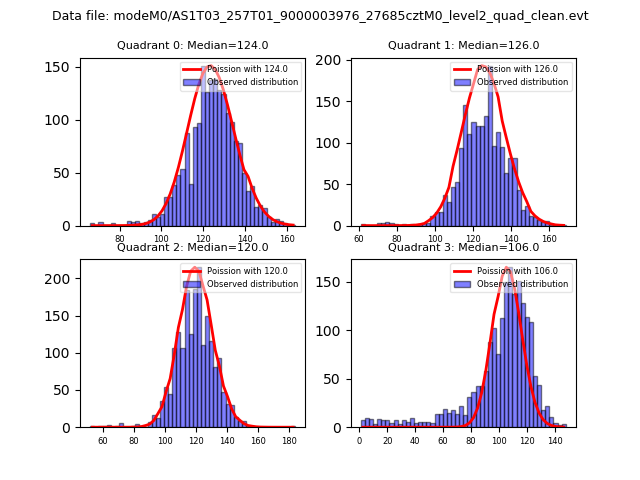 |
 |
| Quadrant-wise count rates Data is divided into 100 sec bins |
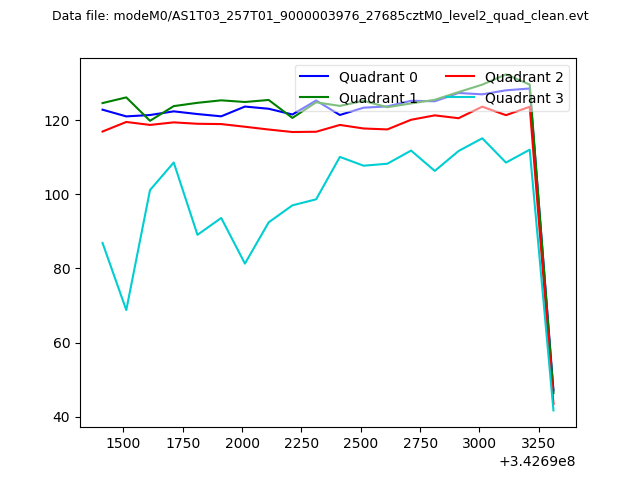 |
|
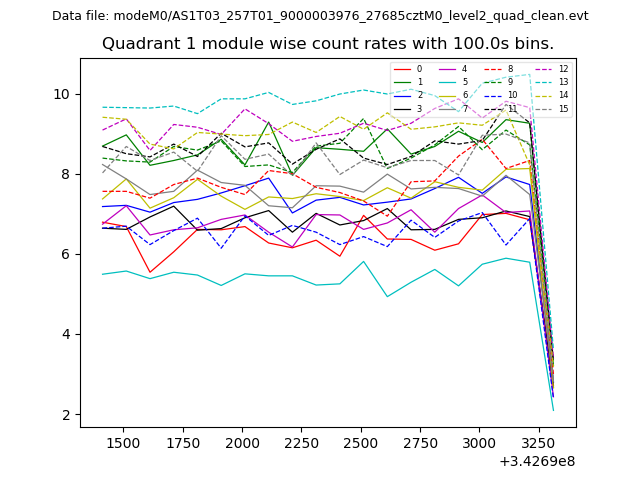
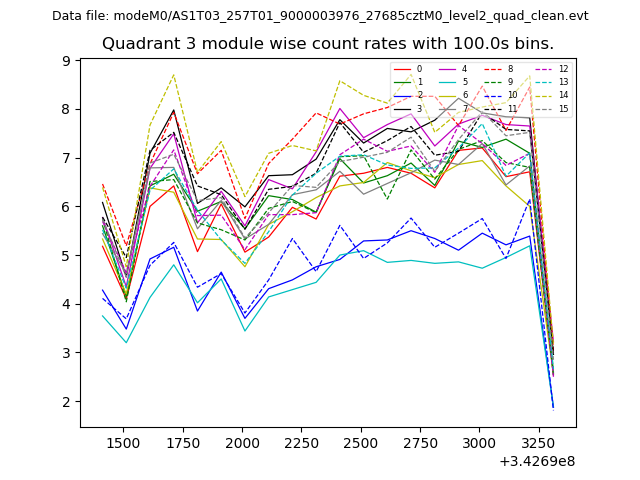
| Module-wise count rates for Quadrant A Data is divided into 100 sec bins |
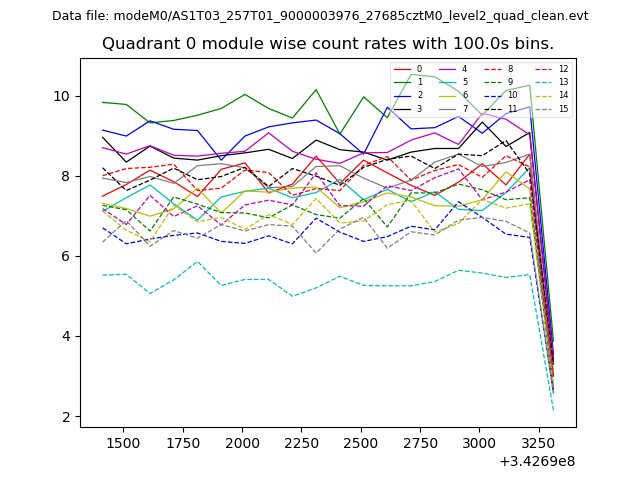 |
 |
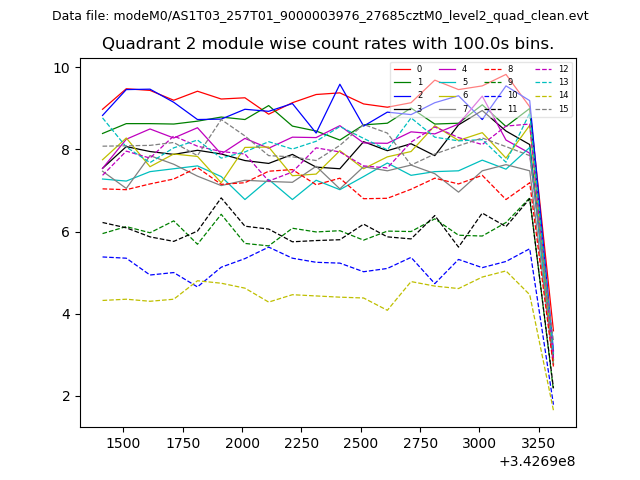
| Module-wise count rates for Quadrant B Data is divided into 100 sec bins |
 |
 |
| Module-wise count rates for Quadrant C Data is divided into 100 sec bins |
 |
 |
| Module-wise count rates for Quadrant D Data is divided into 100 sec bins |
 |
 |
| Parameter | Plot |
|---|---|
| CZT HV Monitor | 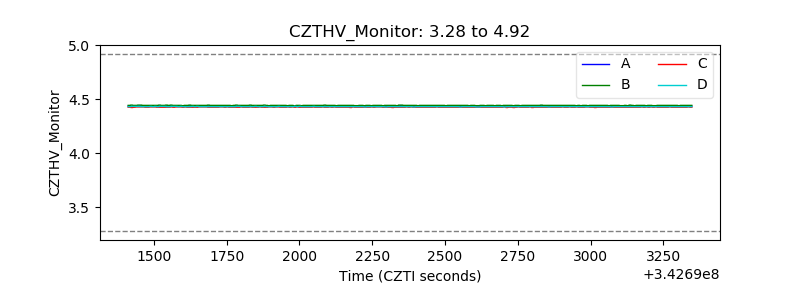 |
| D_VDD | 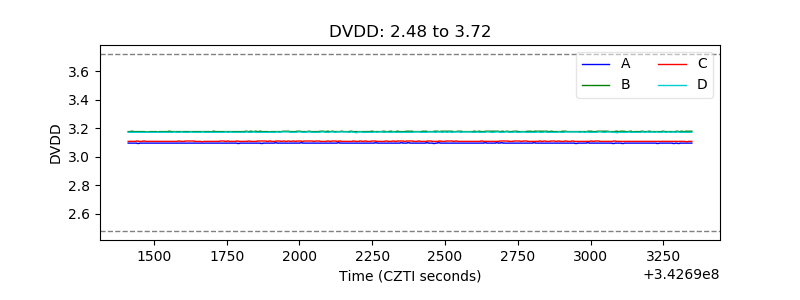 |
| Temperature 1 | 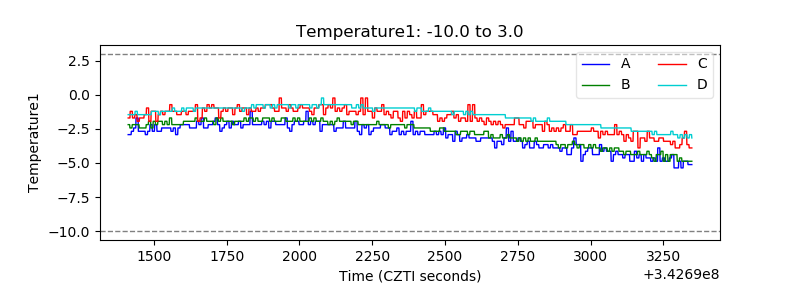 |
| Veto HV Monitor | 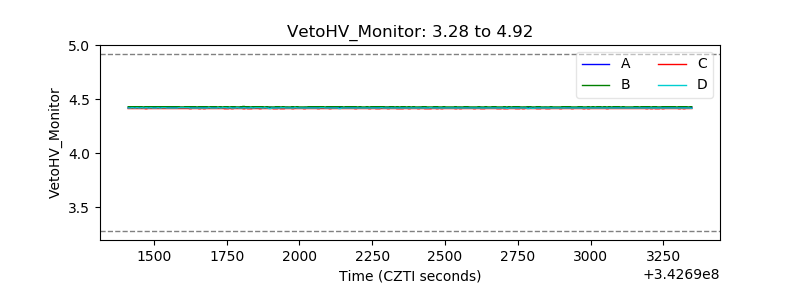 |
| Veto LLD | 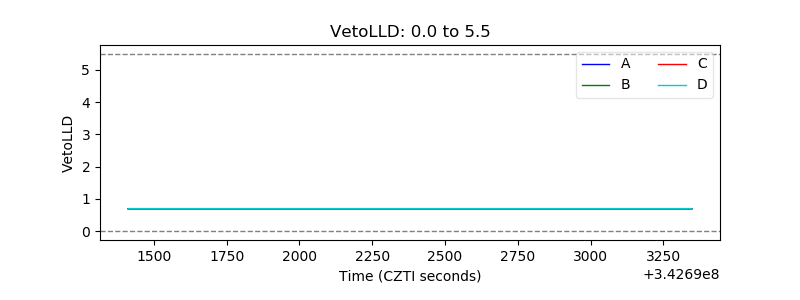 |
| Alpha Counter | 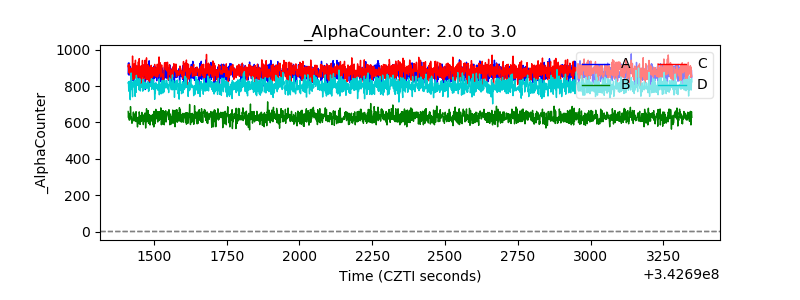 |
| _CPM_Rate | 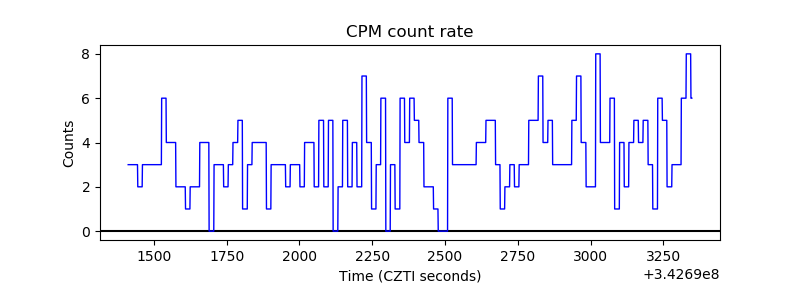 |
| CZT Counter | 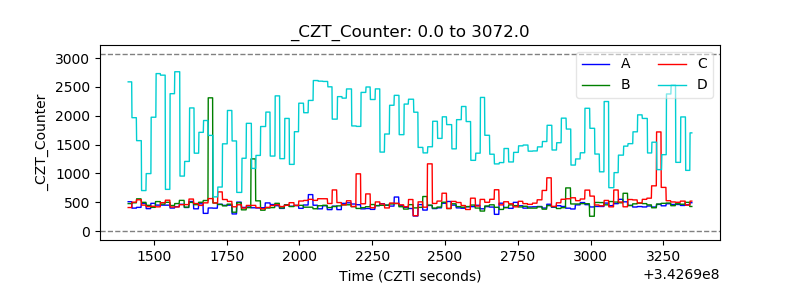 |
| +2.5 Volts monitor |  |
| +5 Volts monitor |  |
| _ROLL_ROT | 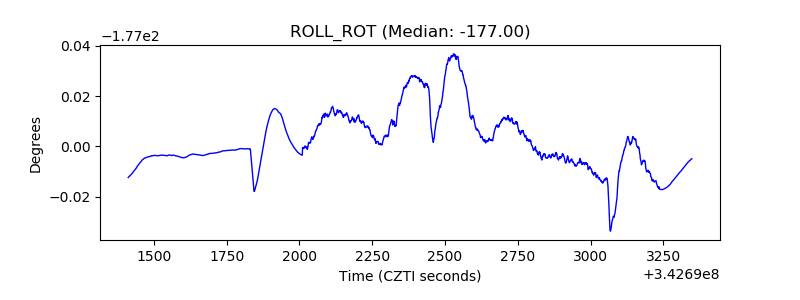 |
| _Roll_DEC | 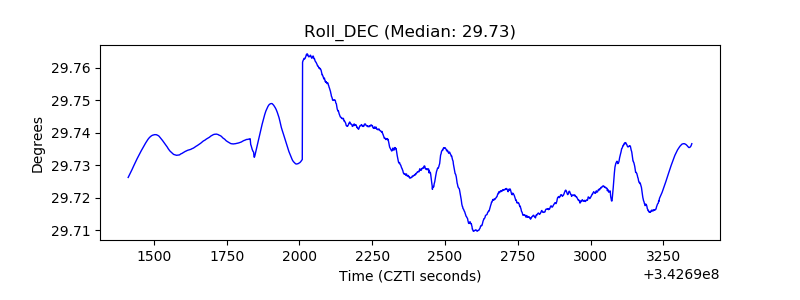 |
| _Roll_RA | 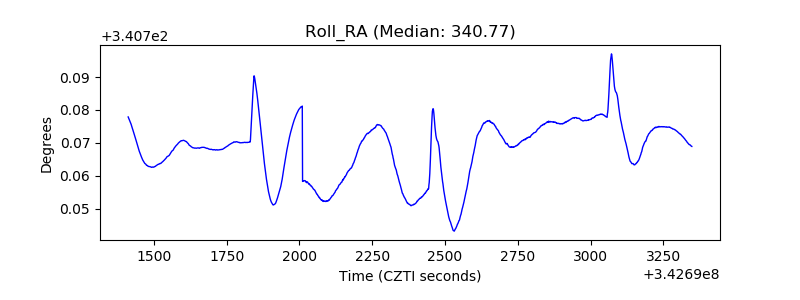 |
| Veto Counter |  |