| Param | Original file | Final file |
|---|---|---|
| Filename | modeM0/AS1T03_257T01_9000003976_27603cztM0_level2.evt | modeM0/AS1T03_257T01_9000003976_27603cztM0_level2_quad_clean.evt |
| Size (bytes) | 96,575,040 | 26,038,080 |
| Size | 92.1 MB | 24.8 MB |
| Events in quadrant A | 668,266 | 177,252 |
| Events in quadrant B | 712,519 | 187,998 |
| Events in quadrant C | 689,415 | 171,380 |
| Events in quadrant D | 771,383 | 162,025 |
| Mode M9 | |||
|---|---|---|---|
| Quadrant | BADHDUFLAG | Total packets | Discarded packets |
| A | 0 | 12 | 0 |
| B | 0 | 12 | 0 |
| C | 0 | 12 | 0 |
| D | 0 | 12 | 0 |
| Mode M0 | |||
|---|---|---|---|
| Quadrant | BADHDUFLAG | Total packets | Discarded packets |
| A | 0 | 2692 | 0 |
| B | 0 | 2911 | 0 |
| C | 0 | 2786 | 0 |
| D | 0 | 3135 | 0 |
| Quadrant | Total seconds | Saturated seconds | Saturation percentage |
|---|---|---|---|
| A | 1179 | 6 | 0.508906% |
| B | 1179 | 2 | 0.169635% |
| C | 1179 | 11 | 0.932994% |
| D | 1178 | 9 | 0.764007% |
Noise dominated data is calculated using 1-second bins in cleaned event files. If a bin has >2000 counts, and if more than 50% of those come from <1% of pixels, then it is considered to be noise-dominated and hence unusable.
| Quadrant | # 1 sec bins | Bins with >0 counts | Bins with >2000 counts | High rate bins dominated by noise | Noise dominated (total time) | Noise dominated (detector-on time) | Marked lightcurve |
|---|---|---|---|---|---|---|---|
| A | 1179 | 1179 | 2 | 2 | 0.17% | 0.17% | 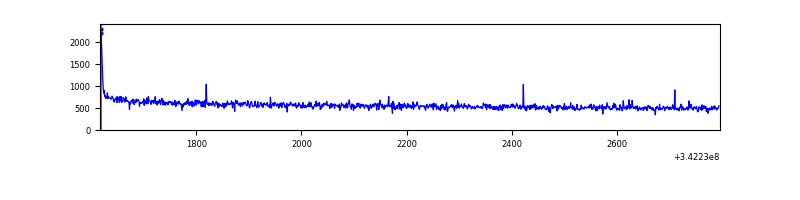 |
| B | 1179 | 1179 | 0 | 0 | 0.00% | 0.00% | 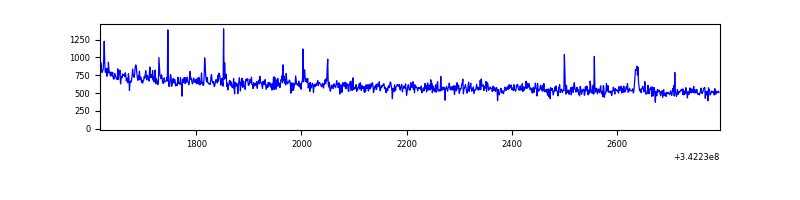 |
| C | 1179 | 1179 | 0 | 0 | 0.00% | 0.00% | 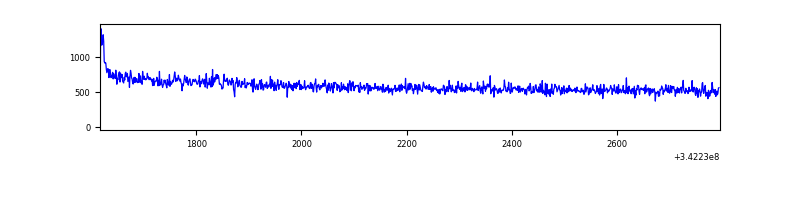 |
| D | 1178 | 1178 | 9 | 9 | 0.76% | 0.76% | 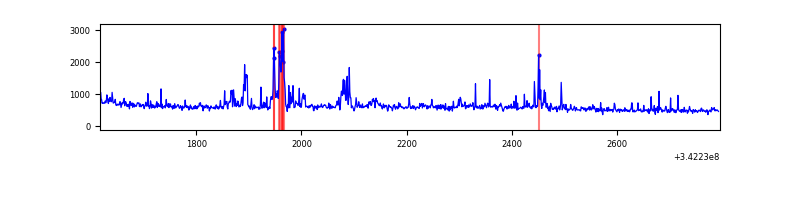 |
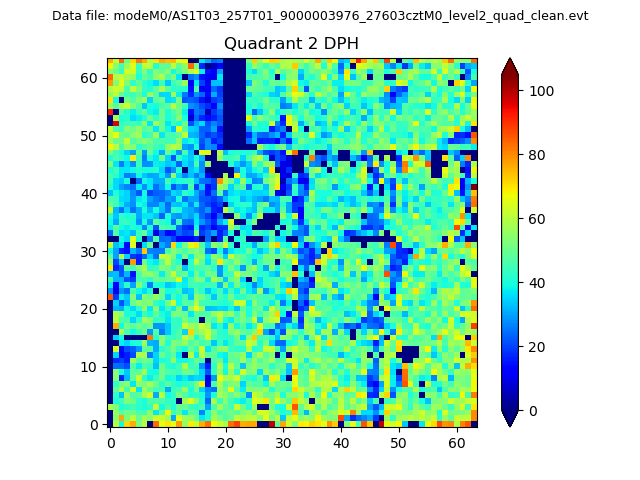
Top three noisy pixels from each quadrant. If the there are fewer than three noisy pixels in the level2.evt file, extra rows are filled as -1
| Pixel properties | Quadrant properties | ||||||
|---|---|---|---|---|---|---|---|
| Quadrant | DetID | PixID | Counts | Sigma | Mean | Median | Sigma |
| A | 8 | 192 | 6748 | 186.22 | 170 | 168 | 35.3 |
| A | 13 | 254 | 2291 | 60.08 | 170 | 168 | 35.3 |
| A | 6 | 16 | 1501 | 37.72 | 170 | 168 | 35.3 |
| B | 0 | 230 | 14630 | 425.74 | 175 | 173 | 34.0 |
| B | 4 | 200 | 3770 | 105.93 | 175 | 173 | 34.0 |
| B | 12 | 111 | 3536 | 99.04 | 175 | 173 | 34.0 |
| C | 14 | 238 | 27316 | 661.39 | 167 | 168 | 41.0 |
| C | 9 | 15 | 5835 | 138.06 | 167 | 168 | 41.0 |
| C | 0 | 10 | 4434 | 103.93 | 167 | 168 | 41.0 |
| D | 1 | 52 | 107667 | 2664.79 | 162 | 158 | 40.3 |
| D | 2 | 250 | 32250 | 795.45 | 162 | 158 | 40.3 |
| D | 12 | 233 | 7087 | 171.75 | 162 | 158 | 40.3 |
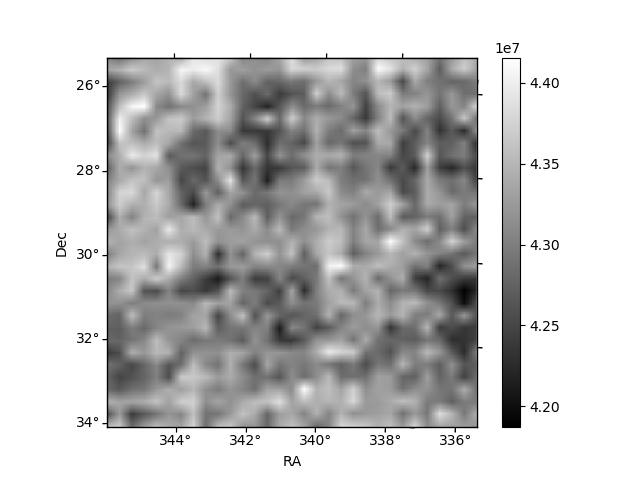
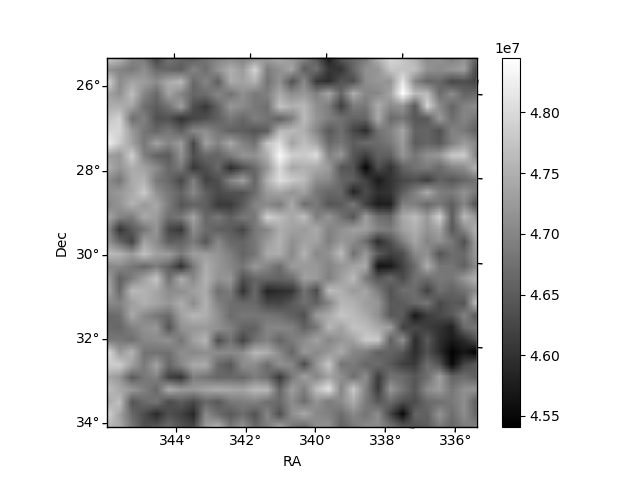
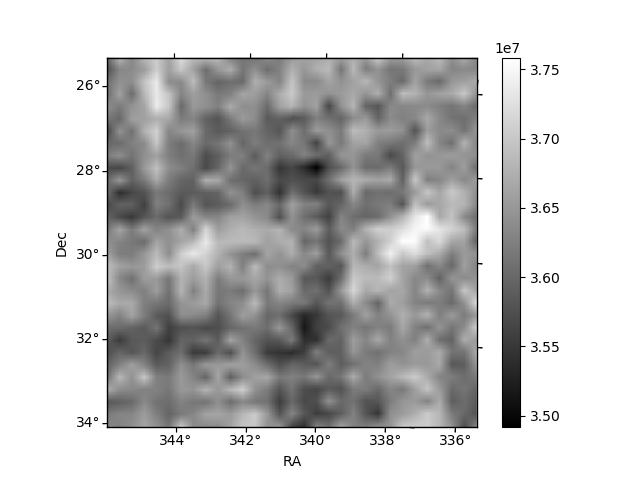
Histogram calculated using DETX and DETY for each event in the final _common_clean file
| Quadrant A | 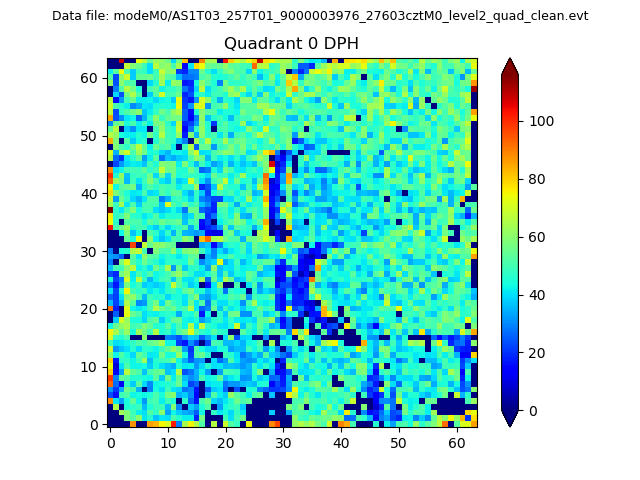 |
 |
Quadrant B |
|---|---|---|---|
| Quadrant D |  |
 |
Quadrant C |
| Plot type | Count rate plots | Images |
|---|---|---|
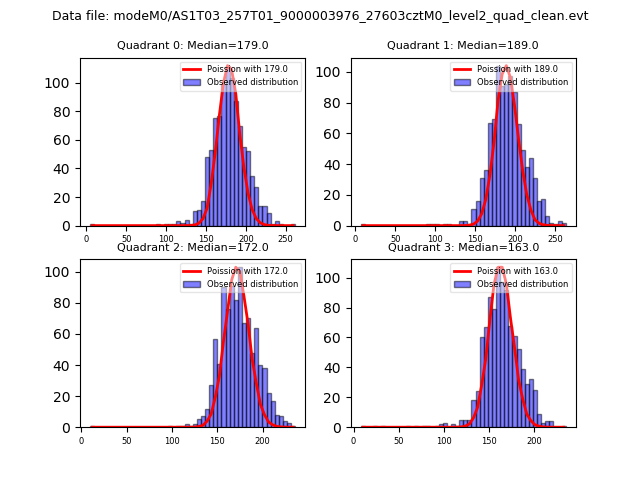
| Comparison with Poisson distribution Blue bars denote a histogram of data divided into 1 sec bins. Red curve is a Poisson curve with rate = median count rate of data. |
 |
 |
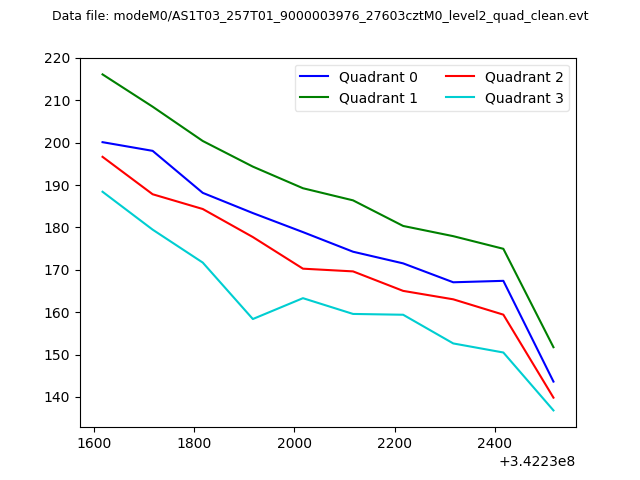
| Quadrant-wise count rates Data is divided into 100 sec bins |
 |
|
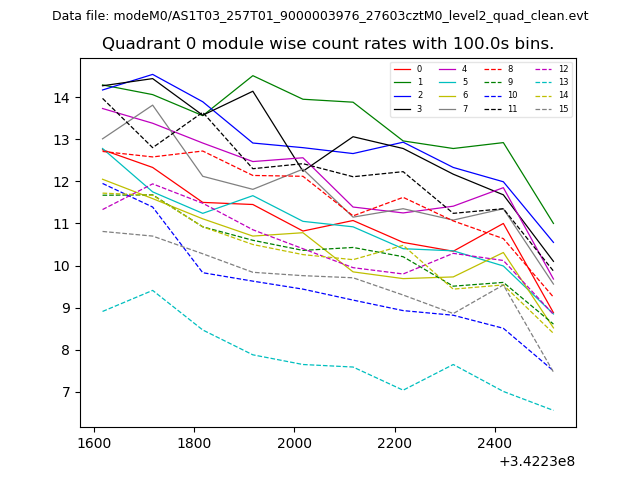
| Module-wise count rates for Quadrant A Data is divided into 100 sec bins |
 |
 |
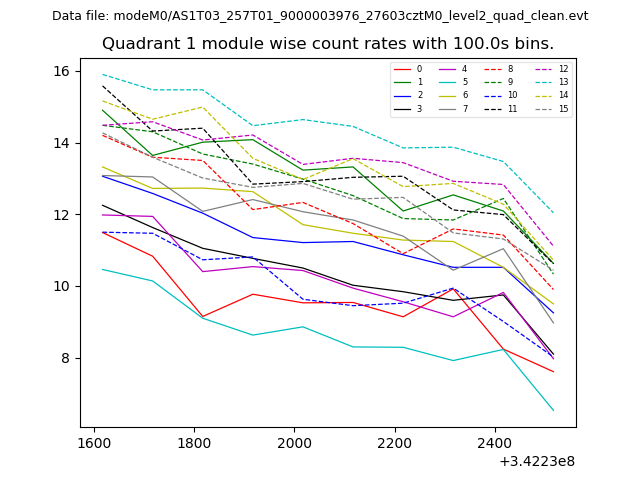
| Module-wise count rates for Quadrant B Data is divided into 100 sec bins |
 |
 |
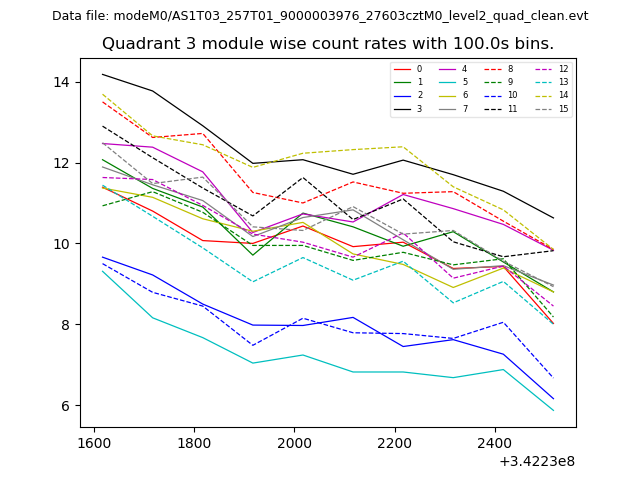
| Module-wise count rates for Quadrant C Data is divided into 100 sec bins |
 |
 |
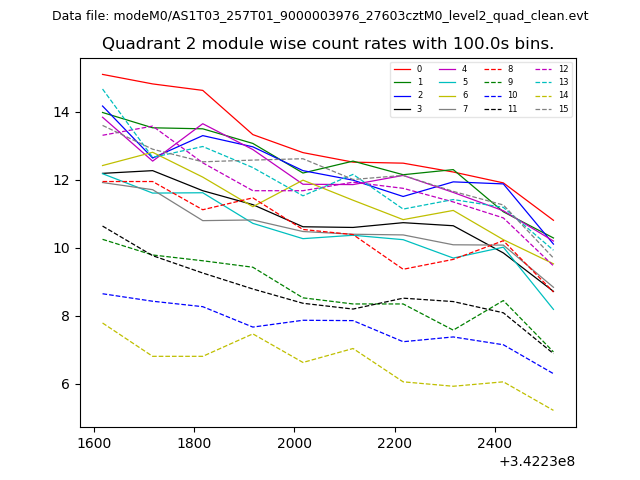
| Module-wise count rates for Quadrant D Data is divided into 100 sec bins |
 |
 |
| Parameter | Plot |
|---|---|
| CZT HV Monitor | 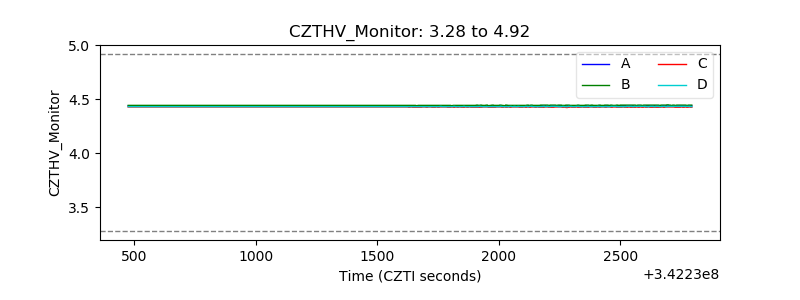 |
| D_VDD | 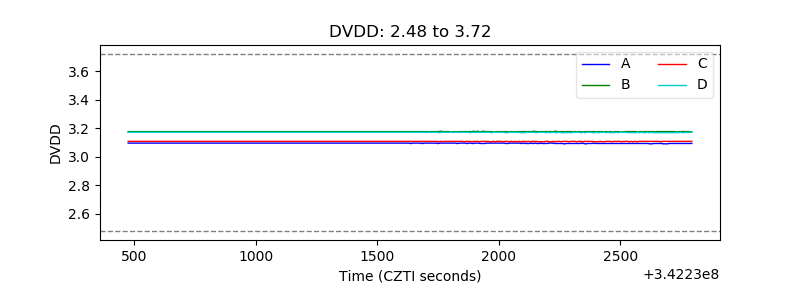 |
| Temperature 1 | 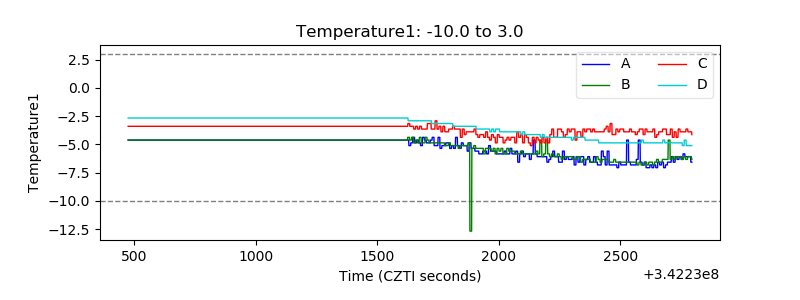 |
| Veto HV Monitor | 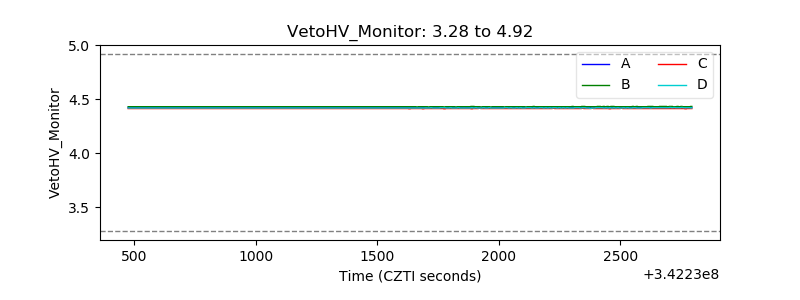 |
| Veto LLD | 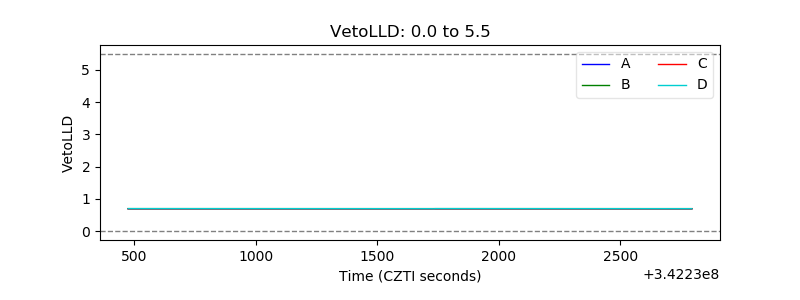 |
| Alpha Counter | 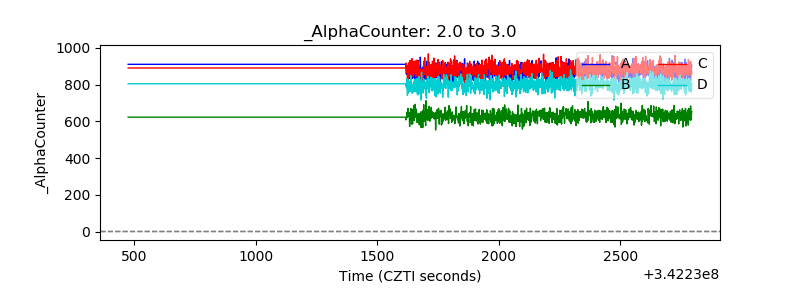 |
| _CPM_Rate | 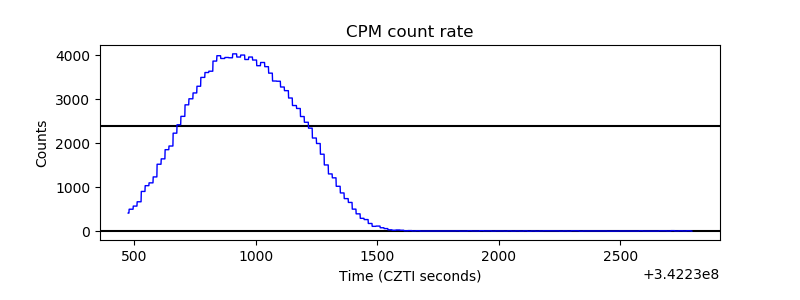 |
| CZT Counter | 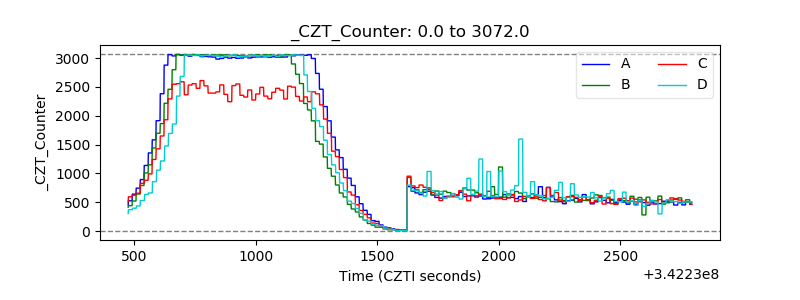 |
| +2.5 Volts monitor |  |
| +5 Volts monitor | 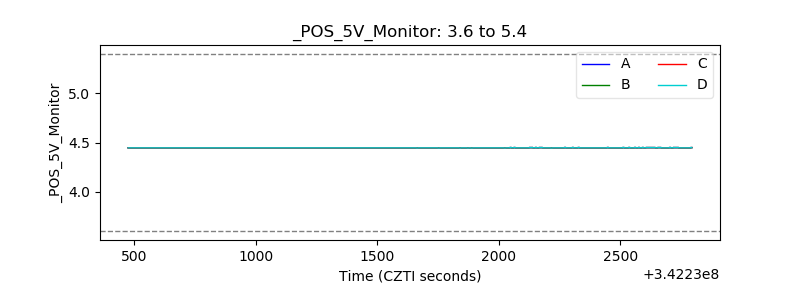 |
| _ROLL_ROT | 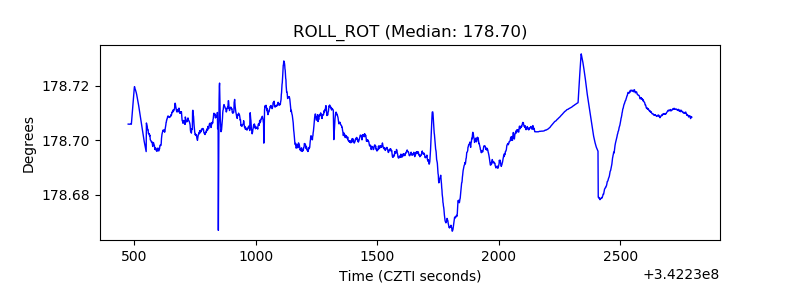 |
| _Roll_DEC | 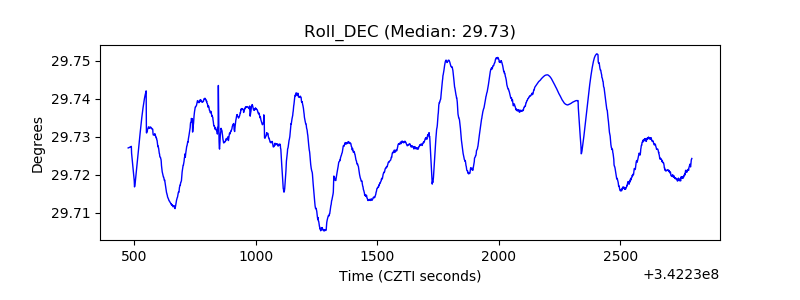 |
| _Roll_RA | 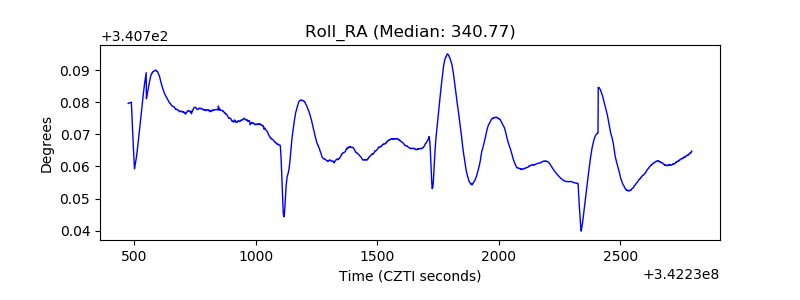 |
| Veto Counter | 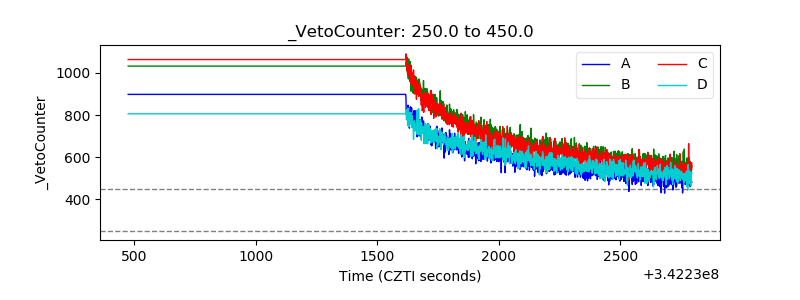 |