| Param | Original file | Final file |
|---|---|---|
| Filename | modeM0/AS1T03_257T01_9000003976_27604cztM0_level2.evt | modeM0/AS1T03_257T01_9000003976_27604cztM0_level2_quad_clean.evt |
| Size (bytes) | 501,223,680 | 82,503,360 |
| Size | 478.0 MB | 78.7 MB |
| Events in quadrant A | 3,211,917 | 536,160 |
| Events in quadrant B | 3,778,514 | 528,891 |
| Events in quadrant C | 3,284,887 | 518,840 |
| Events in quadrant D | 4,487,044 | 484,721 |
| Mode M9 | |||
|---|---|---|---|
| Quadrant | BADHDUFLAG | Total packets | Discarded packets |
| A | 0 | 20 | 0 |
| B | 0 | 21 | 0 |
| C | 0 | 21 | 0 |
| D | 0 | 21 | 0 |
| Mode M0 | |||
|---|---|---|---|
| Quadrant | BADHDUFLAG | Total packets | Discarded packets |
| A | 0 | 13116 | 0 |
| B | 0 | 14951 | 0 |
| C | 0 | 13381 | 0 |
| D | 0 | 17436 | 0 |
| Quadrant | Total seconds | Saturated seconds | Saturation percentage |
|---|---|---|---|
| A | 6149 | 34 | 0.552935% |
| B | 6149 | 278 | 4.521060% |
| C | 6149 | 68 | 1.105871% |
| D | 6149 | 196 | 3.187510% |
Noise dominated data is calculated using 1-second bins in cleaned event files. If a bin has >2000 counts, and if more than 50% of those come from <1% of pixels, then it is considered to be noise-dominated and hence unusable.
| Quadrant | # 1 sec bins | Bins with >0 counts | Bins with >2000 counts | High rate bins dominated by noise | Noise dominated (total time) | Noise dominated (detector-on time) | Marked lightcurve |
|---|---|---|---|---|---|---|---|
| A | 7524 | 6151 | 5 | 5 | 0.07% | 0.08% | 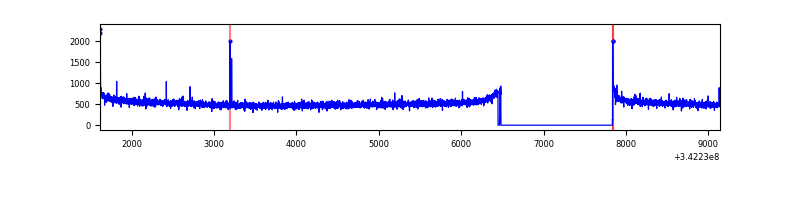 |
| B | 7524 | 6151 | 158 | 158 | 2.10% | 2.57% | 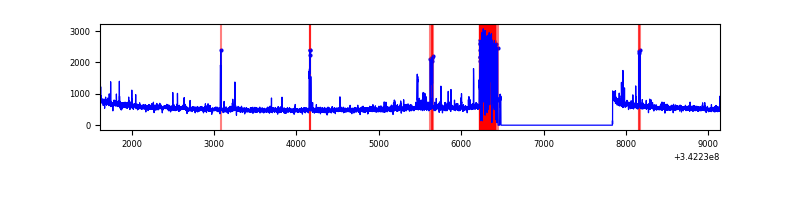 |
| C | 7524 | 6151 | 0 | 0 | 0.00% | 0.00% | 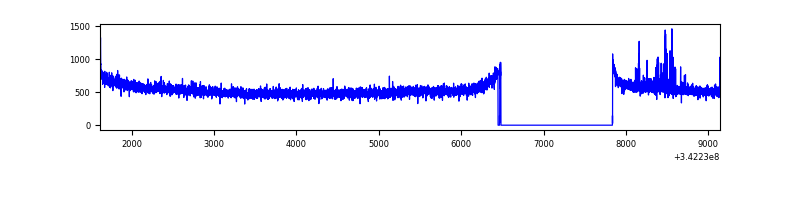 |
| D | 7524 | 6151 | 155 | 155 | 2.06% | 2.52% | 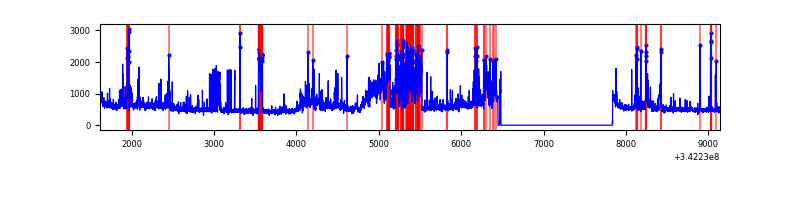 |
Top three noisy pixels from each quadrant. If the there are fewer than three noisy pixels in the level2.evt file, extra rows are filled as -1
| Pixel properties | Quadrant properties | ||||||
|---|---|---|---|---|---|---|---|
| Quadrant | DetID | PixID | Counts | Sigma | Mean | Median | Sigma |
| A | 8 | 192 | 13358 | 77.09 | 827 | 813 | 162.7 |
| A | 13 | 254 | 10600 | 60.14 | 827 | 813 | 162.7 |
| A | 6 | 16 | 7465 | 40.88 | 827 | 813 | 162.7 |
| B | 3 | 64 | 445135 | 2976.61 | 806 | 789 | 149.3 |
| B | 10 | 245 | 94769 | 629.56 | 806 | 789 | 149.3 |
| B | 0 | 230 | 46182 | 304.08 | 806 | 789 | 149.3 |
| C | 14 | 238 | 130786 | 705.81 | 797 | 805 | 184.2 |
| C | 8 | 208 | 30240 | 159.84 | 797 | 805 | 184.2 |
| C | 1 | 16 | 9280 | 46.02 | 797 | 805 | 184.2 |
| D | 7 | 80 | 926112 | 4998.22 | 782 | 762 | 185.1 |
| D | 1 | 52 | 445744 | 2403.54 | 782 | 762 | 185.1 |
| D | 2 | 250 | 78641 | 420.66 | 782 | 762 | 185.1 |
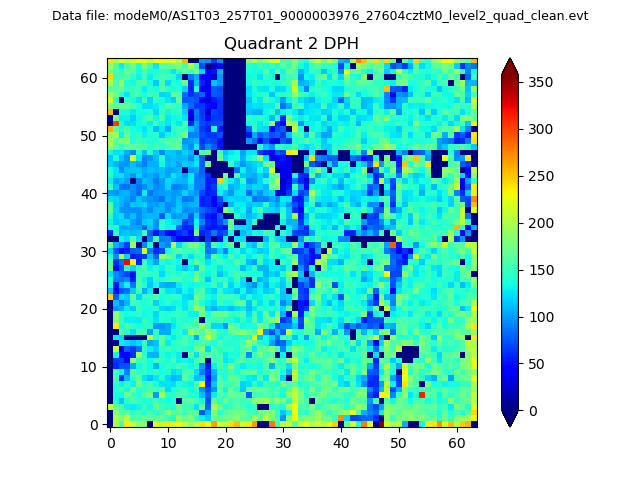
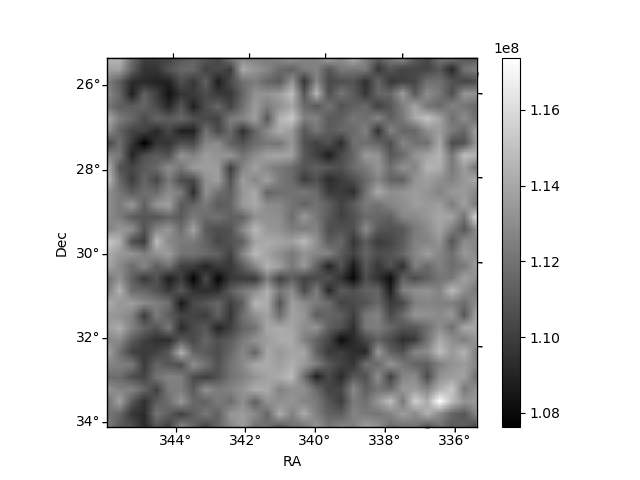
Histogram calculated using DETX and DETY for each event in the final _common_clean file
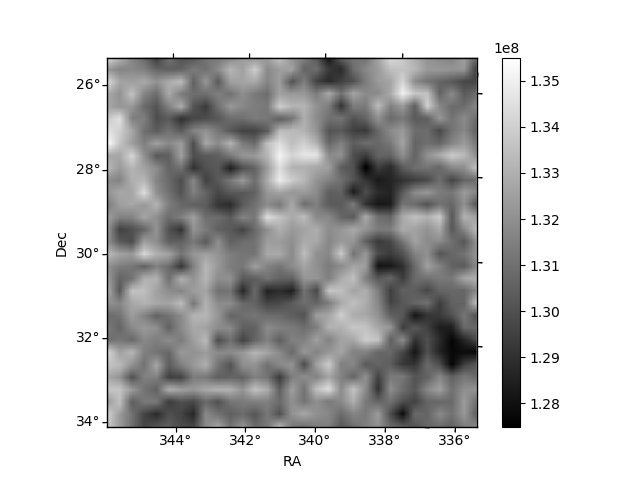
| Quadrant A | 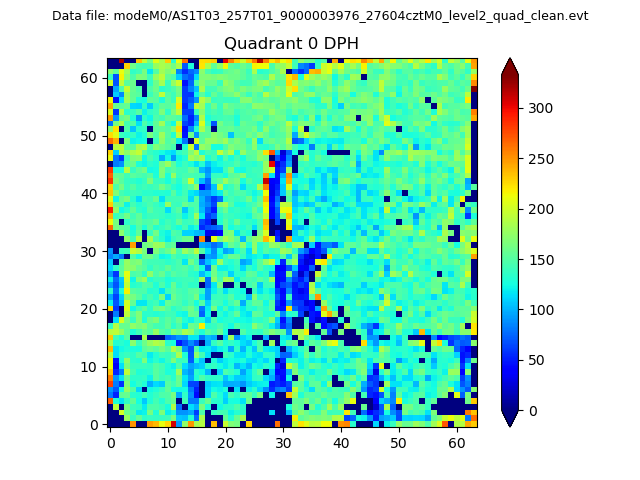 |
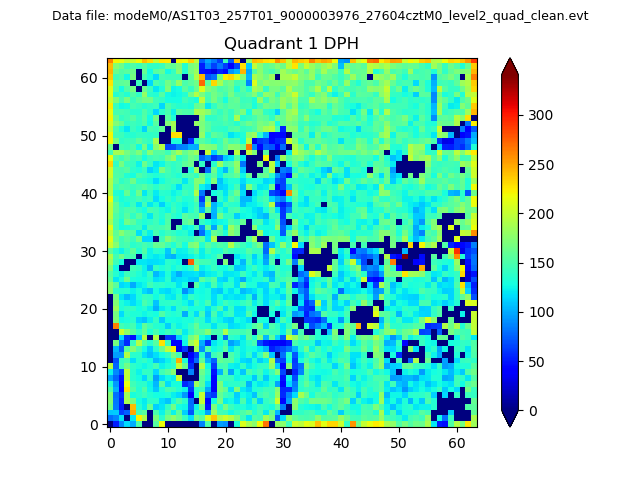 |
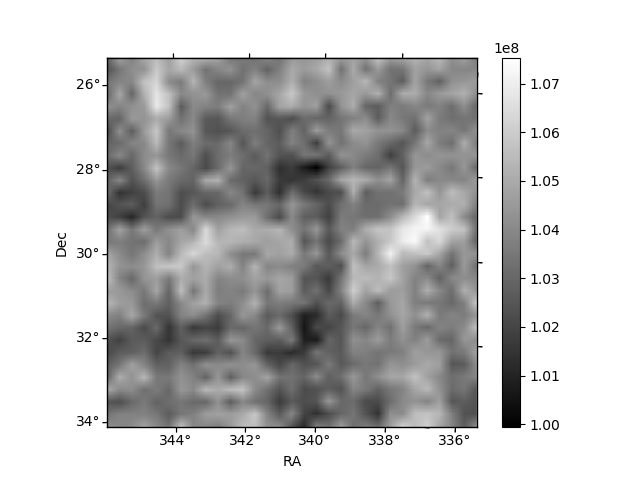
Quadrant B |
|---|---|---|---|
| Quadrant D | 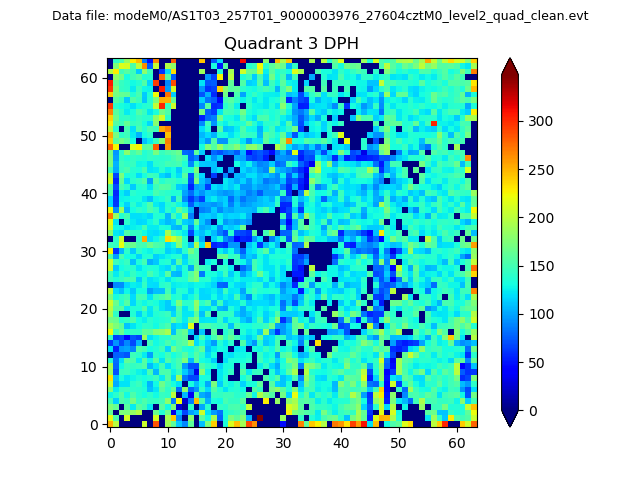 |
 |
Quadrant C |
| Plot type | Count rate plots | Images |
|---|---|---|
| Comparison with Poisson distribution Blue bars denote a histogram of data divided into 1 sec bins. Red curve is a Poisson curve with rate = median count rate of data. |
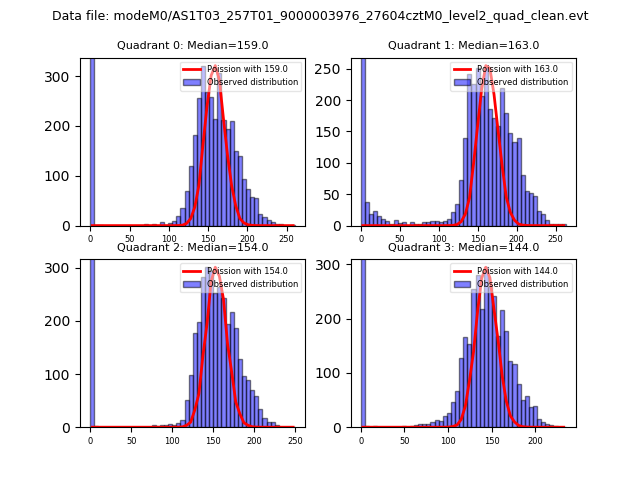 |
 |
| Quadrant-wise count rates Data is divided into 100 sec bins |
 |
|
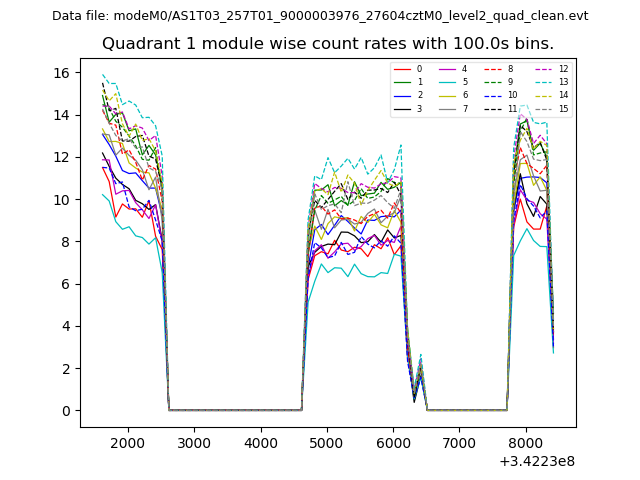
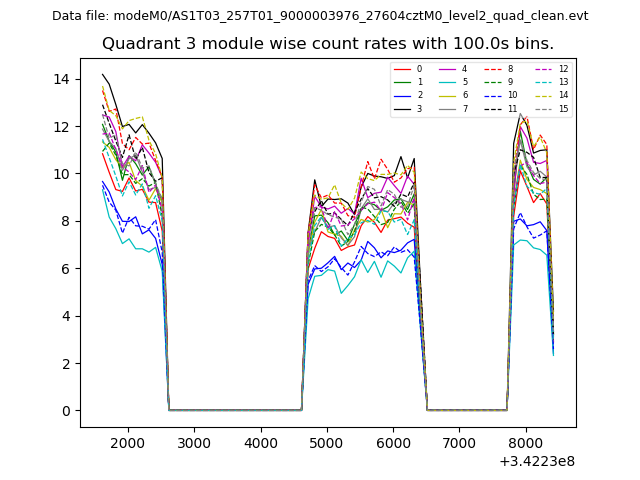
| Module-wise count rates for Quadrant A Data is divided into 100 sec bins |
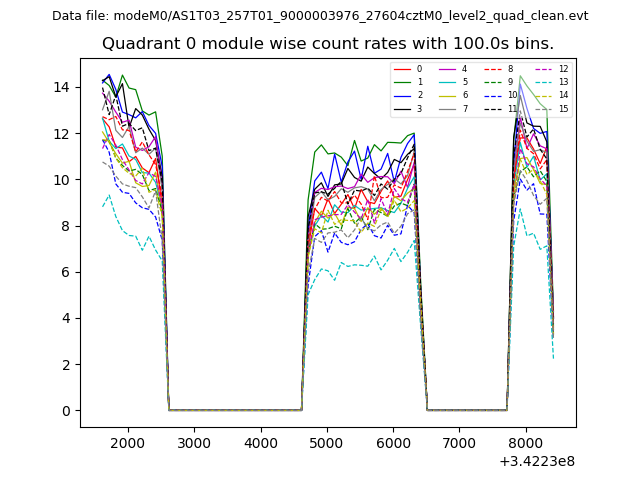 |
 |
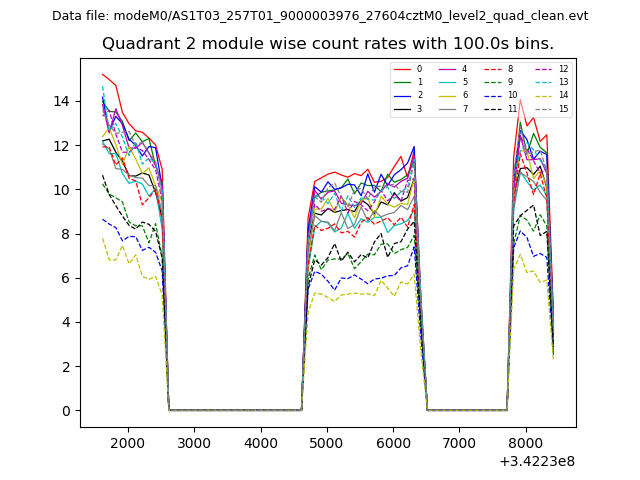
| Module-wise count rates for Quadrant B Data is divided into 100 sec bins |
 |
 |
| Module-wise count rates for Quadrant C Data is divided into 100 sec bins |
 |
 |
| Module-wise count rates for Quadrant D Data is divided into 100 sec bins |
 |
 |
| Parameter | Plot |
|---|---|
| CZT HV Monitor | 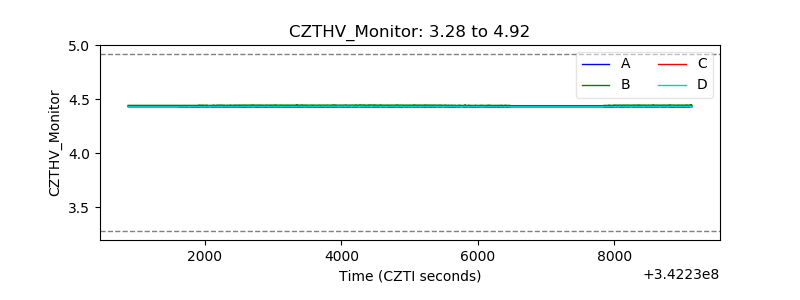 |
| D_VDD | 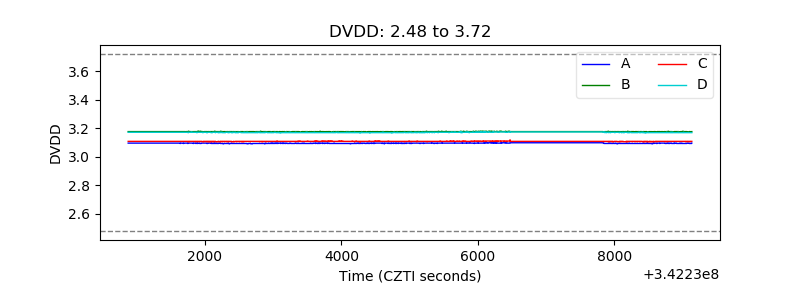 |
| Temperature 1 | 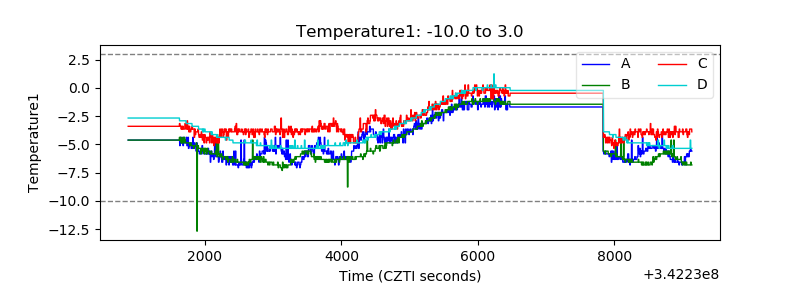 |
| Veto HV Monitor | 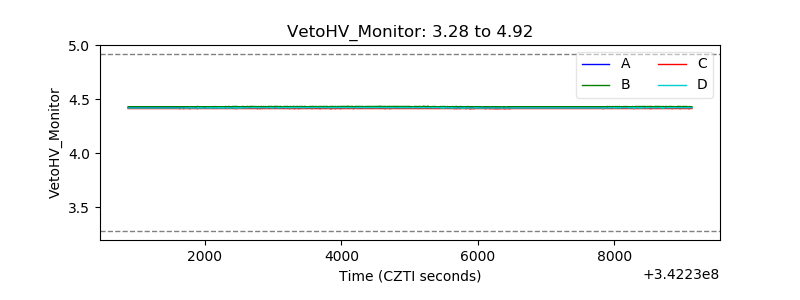 |
| Veto LLD | 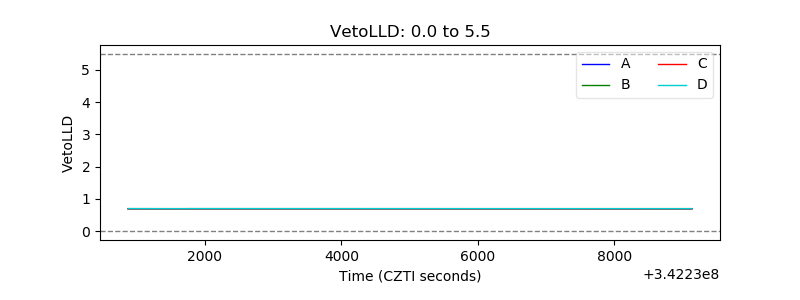 |
| Alpha Counter | 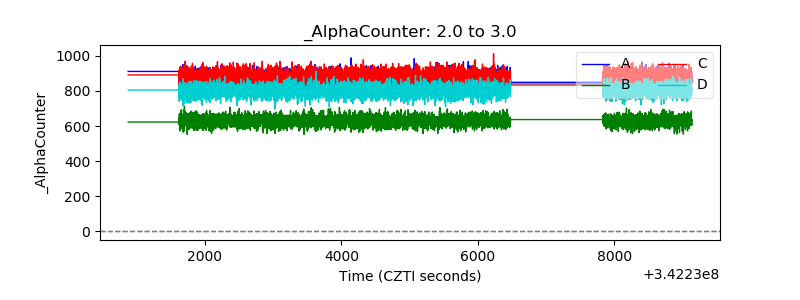 |
| _CPM_Rate |  |
| CZT Counter | 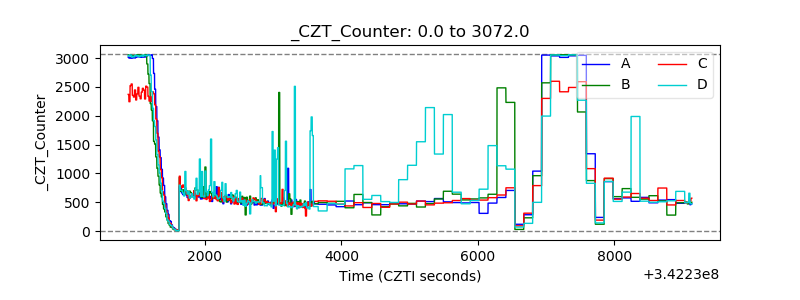 |
| +2.5 Volts monitor |  |
| +5 Volts monitor |  |
| _ROLL_ROT | 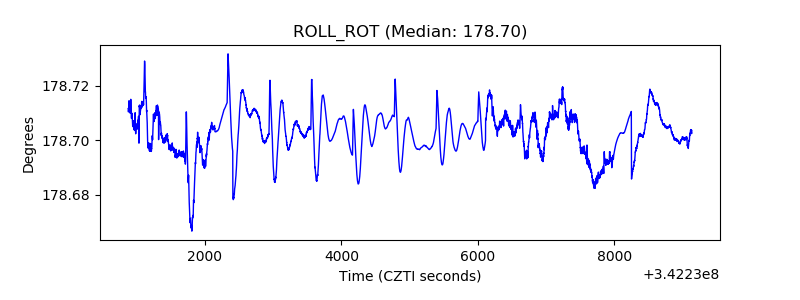 |
| _Roll_DEC | 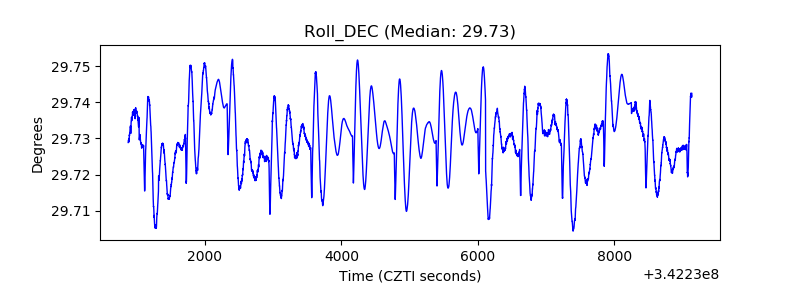 |
| _Roll_RA | 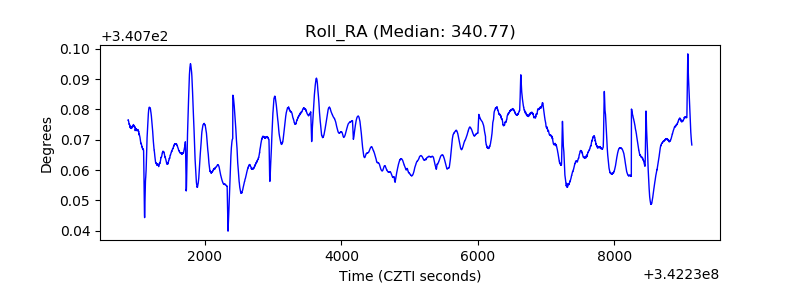 |
| Veto Counter | 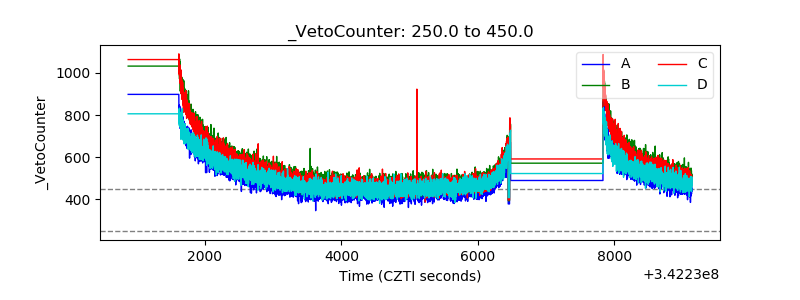 |