| Param | Original file | Final file |
|---|---|---|
| Filename | modeM0/AS1A09_038T36_9000003978cztM0_level2.fits | modeM0/AS1A09_038T36_9000003978cztM0_level2_quad_clean.evt |
| Size (bytes) | 60,575,040 | 28,074,240 |
| Size | 57.8 MB | 26.8 MB |
| Events in quadrant A | 363,748 | 105,175 |
| Events in quadrant B | 352,494 | 104,632 |
| Events in quadrant C | 354,768 | 99,615 |
| Events in quadrant D | 312,206 | 88,114 |
| Mode SS | |||
|---|---|---|---|
| Quadrant | BADHDUFLAG | Total packets | Discarded packets |
| A | 0 | 134 | 0 |
| B | 0 | 134 | 0 |
| C | 0 | 134 | 0 |
| D | 0 | 134 | 0 |
| Mode M0 | |||
|---|---|---|---|
| Quadrant | BADHDUFLAG | Total packets | Discarded packets |
| A | 0 | 13322 | 0 |
| B | 0 | 13424 | 0 |
| C | 0 | 13761 | 0 |
| D | 0 | 17477 | 0 |
| Mode M9 | |||
|---|---|---|---|
| Quadrant | BADHDUFLAG | Total packets | Discarded packets |
| A | 0 | 7 | 0 |
| B | 0 | 7 | 0 |
| C | 0 | 7 | 0 |
| D | 0 | 7 | 0 |
| Quadrant | Total seconds | Saturated seconds | Saturation percentage |
|---|---|---|---|
| A | 6467 | 192 | 2.968919% |
| B | 6467 | 210 | 3.247255% |
| C | 6467 | 260 | 4.020411% |
| D | 6467 | 296 | 4.577084% |
Noise dominated data is calculated using 1-second bins in cleaned event files. If a bin has >2000 counts, and if more than 50% of those come from <1% of pixels, then it is considered to be noise-dominated and hence unusable.
| Quadrant | # 1 sec bins | Bins with >0 counts | Bins with >2000 counts | High rate bins dominated by noise | Noise dominated (total time) | Noise dominated (detector-on time) | Marked lightcurve |
|---|---|---|---|---|---|---|---|
| A | 6766 | 6465 | 0 | 0 | 0.00% | 0.00% | 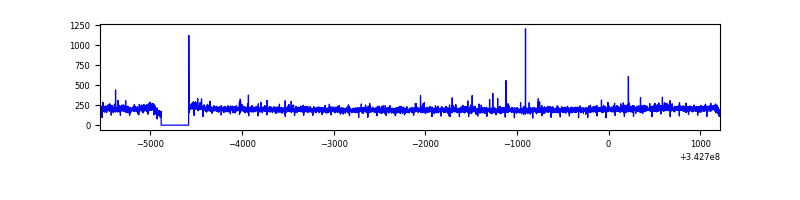 |
| B | 6766 | 6465 | 0 | 0 | 0.00% | 0.00% | 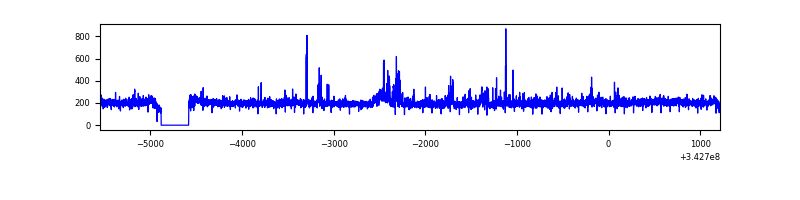 |
| C | 6766 | 6465 | 0 | 0 | 0.00% | 0.00% | 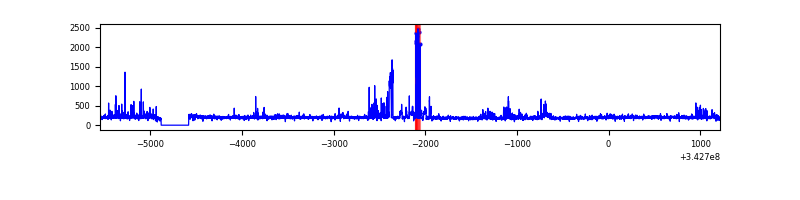 |
| D | 6766 | 6462 | 0 | 0 | 0.00% | 0.00% | 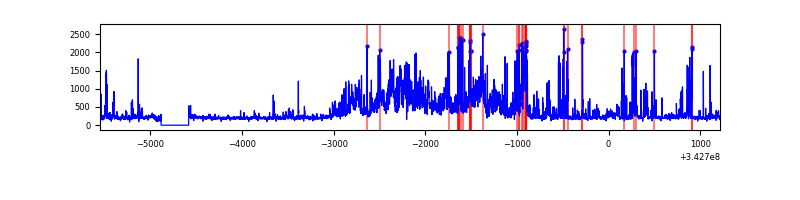 |
Top three noisy pixels from each quadrant. If the there are fewer than three noisy pixels in the level2.evt file, extra rows are filled as -1
| Pixel properties | Quadrant properties | ||||||
|---|---|---|---|---|---|---|---|
| Quadrant | DetID | PixID | Counts | Sigma | Mean | Median | Sigma |
| A | 0 | 29 | 336 | 9.66 | 94 | 89 | 25.6 |
| A | 7 | 110 | 318 | 8.96 | 94 | 89 | 25.6 |
| A | 14 | 95 | 304 | 8.41 | 94 | 89 | 25.6 |
| B | 2 | 9 | 272 | 8.74 | 93 | 88 | 21.1 |
| B | 14 | 254 | 244 | 7.41 | 93 | 88 | 21.1 |
| B | 5 | 128 | 237 | 7.08 | 93 | 88 | 21.1 |
| C | 1 | 80 | 265 | 6.91 | 93 | 88 | 25.6 |
| C | 1 | 81 | 263 | 6.83 | 93 | 88 | 25.6 |
| C | 12 | 250 | 256 | 6.56 | 93 | 88 | 25.6 |
| D | 4 | 246 | 244 | 6.38 | 88 | 80 | 25.7 |
| D | 6 | 231 | 237 | 6.11 | 88 | 80 | 25.7 |
| D | 3 | 31 | 234 | 5.99 | 88 | 80 | 25.7 |
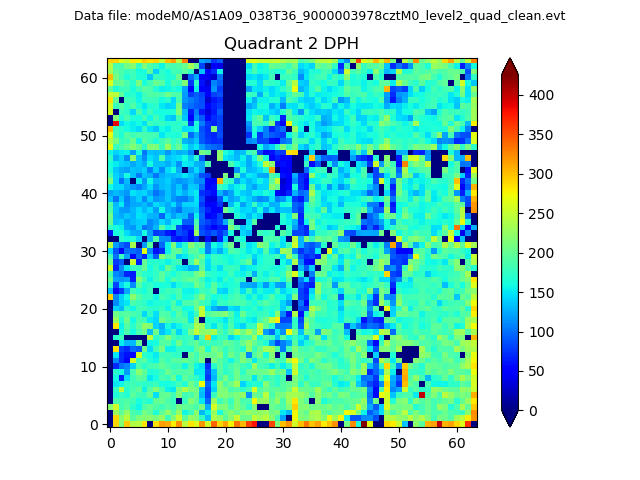
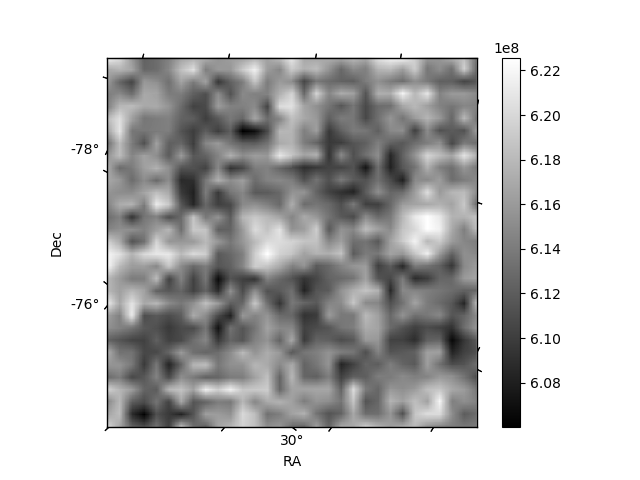
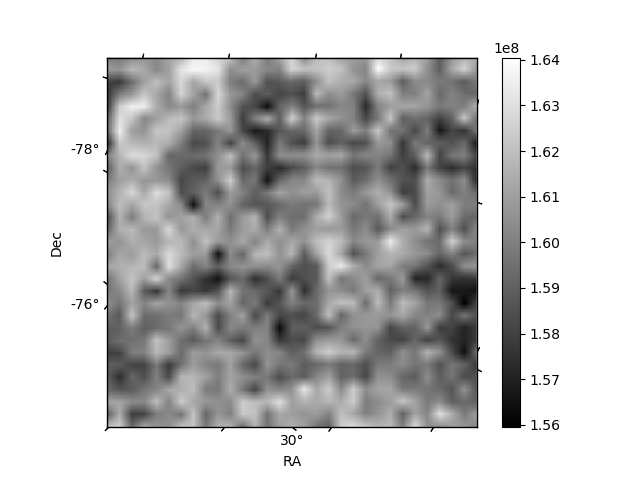
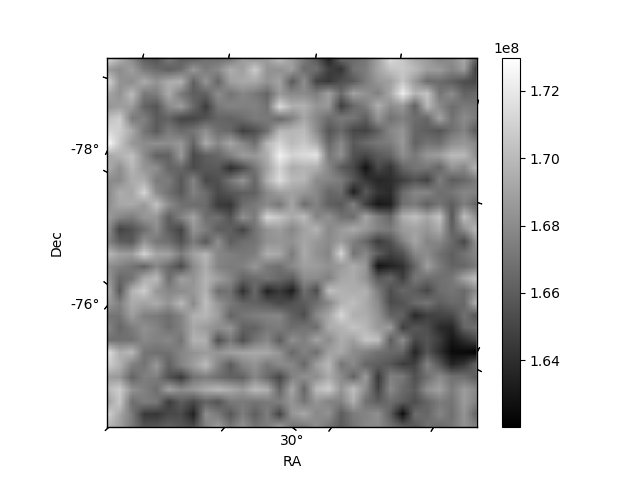
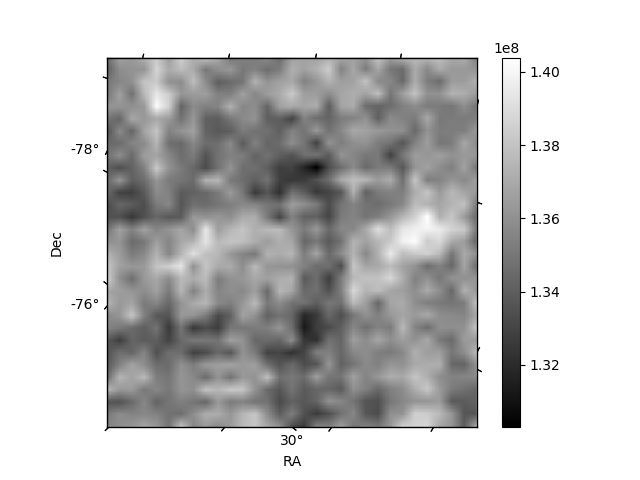
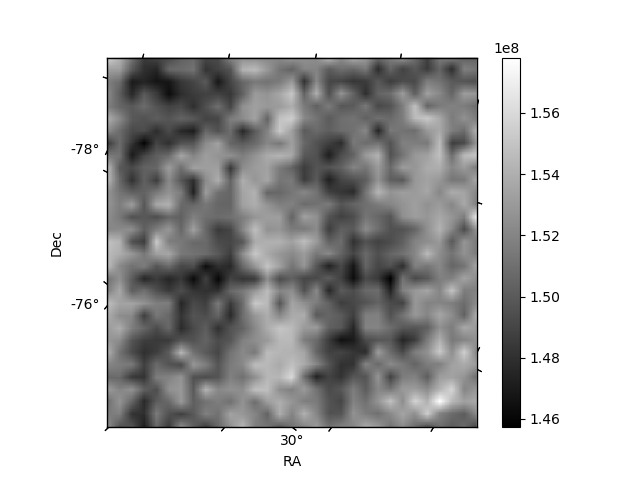
Histogram calculated using DETX and DETY for each event in the final _common_clean file
| Quadrant A | 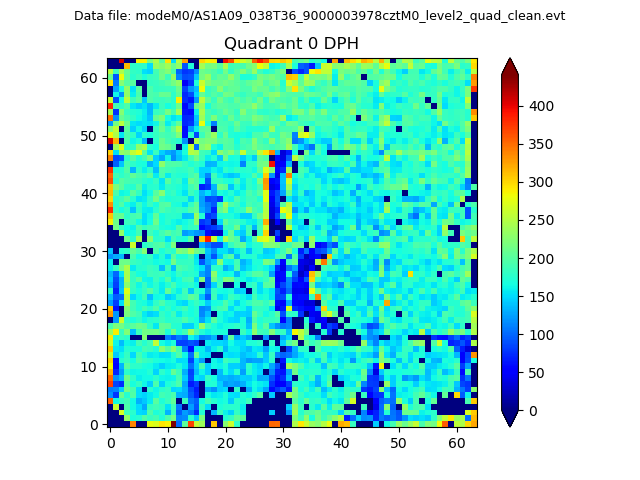 |
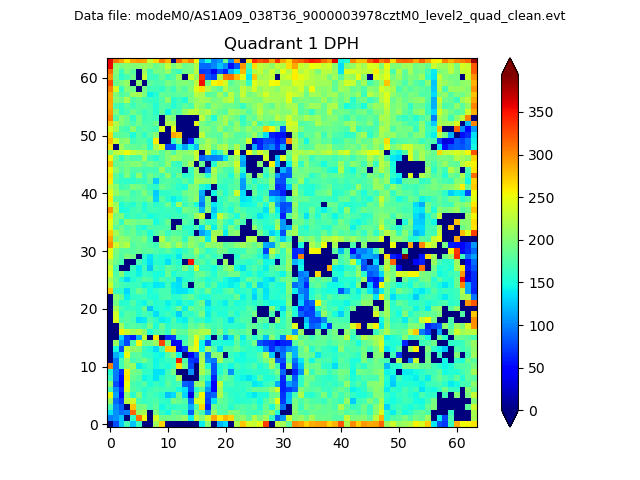 |
Quadrant B |
|---|---|---|---|
| Quadrant D | 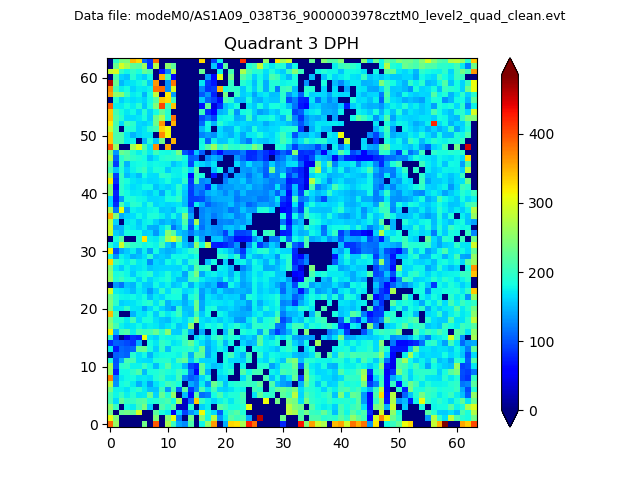 |
 |
Quadrant C |
| Plot type | Count rate plots | Images |
|---|---|---|
| Comparison with Poisson distribution Blue bars denote a histogram of data divided into 1 sec bins. Red curve is a Poisson curve with rate = median count rate of data. |
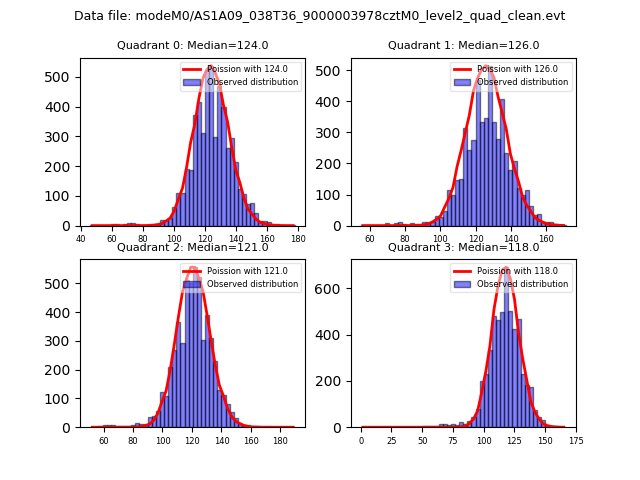 |
 |
| Quadrant-wise count rates Data is divided into 100 sec bins |
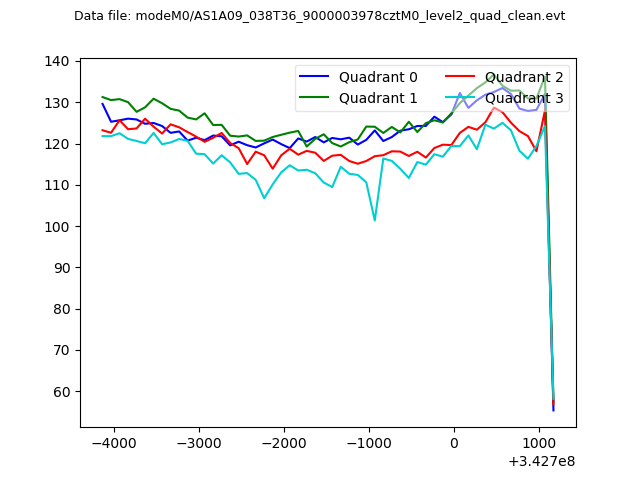 |
|
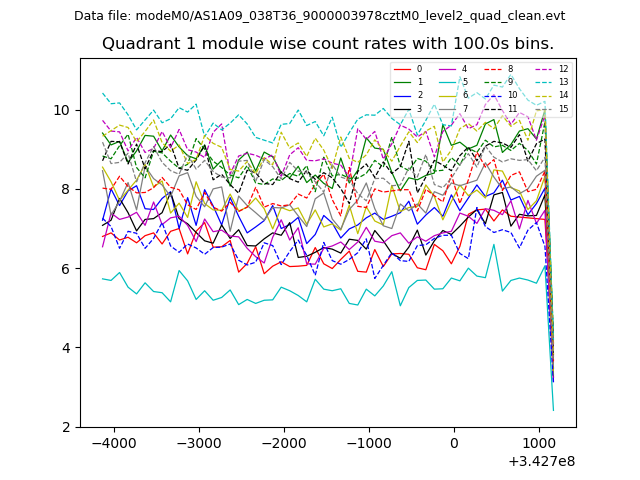
| Module-wise count rates for Quadrant A Data is divided into 100 sec bins |
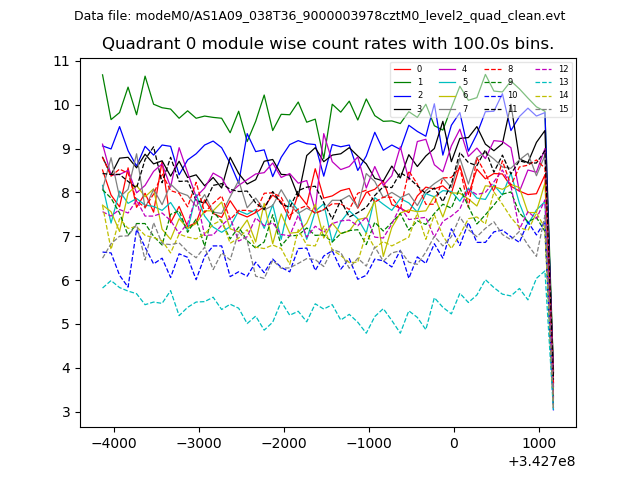 |
 |
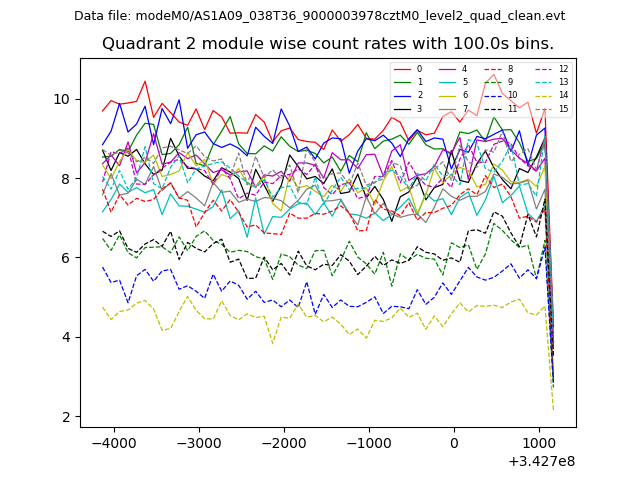
| Module-wise count rates for Quadrant B Data is divided into 100 sec bins |
 |
 |
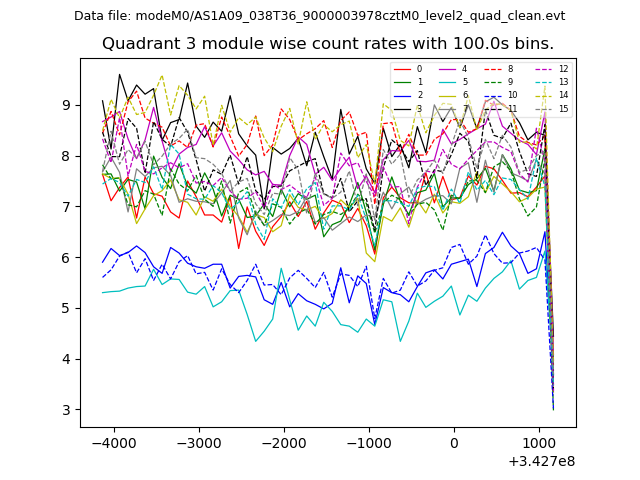
| Module-wise count rates for Quadrant C Data is divided into 100 sec bins |
 |
 |
| Module-wise count rates for Quadrant D Data is divided into 100 sec bins |
 |
 |
| Parameter | Plot |
|---|---|
| CZT HV Monitor | 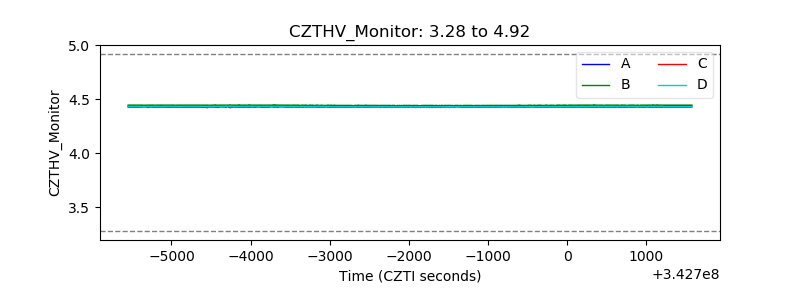 |
| D_VDD | 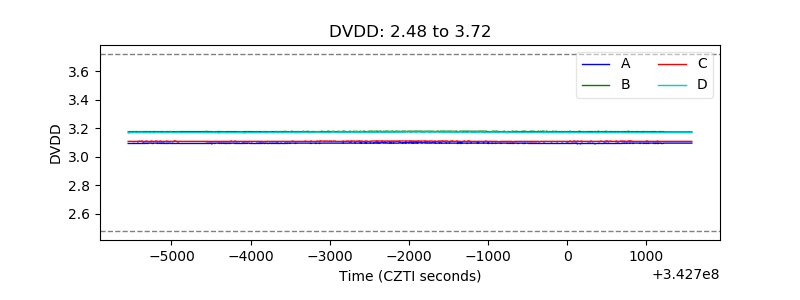 |
| Temperature 1 | 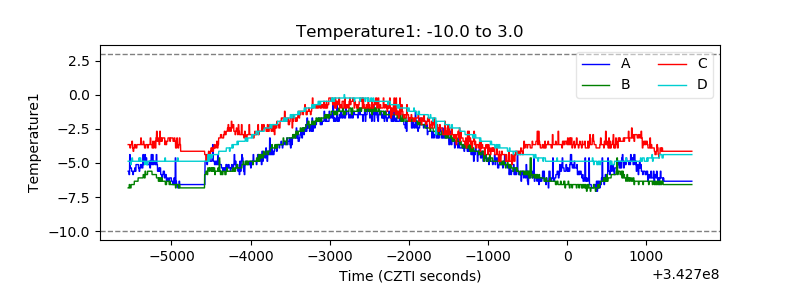 |
| Veto HV Monitor | 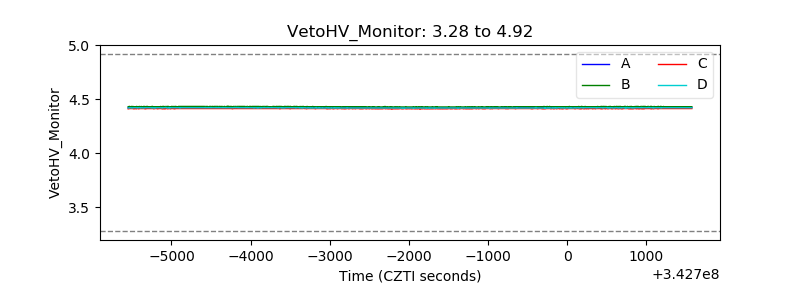 |
| Veto LLD | 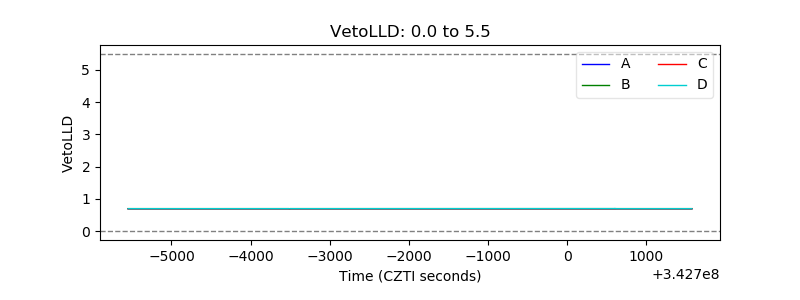 |
| Alpha Counter | 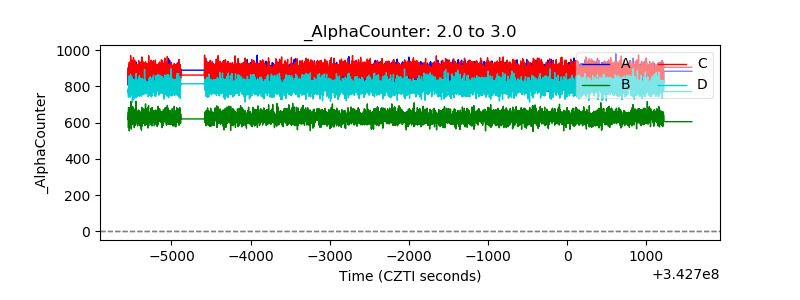 |
| _CPM_Rate | 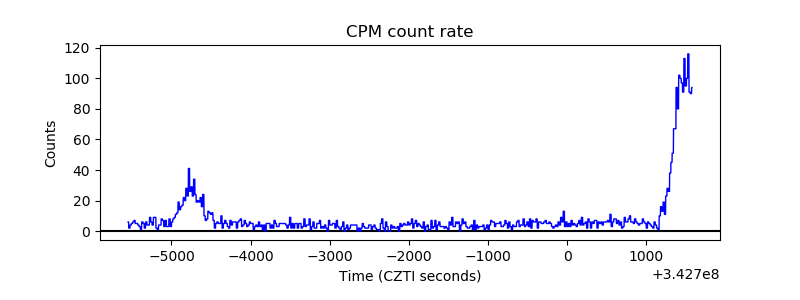 |
| CZT Counter | 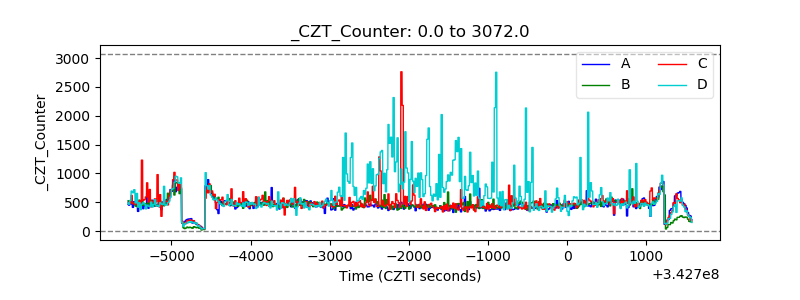 |
| +2.5 Volts monitor | 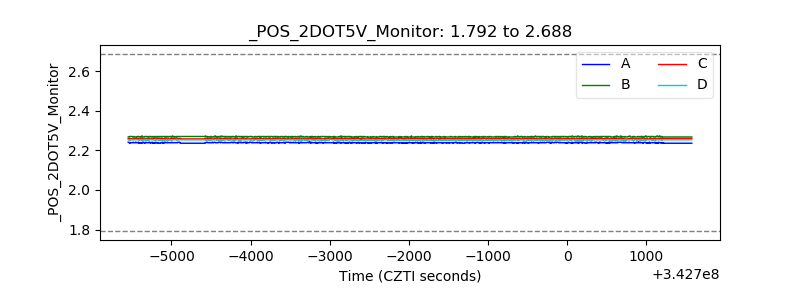 |
| +5 Volts monitor | 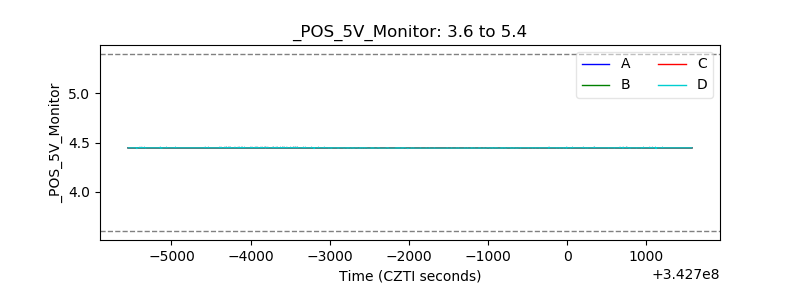 |
| _ROLL_ROT | 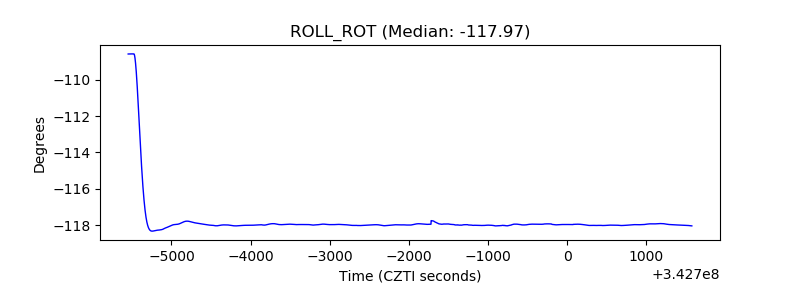 |
| _Roll_DEC | 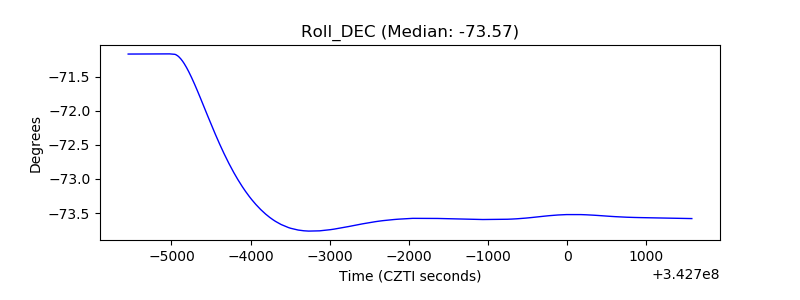 |
| _Roll_RA | 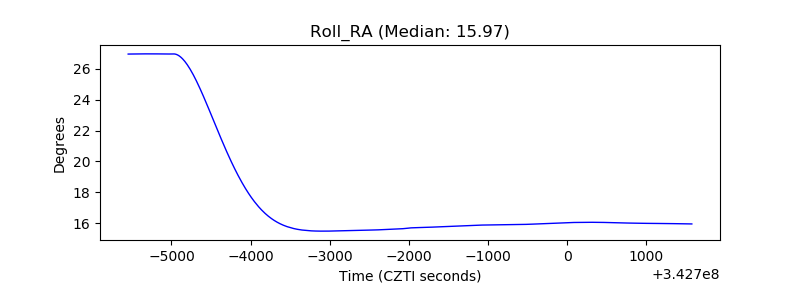 |
| Veto Counter | 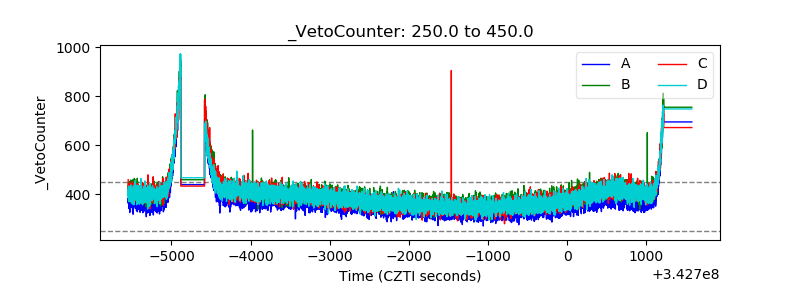 |