| Param | Original file | Final file |
|---|---|---|
| Filename | modeM0/AS1A09_038T36_9000003978_27685cztM0_level2.evt | modeM0/AS1A09_038T36_9000003978_27685cztM0_level2_quad_clean.evt |
| Size (bytes) | 469,296,000 | 116,464,320 |
| Size | 447.6 MB | 111.1 MB |
| Events in quadrant A | 3,007,864 | 783,204 |
| Events in quadrant B | 3,109,066 | 798,792 |
| Events in quadrant C | 3,239,243 | 757,670 |
| Events in quadrant D | 4,416,771 | 736,189 |
| Mode M0 | |||
|---|---|---|---|
| Quadrant | BADHDUFLAG | Total packets | Discarded packets |
| A | 0 | 13322 | 0 |
| B | 0 | 13424 | 0 |
| C | 0 | 13761 | 0 |
| D | 0 | 17477 | 0 |
| Mode M9 | |||
|---|---|---|---|
| Quadrant | BADHDUFLAG | Total packets | Discarded packets |
| A | 0 | 7 | 0 |
| B | 0 | 7 | 0 |
| C | 0 | 7 | 0 |
| D | 0 | 7 | 0 |
| Quadrant | Total seconds | Saturated seconds | Saturation percentage |
|---|---|---|---|
| A | 6467 | 192 | 2.968919% |
| B | 6467 | 210 | 3.247255% |
| C | 6467 | 260 | 4.020411% |
| D | 6467 | 296 | 4.577084% |
Noise dominated data is calculated using 1-second bins in cleaned event files. If a bin has >2000 counts, and if more than 50% of those come from <1% of pixels, then it is considered to be noise-dominated and hence unusable.
| Quadrant | # 1 sec bins | Bins with >0 counts | Bins with >2000 counts | High rate bins dominated by noise | Noise dominated (total time) | Noise dominated (detector-on time) | Marked lightcurve |
|---|---|---|---|---|---|---|---|
| A | 6766 | 6466 | 0 | 0 | 0.00% | 0.00% | 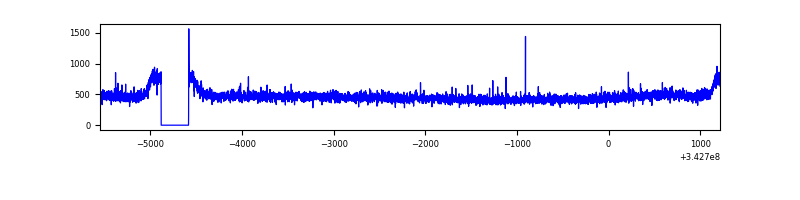 |
| B | 6766 | 6466 | 1 | 1 | 0.01% | 0.02% | 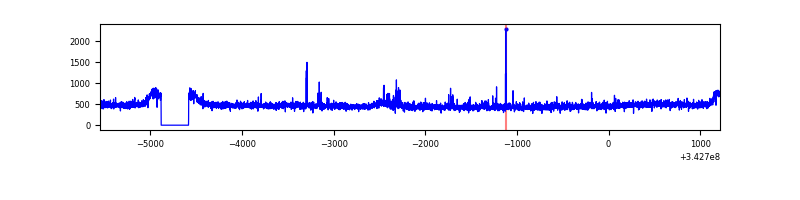 |
| C | 6766 | 6466 | 11 | 11 | 0.16% | 0.17% | 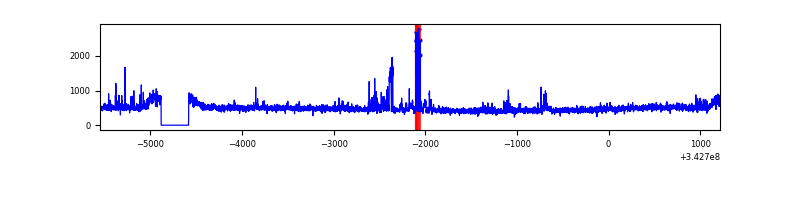 |
| D | 6766 | 6466 | 140 | 140 | 2.07% | 2.17% | 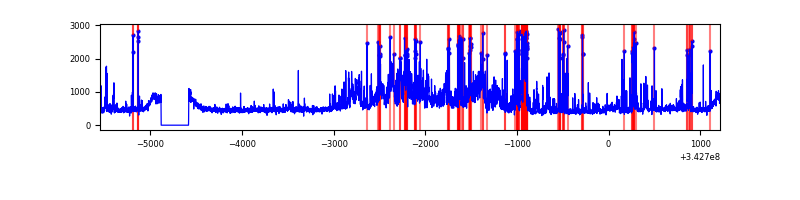 |
Top three noisy pixels from each quadrant. If the there are fewer than three noisy pixels in the level2.evt file, extra rows are filled as -1
| Pixel properties | Quadrant properties | ||||||
|---|---|---|---|---|---|---|---|
| Quadrant | DetID | PixID | Counts | Sigma | Mean | Median | Sigma |
| A | 13 | 254 | 10090 | 59.51 | 775 | 756 | 156.8 |
| A | 3 | 137 | 7674 | 44.11 | 775 | 756 | 156.8 |
| A | 0 | 226 | 6567 | 37.05 | 775 | 756 | 156.8 |
| B | 0 | 230 | 30893 | 203.04 | 772 | 750 | 148.5 |
| B | 15 | 32 | 23869 | 155.73 | 772 | 750 | 148.5 |
| B | 12 | 111 | 18343 | 118.51 | 772 | 750 | 148.5 |
| C | 8 | 208 | 154225 | 875.78 | 746 | 748 | 175.2 |
| C | 14 | 238 | 118177 | 670.08 | 746 | 748 | 175.2 |
| C | 3 | 233 | 36215 | 202.38 | 746 | 748 | 175.2 |
| D | 12 | 2 | 795616 | 4420.37 | 752 | 730 | 179.8 |
| D | 1 | 52 | 495267 | 2750.13 | 752 | 730 | 179.8 |
| D | 2 | 250 | 224281 | 1243.17 | 752 | 730 | 179.8 |
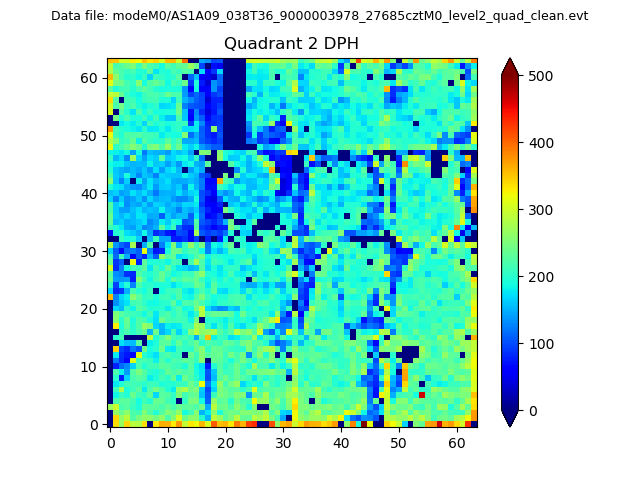
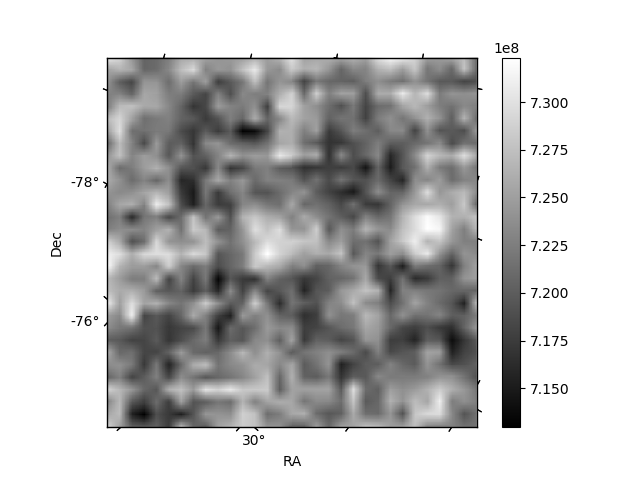
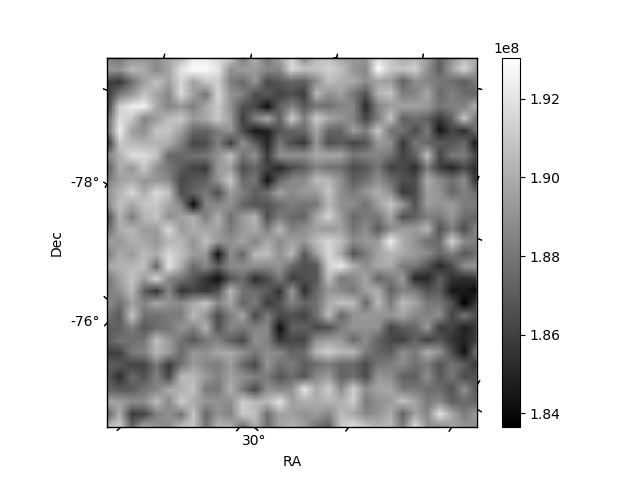
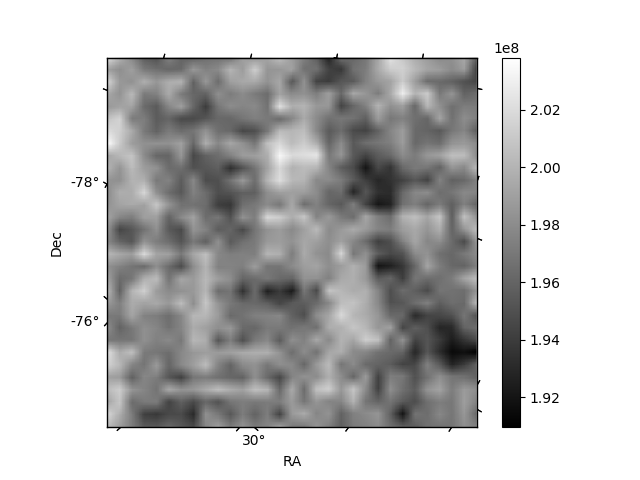
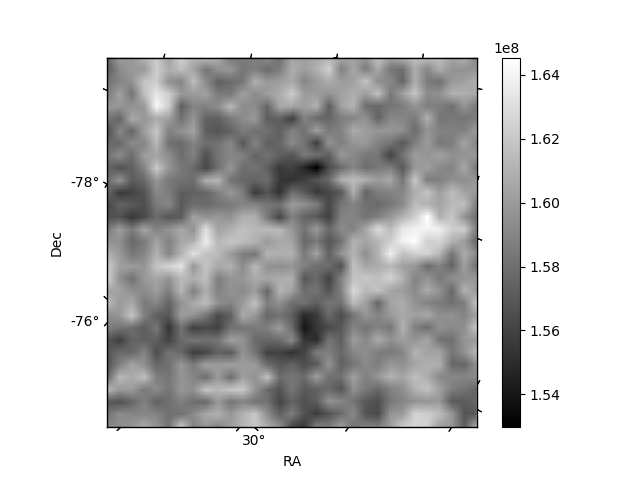
Histogram calculated using DETX and DETY for each event in the final _common_clean file
| Quadrant A | 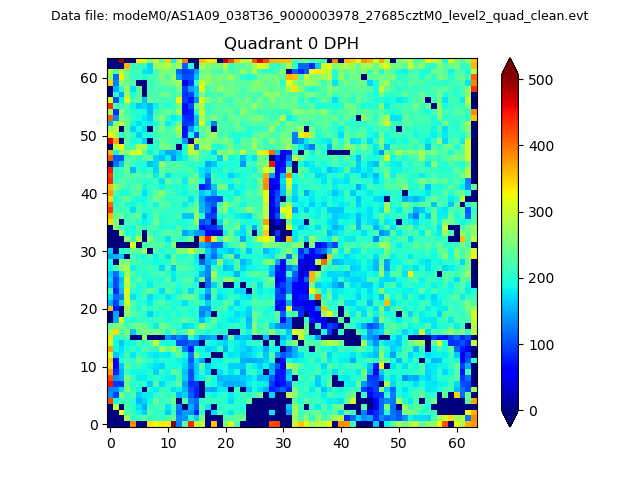 |
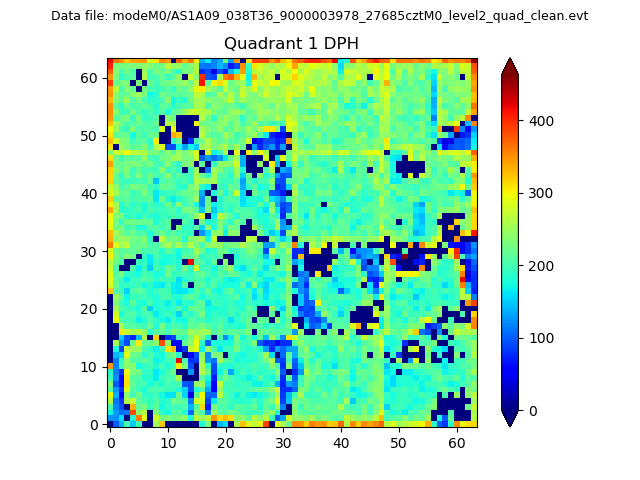 |
Quadrant B |
|---|---|---|---|
| Quadrant D | 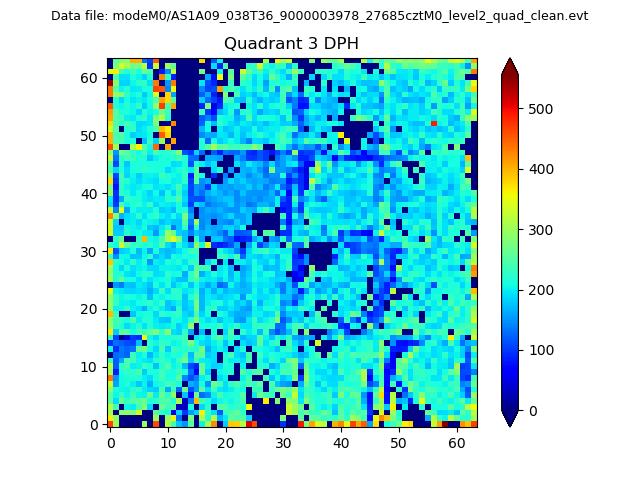 |
 |
Quadrant C |
| Plot type | Count rate plots | Images |
|---|---|---|
| Comparison with Poisson distribution Blue bars denote a histogram of data divided into 1 sec bins. Red curve is a Poisson curve with rate = median count rate of data. |
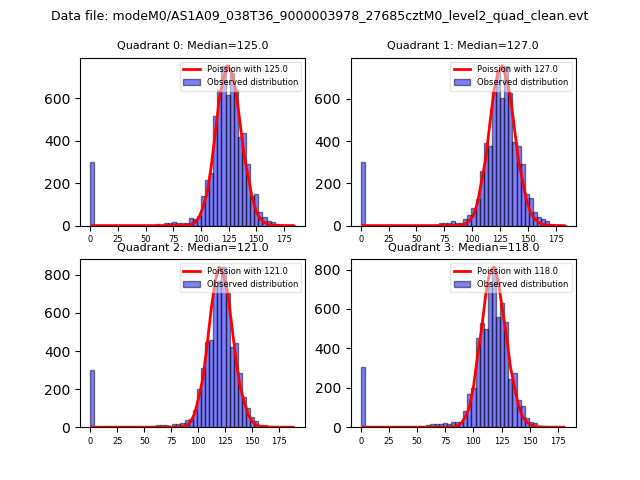 |
 |
| Quadrant-wise count rates Data is divided into 100 sec bins |
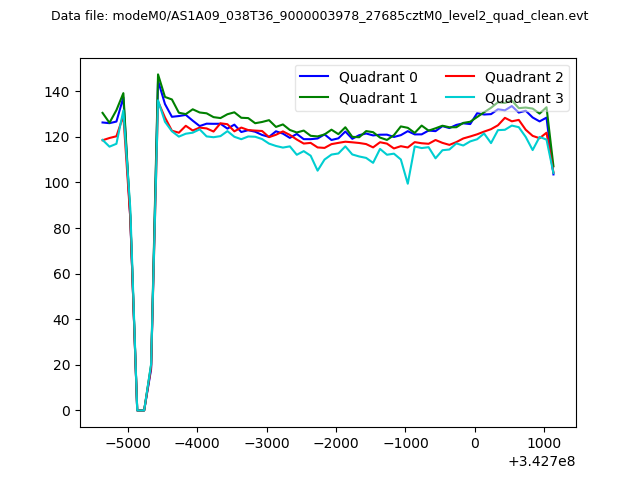 |
|
| Module-wise count rates for Quadrant A Data is divided into 100 sec bins |
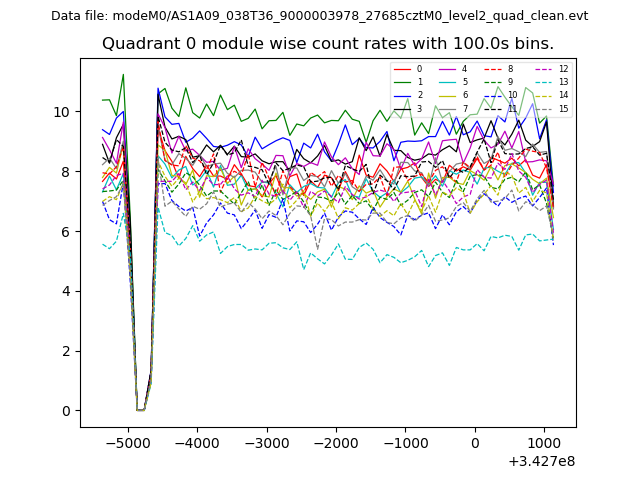 |
 |
| Module-wise count rates for Quadrant B Data is divided into 100 sec bins |
 |
 |
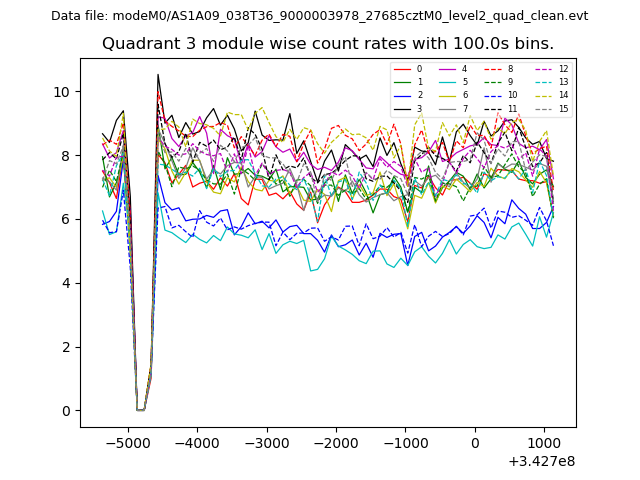
| Module-wise count rates for Quadrant C Data is divided into 100 sec bins |
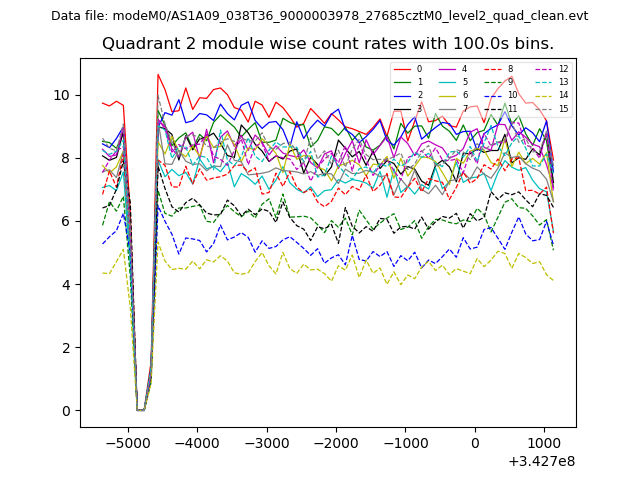 |
 |
| Module-wise count rates for Quadrant D Data is divided into 100 sec bins |
 |
 |
| Parameter | Plot |
|---|---|
| CZT HV Monitor | 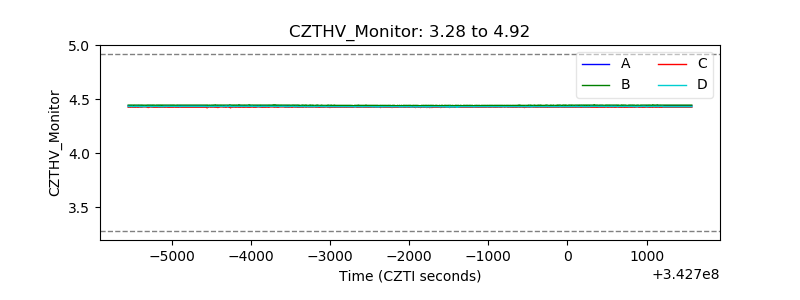 |
| D_VDD | 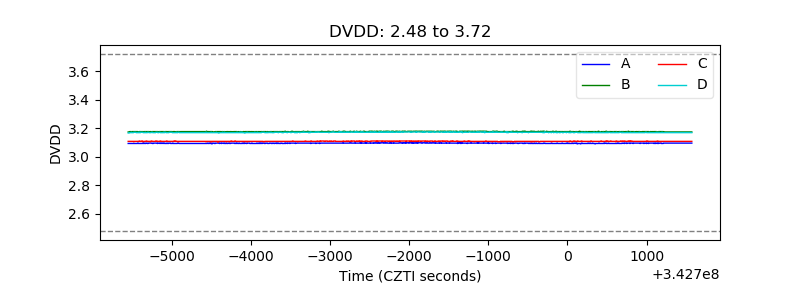 |
| Temperature 1 | 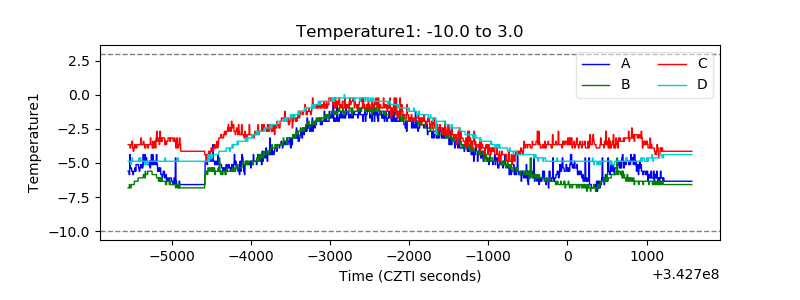 |
| Veto HV Monitor | 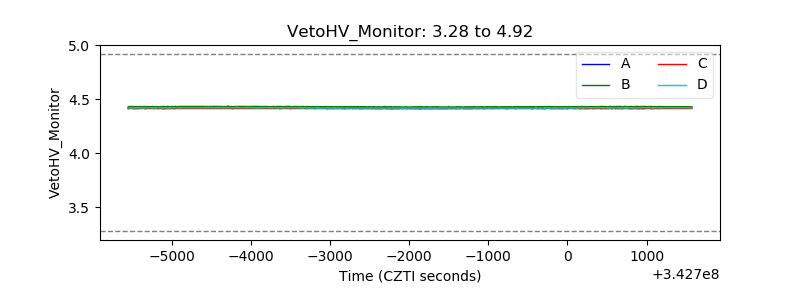 |
| Veto LLD | 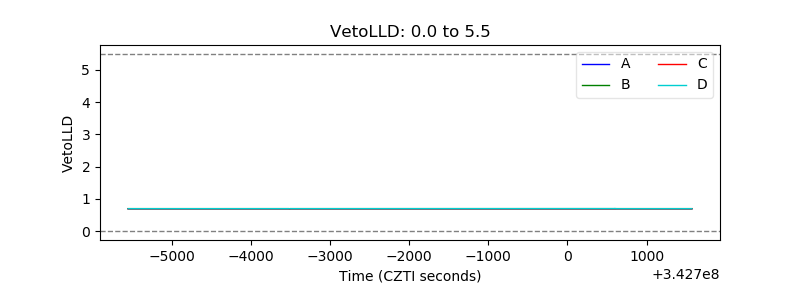 |
| Alpha Counter | 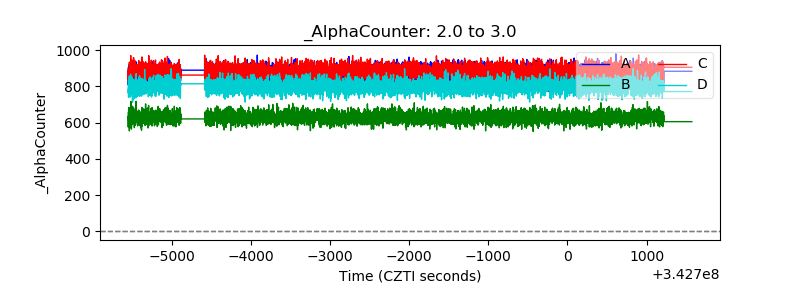 |
| _CPM_Rate | 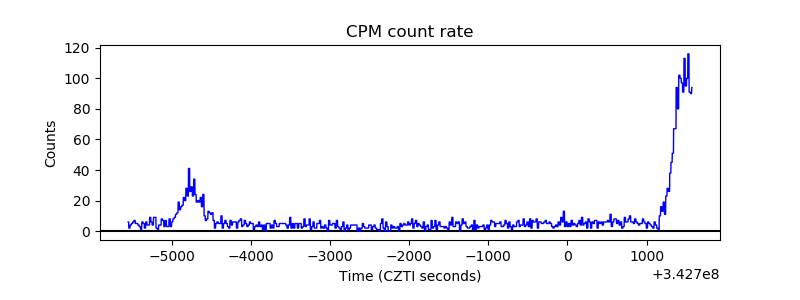 |
| CZT Counter | 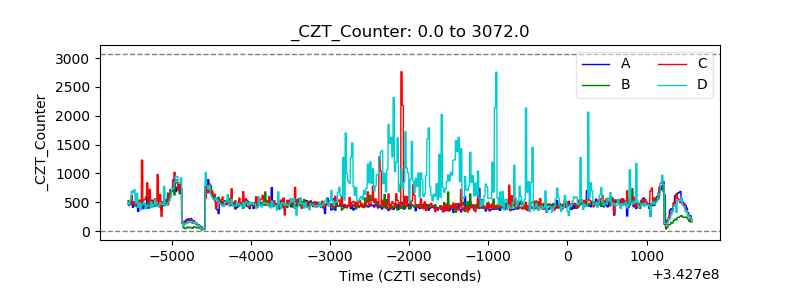 |
| +2.5 Volts monitor | 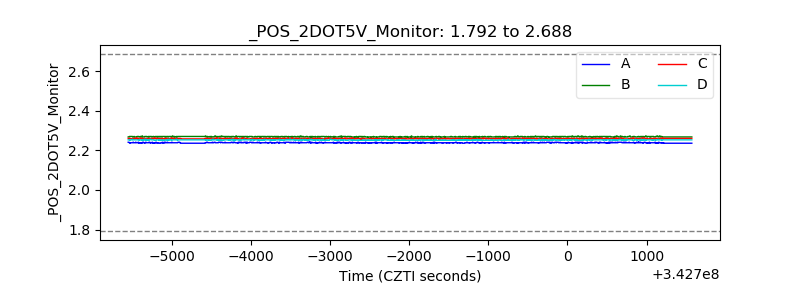 |
| +5 Volts monitor |  |
| _ROLL_ROT | 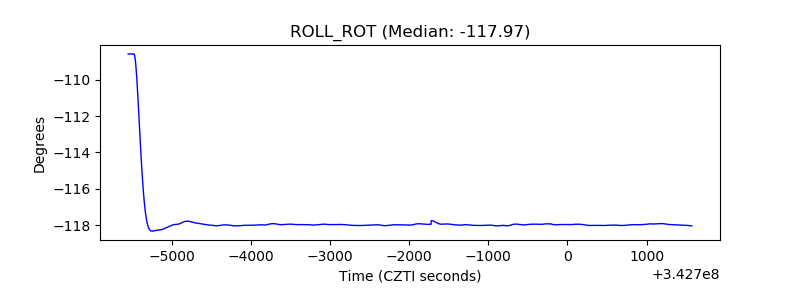 |
| _Roll_DEC | 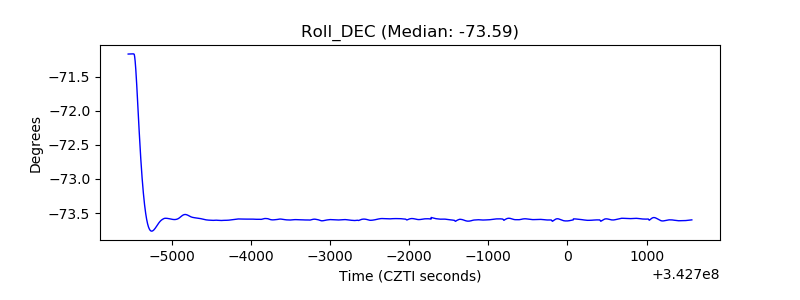 |
| _Roll_RA | 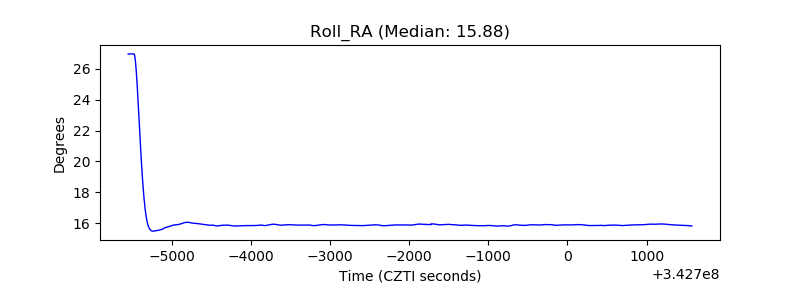 |
| Veto Counter | 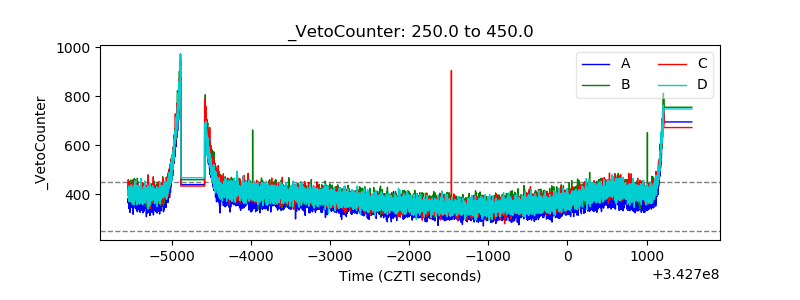 |