| Param | Original file | Final file |
|---|---|---|
| Filename | modeM0/AS1A09_038T37_9000003980cztM0_level2.fits | modeM0/AS1A09_038T37_9000003980cztM0_level2_quad_clean.evt |
| Size (bytes) | 45,731,520 | 44,395,200 |
| Size | 43.6 MB | 42.3 MB |
| Events in quadrant A | 274,886 | 263,161 |
| Events in quadrant B | 265,072 | 264,042 |
| Events in quadrant C | 265,266 | 247,887 |
| Events in quadrant D | 230,394 | 219,009 |
| Mode M0 | |||
|---|---|---|---|
| Quadrant | BADHDUFLAG | Total packets | Discarded packets |
| A | 0 | 10030 | 0 |
| B | 0 | 10156 | 0 |
| C | 0 | 10770 | 0 |
| D | 0 | 16030 | 0 |
| Mode SS | |||
|---|---|---|---|
| Quadrant | BADHDUFLAG | Total packets | Discarded packets |
| A | 0 | 100 | 0 |
| B | 0 | 100 | 0 |
| C | 0 | 100 | 0 |
| D | 0 | 100 | 0 |
| Quadrant | Total seconds | Saturated seconds | Saturation percentage |
|---|---|---|---|
| A | 4981 | 4 | 0.080305% |
| B | 4981 | 8 | 0.160610% |
| C | 4981 | 72 | 1.445493% |
| D | 4981 | 323 | 6.484642% |
Noise dominated data is calculated using 1-second bins in cleaned event files. If a bin has >2000 counts, and if more than 50% of those come from <1% of pixels, then it is considered to be noise-dominated and hence unusable.
| Quadrant | # 1 sec bins | Bins with >0 counts | Bins with >2000 counts | High rate bins dominated by noise | Noise dominated (total time) | Noise dominated (detector-on time) | Marked lightcurve |
|---|---|---|---|---|---|---|---|
| A | 4981 | 4981 | 0 | 0 | 0.00% | 0.00% |  |
| B | 4981 | 4981 | 0 | 0 | 0.00% | 0.00% |  |
| C | 4980 | 4979 | 0 | 0 | 0.00% | 0.00% |  |
| D | 4980 | 4979 | 0 | 0 | 0.00% | 0.00% |  |
Top three noisy pixels from each quadrant. If the there are fewer than three noisy pixels in the level2.evt file, extra rows are filled as -1
| Pixel properties | Quadrant properties | ||||||
|---|---|---|---|---|---|---|---|
| Quadrant | DetID | PixID | Counts | Sigma | Mean | Median | Sigma |
| A | 0 | 29 | 247 | 8.98 | 71 | 67 | 20.0 |
| A | 7 | 110 | 234 | 8.33 | 71 | 67 | 20.0 |
| A | 9 | 19 | 222 | 7.73 | 71 | 67 | 20.0 |
| B | 2 | 9 | 227 | 9.85 | 70 | 67 | 16.2 |
| B | 14 | 254 | 188 | 7.45 | 70 | 67 | 16.2 |
| B | 3 | 17 | 181 | 7.02 | 70 | 67 | 16.2 |
| C | 1 | 80 | 212 | 7.67 | 69 | 65 | 19.2 |
| C | 1 | 81 | 209 | 7.52 | 69 | 65 | 19.2 |
| C | 3 | 158 | 204 | 7.26 | 69 | 65 | 19.2 |
| D | 10 | 189 | 167 | 5.51 | 65 | 59 | 19.6 |
| D | 4 | 160 | 166 | 5.46 | 65 | 59 | 19.6 |
| D | 3 | 14 | 165 | 5.41 | 65 | 59 | 19.6 |
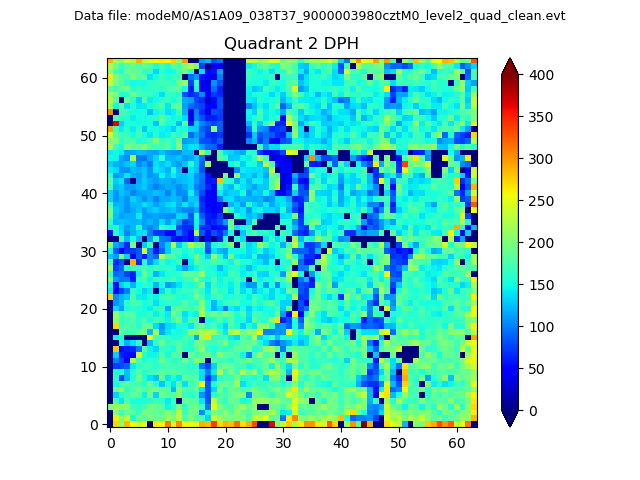
Histogram calculated using DETX and DETY for each event in the final _common_clean file
| Quadrant A |  |
 |
Quadrant B |
|---|---|---|---|
| Quadrant D |  |
 |
Quadrant C |
| Plot type | Count rate plots | Images |
|---|---|---|
| Comparison with Poisson distribution Blue bars denote a histogram of data divided into 1 sec bins. Red curve is a Poisson curve with rate = median count rate of data. |
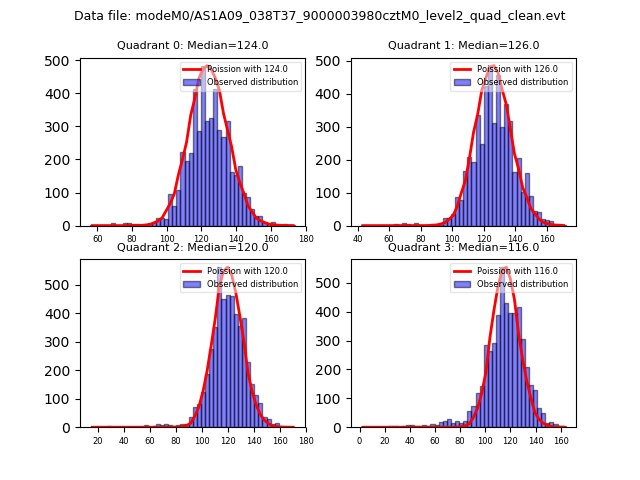 |
 |
| Quadrant-wise count rates Data is divided into 100 sec bins |
 |
|
| Module-wise count rates for Quadrant A Data is divided into 100 sec bins |
 |
 |
| Module-wise count rates for Quadrant B Data is divided into 100 sec bins |
 |
 |
| Module-wise count rates for Quadrant C Data is divided into 100 sec bins |
 |
 |
| Module-wise count rates for Quadrant D Data is divided into 100 sec bins |
 |
 |
| Parameter | Plot |
|---|---|
| CZT HV Monitor |  |
| D_VDD |  |
| Temperature 1 |  |
| Veto HV Monitor |  |
| Veto LLD |  |
| Alpha Counter |  |
| _CPM_Rate |  |
| CZT Counter |  |
| +2.5 Volts monitor |  |
| +5 Volts monitor |  |
| _ROLL_ROT | 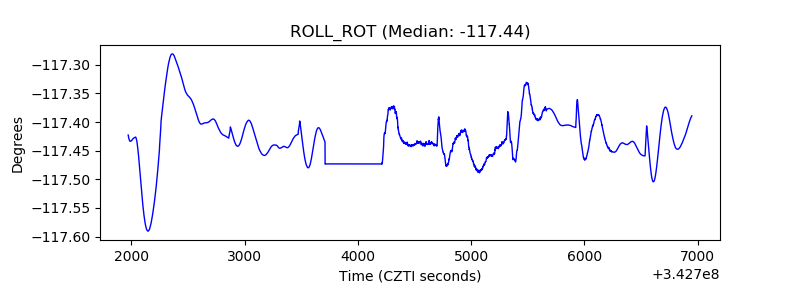 |
| _Roll_DEC | 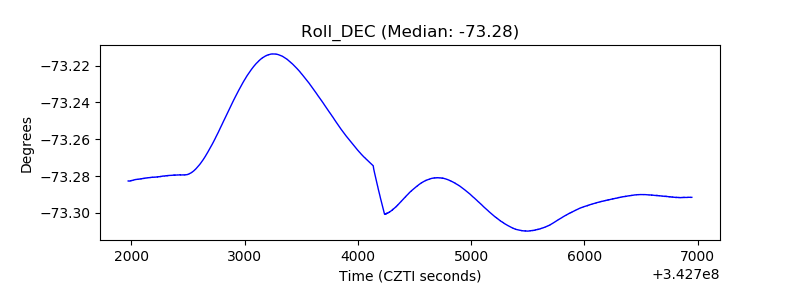 |
| _Roll_RA |  |
| Veto Counter | 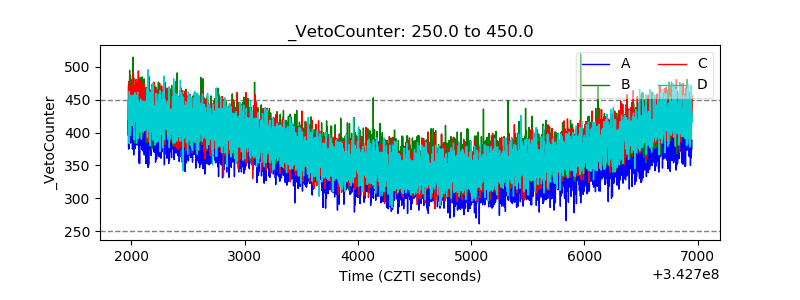 |