| Param | Original file | Final file |
|---|---|---|
| Filename | modeM0/AS1A09_038T37_9000003980_27685cztM0_level2.evt | modeM0/AS1A09_038T37_9000003980_27685cztM0_level2_quad_clean.evt |
| Size (bytes) | 385,824,960 | 91,261,440 |
| Size | 368.0 MB | 87.0 MB |
| Events in quadrant A | 2,230,483 | 618,488 |
| Events in quadrant B | 2,327,703 | 628,506 |
| Events in quadrant C | 2,529,417 | 595,565 |
| Events in quadrant D | 4,258,194 | 571,761 |
| Mode M0 | |||
|---|---|---|---|
| Quadrant | BADHDUFLAG | Total packets | Discarded packets |
| A | 0 | 10030 | 0 |
| B | 0 | 10156 | 0 |
| C | 0 | 10770 | 0 |
| D | 0 | 16030 | 0 |
| Quadrant | Total seconds | Saturated seconds | Saturation percentage |
|---|---|---|---|
| A | 4981 | 4 | 0.080305% |
| B | 4981 | 8 | 0.160610% |
| C | 4981 | 72 | 1.445493% |
| D | 4981 | 323 | 6.484642% |
Noise dominated data is calculated using 1-second bins in cleaned event files. If a bin has >2000 counts, and if more than 50% of those come from <1% of pixels, then it is considered to be noise-dominated and hence unusable.
| Quadrant | # 1 sec bins | Bins with >0 counts | Bins with >2000 counts | High rate bins dominated by noise | Noise dominated (total time) | Noise dominated (detector-on time) | Marked lightcurve |
|---|---|---|---|---|---|---|---|
| A | 4981 | 4981 | 2 | 2 | 0.04% | 0.04% | 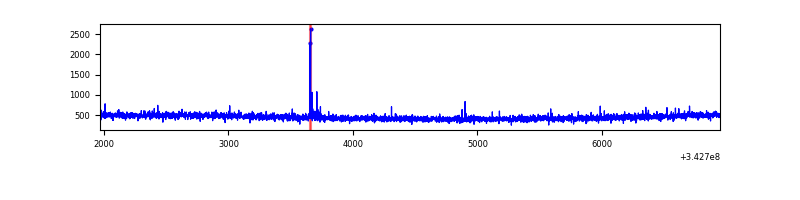 |
| B | 4981 | 4981 | 3 | 3 | 0.06% | 0.06% | 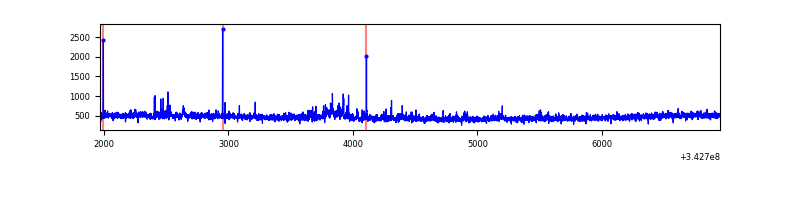 |
| C | 4981 | 4981 | 51 | 51 | 1.02% | 1.02% | 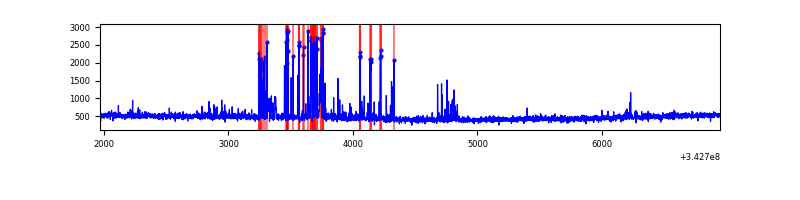 |
| D | 4981 | 4981 | 451 | 451 | 9.05% | 9.05% | 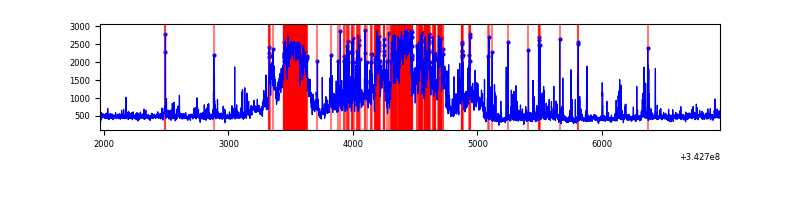 |
Top three noisy pixels from each quadrant. If the there are fewer than three noisy pixels in the level2.evt file, extra rows are filled as -1
| Pixel properties | Quadrant properties | ||||||
|---|---|---|---|---|---|---|---|
| Quadrant | DetID | PixID | Counts | Sigma | Mean | Median | Sigma |
| A | 13 | 248 | 14791 | 121.14 | 573 | 562 | 117.5 |
| A | 13 | 254 | 8605 | 68.48 | 573 | 562 | 117.5 |
| A | 3 | 137 | 5481 | 41.88 | 573 | 562 | 117.5 |
| B | 5 | 172 | 33330 | 297.33 | 570 | 554 | 110.2 |
| B | 0 | 230 | 32221 | 287.27 | 570 | 554 | 110.2 |
| B | 12 | 111 | 13056 | 113.41 | 570 | 554 | 110.2 |
| C | 8 | 208 | 280546 | 2172.32 | 544 | 545 | 128.9 |
| C | 14 | 238 | 88715 | 684.05 | 544 | 545 | 128.9 |
| C | 3 | 233 | 32665 | 249.2 | 544 | 545 | 128.9 |
| D | 12 | 2 | 1551310 | 11833.25 | 542 | 524 | 131.1 |
| D | 1 | 52 | 406620 | 3098.71 | 542 | 524 | 131.1 |
| D | 7 | 80 | 80800 | 612.54 | 542 | 524 | 131.1 |
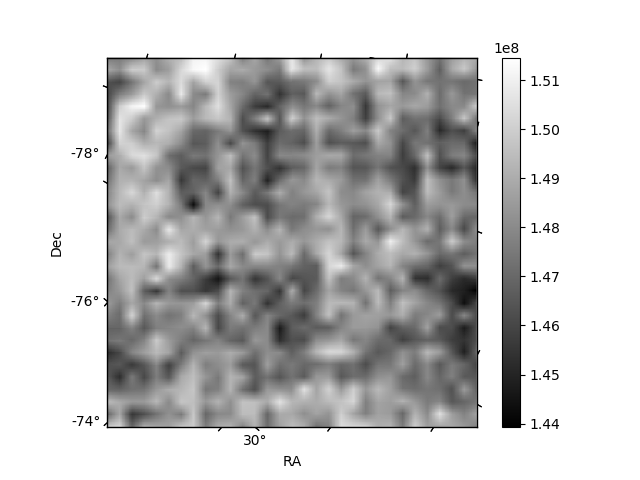
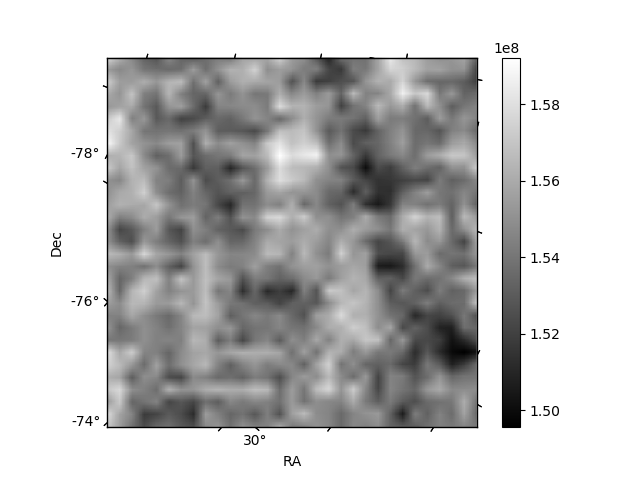
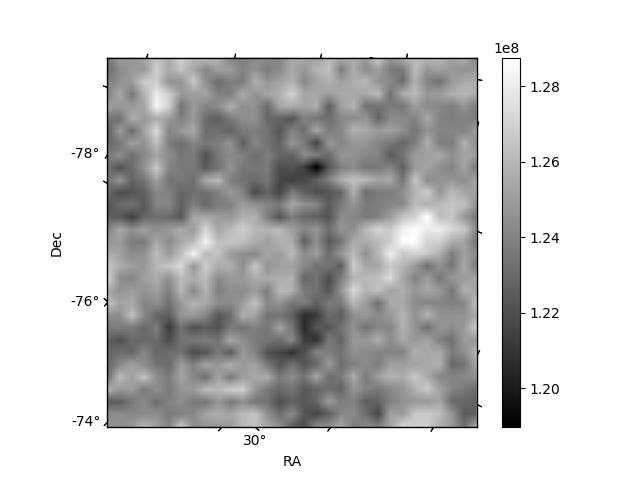
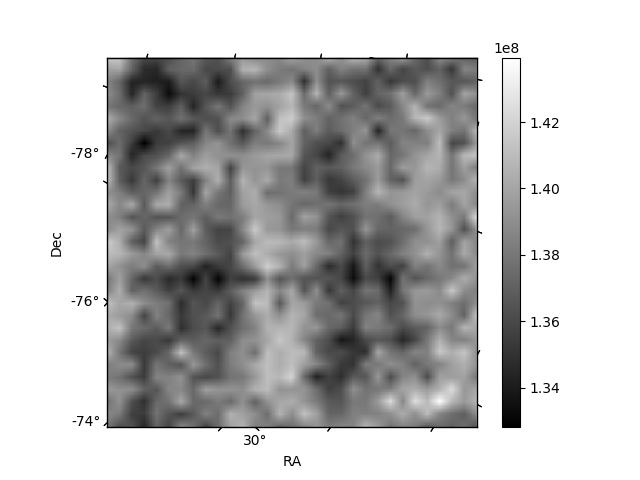
Histogram calculated using DETX and DETY for each event in the final _common_clean file
| Quadrant A | 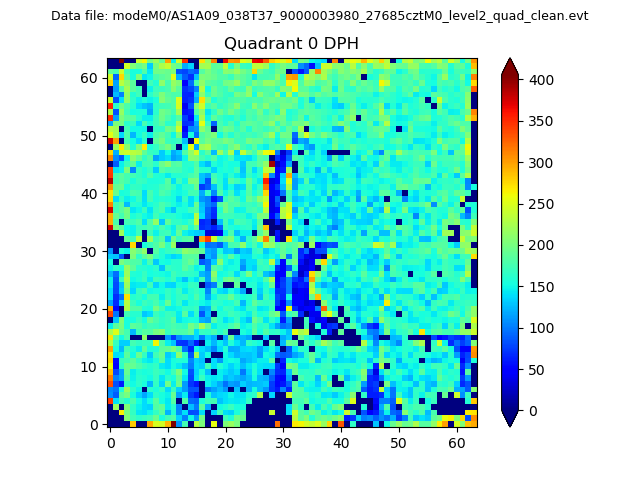 |
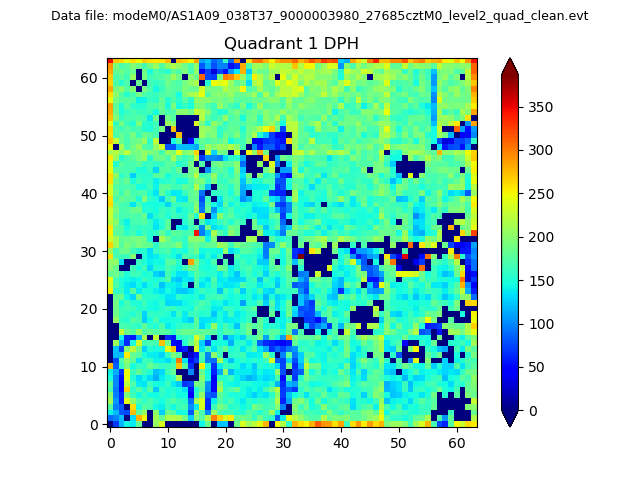 |
Quadrant B |
|---|---|---|---|
| Quadrant D | 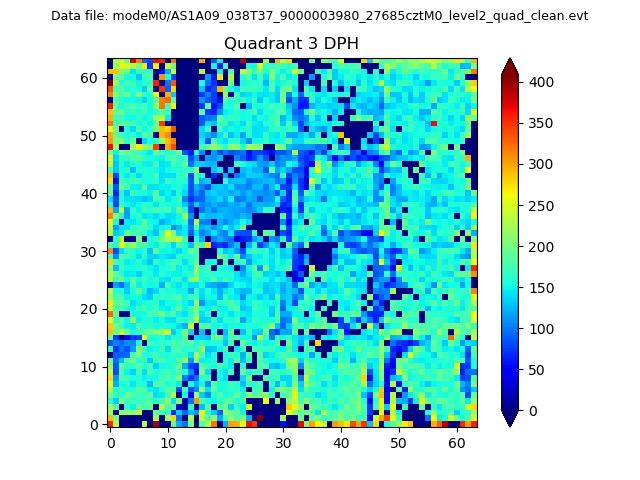 |
 |
Quadrant C |
| Plot type | Count rate plots | Images |
|---|---|---|
| Comparison with Poisson distribution Blue bars denote a histogram of data divided into 1 sec bins. Red curve is a Poisson curve with rate = median count rate of data. |
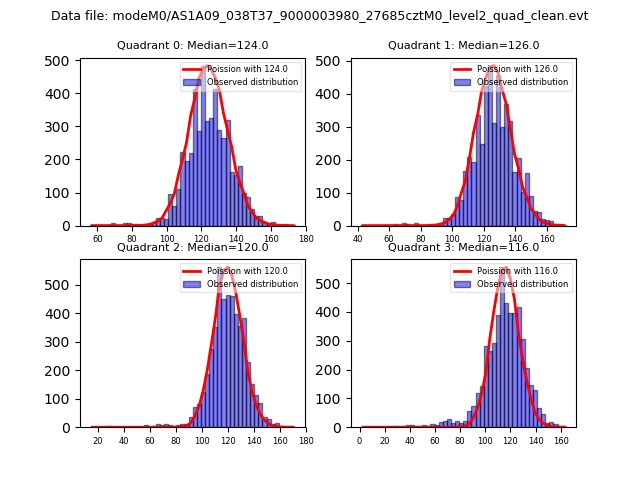 |
 |
| Quadrant-wise count rates Data is divided into 100 sec bins |
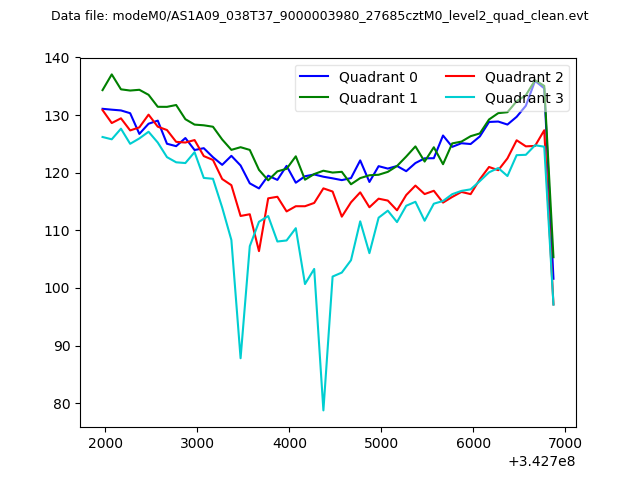 |
|
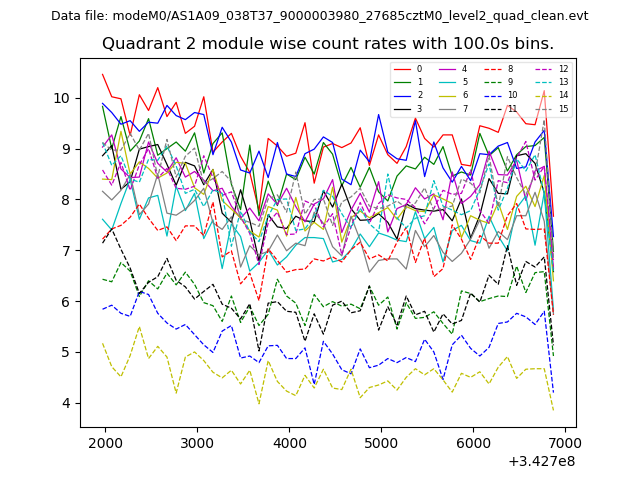
| Module-wise count rates for Quadrant A Data is divided into 100 sec bins |
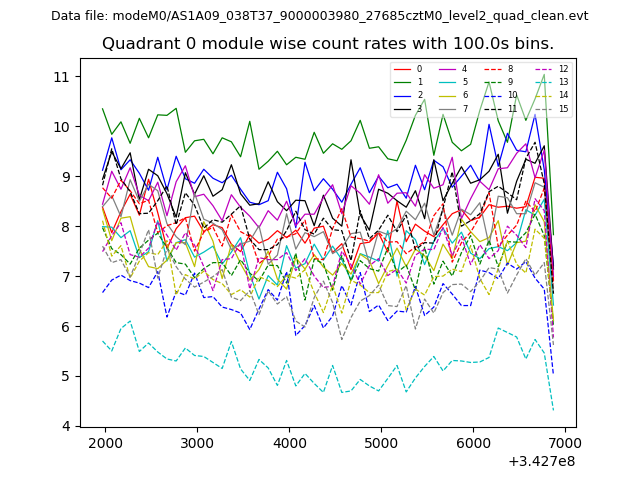 |
 |
| Module-wise count rates for Quadrant B Data is divided into 100 sec bins |
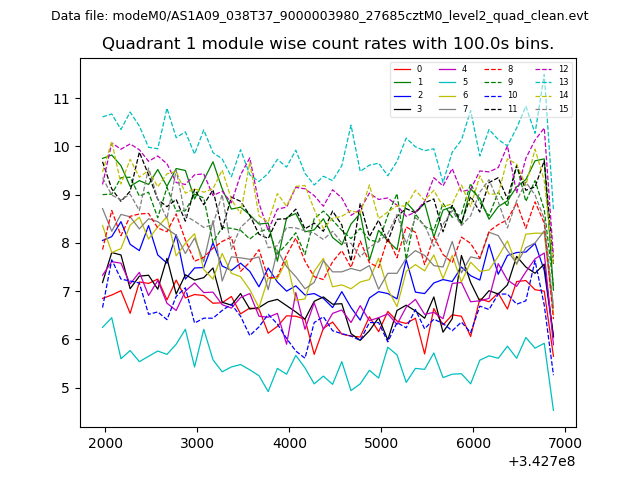 |
 |
| Module-wise count rates for Quadrant C Data is divided into 100 sec bins |
 |
 |
| Module-wise count rates for Quadrant D Data is divided into 100 sec bins |
 |
 |
| Parameter | Plot |
|---|---|
| CZT HV Monitor | 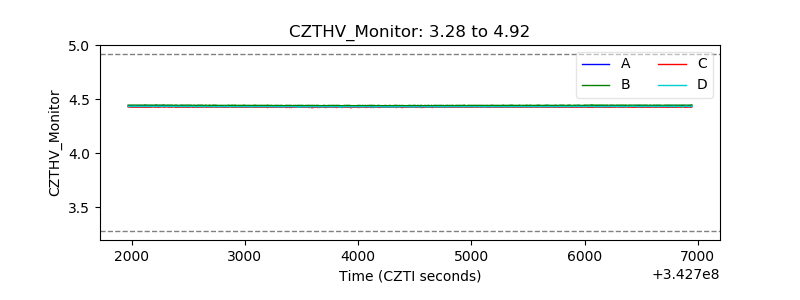 |
| D_VDD | 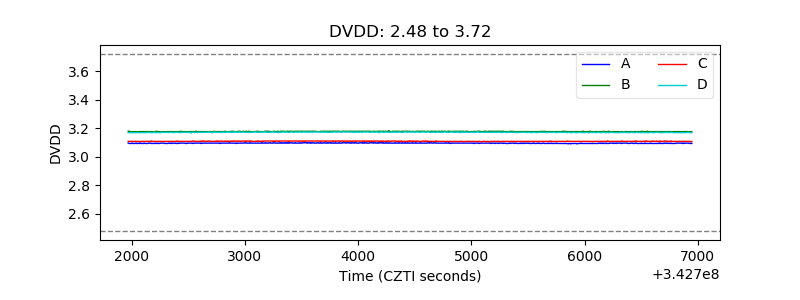 |
| Temperature 1 |  |
| Veto HV Monitor | 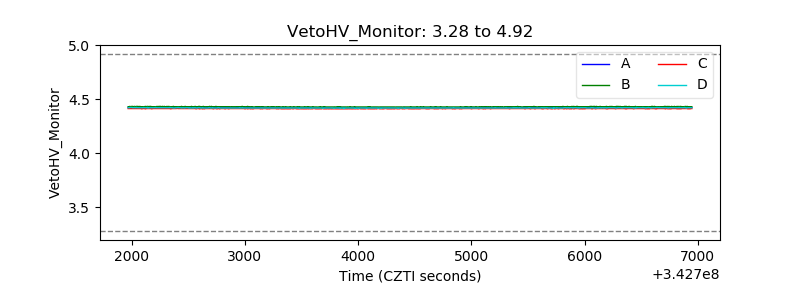 |
| Veto LLD | 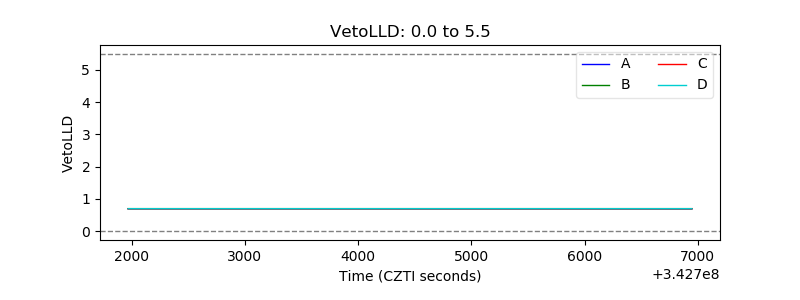 |
| Alpha Counter | 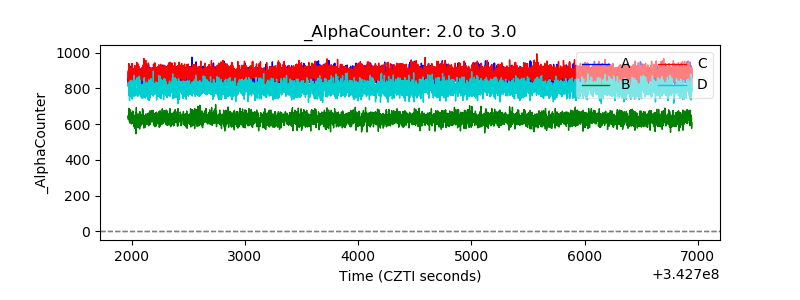 |
| _CPM_Rate | 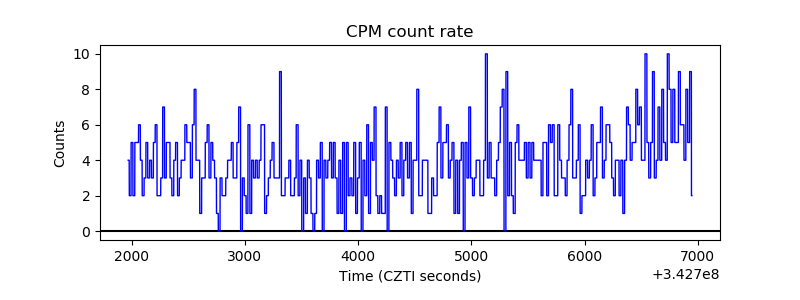 |
| CZT Counter |  |
| +2.5 Volts monitor |  |
| +5 Volts monitor |  |
| _ROLL_ROT |  |
| _Roll_DEC |  |
| _Roll_RA |  |
| Veto Counter |  |