| Param | Original file | Final file |
|---|---|---|
| Filename | modeM0/AS1A09_038T38_9000003982cztM0_level2.fits | modeM0/AS1A09_038T38_9000003982cztM0_level2_quad_clean.evt |
| Size (bytes) | 48,971,520 | 48,548,160 |
| Size | 46.7 MB | 46.3 MB |
| Events in quadrant A | 298,724 | 290,952 |
| Events in quadrant B | 287,982 | 291,730 |
| Events in quadrant C | 289,616 | 270,960 |
| Events in quadrant D | 238,446 | 247,544 |
| Mode SS | |||
|---|---|---|---|
| Quadrant | BADHDUFLAG | Total packets | Discarded packets |
| A | 0 | 106 | 0 |
| B | 0 | 106 | 0 |
| C | 0 | 106 | 0 |
| D | 0 | 106 | 0 |
| Mode M0 | |||
|---|---|---|---|
| Quadrant | BADHDUFLAG | Total packets | Discarded packets |
| A | 0 | 11153 | 0 |
| B | 0 | 10808 | 0 |
| C | 0 | 10719 | 0 |
| D | 0 | 20202 | 0 |
| Mode M9 | |||
|---|---|---|---|
| Quadrant | BADHDUFLAG | Total packets | Discarded packets |
| A | 0 | 8 | 0 |
| B | 0 | 8 | 0 |
| C | 0 | 8 | 0 |
| D | 0 | 8 | 0 |
| Quadrant | Total seconds | Saturated seconds | Saturation percentage |
|---|---|---|---|
| A | 5261 | 98 | 1.862764% |
| B | 5261 | 71 | 1.349553% |
| C | 5261 | 91 | 1.729709% |
| D | 5261 | 769 | 14.616993% |
Noise dominated data is calculated using 1-second bins in cleaned event files. If a bin has >2000 counts, and if more than 50% of those come from <1% of pixels, then it is considered to be noise-dominated and hence unusable.
| Quadrant | # 1 sec bins | Bins with >0 counts | Bins with >2000 counts | High rate bins dominated by noise | Noise dominated (total time) | Noise dominated (detector-on time) | Marked lightcurve |
|---|---|---|---|---|---|---|---|
| A | 5981 | 5259 | 0 | 0 | 0.00% | 0.00% |  |
| B | 5981 | 5260 | 0 | 0 | 0.00% | 0.00% |  |
| C | 5981 | 5260 | 0 | 0 | 0.00% | 0.00% |  |
| D | 5981 | 5251 | 0 | 0 | 0.00% | 0.00% |  |
Top three noisy pixels from each quadrant. If the there are fewer than three noisy pixels in the level2.evt file, extra rows are filled as -1
| Pixel properties | Quadrant properties | ||||||
|---|---|---|---|---|---|---|---|
| Quadrant | DetID | PixID | Counts | Sigma | Mean | Median | Sigma |
| A | 14 | 188 | 329 | 12.14 | 77 | 73 | 21.1 |
| A | 0 | 29 | 279 | 9.77 | 77 | 73 | 21.1 |
| A | 14 | 204 | 267 | 9.2 | 77 | 73 | 21.1 |
| B | 2 | 9 | 259 | 10.76 | 76 | 73 | 17.3 |
| B | 2 | 8 | 210 | 7.92 | 76 | 73 | 17.3 |
| B | 5 | 128 | 204 | 7.58 | 76 | 73 | 17.3 |
| C | 1 | 80 | 225 | 7.41 | 76 | 71 | 20.8 |
| C | 12 | 241 | 213 | 6.83 | 76 | 71 | 20.8 |
| C | 1 | 81 | 203 | 6.35 | 76 | 71 | 20.8 |
| D | 4 | 246 | 219 | 8.02 | 67 | 61 | 19.7 |
| D | 6 | 231 | 197 | 6.91 | 67 | 61 | 19.7 |
| D | 3 | 14 | 182 | 6.15 | 67 | 61 | 19.7 |
Histogram calculated using DETX and DETY for each event in the final _common_clean file
| Quadrant A | 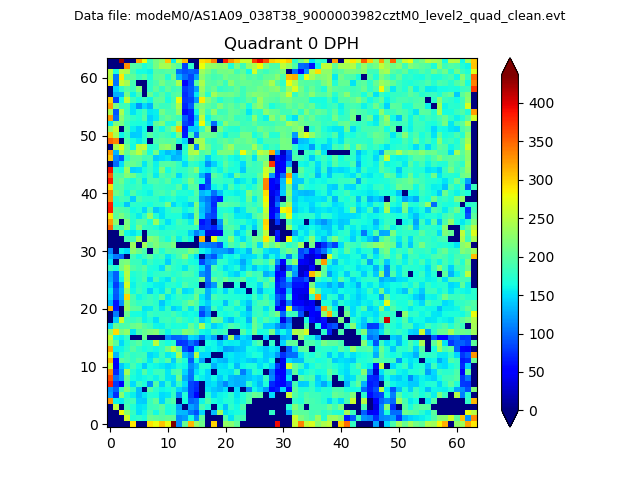 |
 |
Quadrant B |
|---|---|---|---|
| Quadrant D |  |
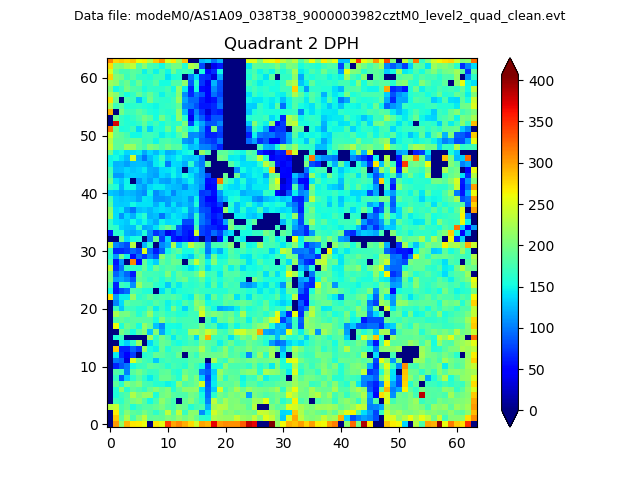 |
Quadrant C |
| Plot type | Count rate plots | Images |
|---|---|---|
| Comparison with Poisson distribution Blue bars denote a histogram of data divided into 1 sec bins. Red curve is a Poisson curve with rate = median count rate of data. |
 |
 |
| Quadrant-wise count rates Data is divided into 100 sec bins |
 |
|
| Module-wise count rates for Quadrant A Data is divided into 100 sec bins |
 |
 |
| Module-wise count rates for Quadrant B Data is divided into 100 sec bins |
 |
 |
| Module-wise count rates for Quadrant C Data is divided into 100 sec bins |
 |
 |
| Module-wise count rates for Quadrant D Data is divided into 100 sec bins |
 |
 |
| Parameter | Plot |
|---|---|
| CZT HV Monitor |  |
| D_VDD |  |
| Temperature 1 |  |
| Veto HV Monitor |  |
| Veto LLD |  |
| Alpha Counter |  |
| _CPM_Rate |  |
| CZT Counter |  |
| +2.5 Volts monitor |  |
| +5 Volts monitor |  |
| _ROLL_ROT |  |
| _Roll_DEC |  |
| _Roll_RA |  |
| Veto Counter |  |