| Param | Original file | Final file |
|---|---|---|
| Filename | modeM0/AS1A09_038T39_9000003984cztM0_level2.fits | modeM0/AS1A09_038T39_9000003984cztM0_level2_quad_clean.evt |
| Size (bytes) | 39,519,360 | 34,879,680 |
| Size | 37.7 MB | 33.3 MB |
| Events in quadrant A | 243,802 | 203,503 |
| Events in quadrant B | 232,108 | 201,641 |
| Events in quadrant C | 232,668 | 186,423 |
| Events in quadrant D | 195,450 | 170,774 |
| Mode M9 | |||
|---|---|---|---|
| Quadrant | BADHDUFLAG | Total packets | Discarded packets |
| A | 0 | 9 | 0 |
| B | 0 | 9 | 0 |
| C | 0 | 9 | 0 |
| D | 0 | 9 | 0 |
| Mode M0 | |||
|---|---|---|---|
| Quadrant | BADHDUFLAG | Total packets | Discarded packets |
| A | 0 | 8700 | 0 |
| B | 0 | 9336 | 0 |
| C | 0 | 8589 | 0 |
| D | 0 | 14367 | 0 |
| Mode SS | |||
|---|---|---|---|
| Quadrant | BADHDUFLAG | Total packets | Discarded packets |
| A | 0 | 84 | 0 |
| B | 0 | 84 | 0 |
| C | 0 | 84 | 0 |
| D | 0 | 84 | 0 |
| Quadrant | Total seconds | Saturated seconds | Saturation percentage |
|---|---|---|---|
| A | 4162 | 27 | 0.648727% |
| B | 4162 | 58 | 1.393561% |
| C | 4162 | 32 | 0.768861% |
| D | 4162 | 305 | 7.328208% |
Noise dominated data is calculated using 1-second bins in cleaned event files. If a bin has >2000 counts, and if more than 50% of those come from <1% of pixels, then it is considered to be noise-dominated and hence unusable.
| Quadrant | # 1 sec bins | Bins with >0 counts | Bins with >2000 counts | High rate bins dominated by noise | Noise dominated (total time) | Noise dominated (detector-on time) | Marked lightcurve |
|---|---|---|---|---|---|---|---|
| A | 4160 | 4160 | 0 | 0 | 0.00% | 0.00% |  |
| B | 4160 | 4160 | 0 | 0 | 0.00% | 0.00% |  |
| C | 4161 | 4161 | 0 | 0 | 0.00% | 0.00% |  |
| D | 4161 | 4155 | 0 | 0 | 0.00% | 0.00% |  |
Top three noisy pixels from each quadrant. If the there are fewer than three noisy pixels in the level2.evt file, extra rows are filled as -1
| Pixel properties | Quadrant properties | ||||||
|---|---|---|---|---|---|---|---|
| Quadrant | DetID | PixID | Counts | Sigma | Mean | Median | Sigma |
| A | 14 | 188 | 249 | 10.66 | 63 | 59 | 17.8 |
| A | 0 | 29 | 241 | 10.21 | 63 | 59 | 17.8 |
| A | 7 | 110 | 206 | 8.24 | 63 | 59 | 17.8 |
| B | 2 | 9 | 187 | 8.99 | 61 | 59 | 14.2 |
| B | 5 | 128 | 163 | 7.3 | 61 | 59 | 14.2 |
| B | 3 | 17 | 161 | 7.16 | 61 | 59 | 14.2 |
| C | 1 | 81 | 211 | 8.54 | 61 | 58 | 17.9 |
| C | 1 | 80 | 191 | 7.42 | 61 | 58 | 17.9 |
| C | 3 | 126 | 174 | 6.47 | 61 | 58 | 17.9 |
| D | 15 | 46 | 163 | 6.96 | 55 | 50 | 16.2 |
| D | 6 | 83 | 157 | 6.59 | 55 | 50 | 16.2 |
| D | 15 | 30 | 156 | 6.52 | 55 | 50 | 16.2 |
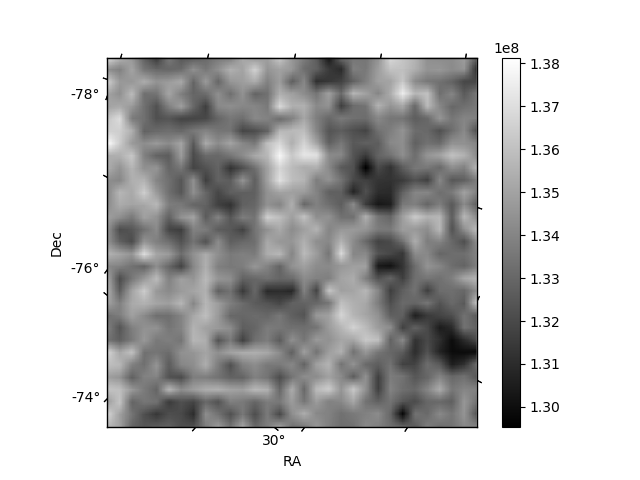
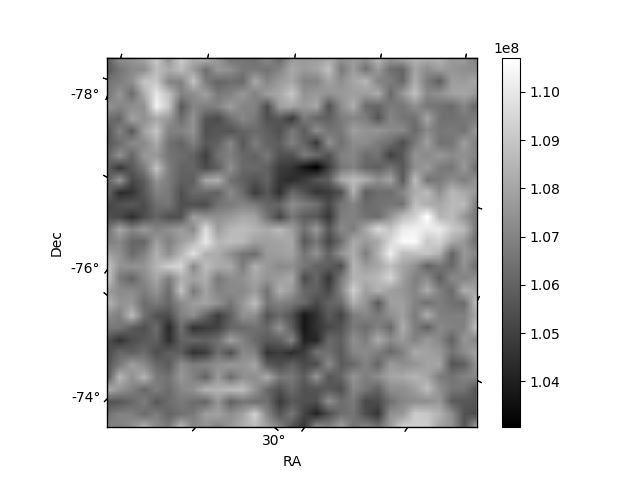
Histogram calculated using DETX and DETY for each event in the final _common_clean file
| Quadrant A | 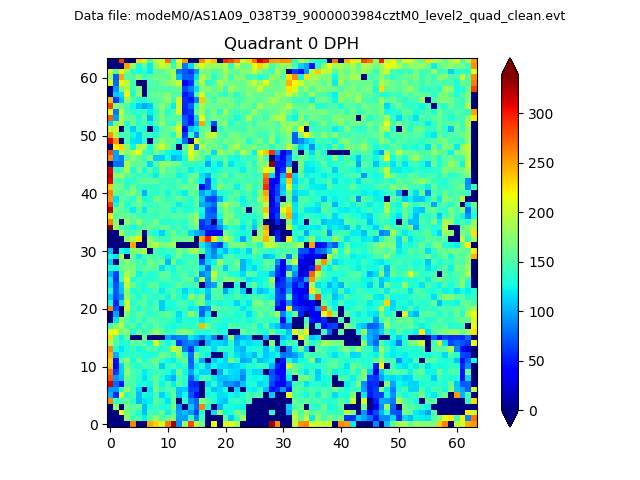 |
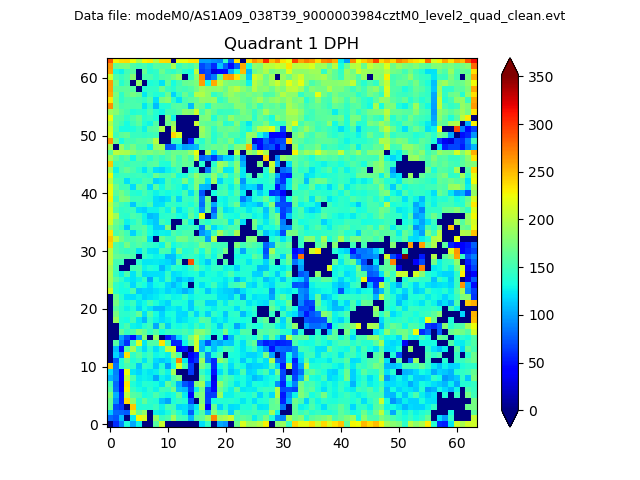 |
Quadrant B |
|---|---|---|---|
| Quadrant D |  |
 |
Quadrant C |
| Plot type | Count rate plots | Images |
|---|---|---|
| Comparison with Poisson distribution Blue bars denote a histogram of data divided into 1 sec bins. Red curve is a Poisson curve with rate = median count rate of data. |
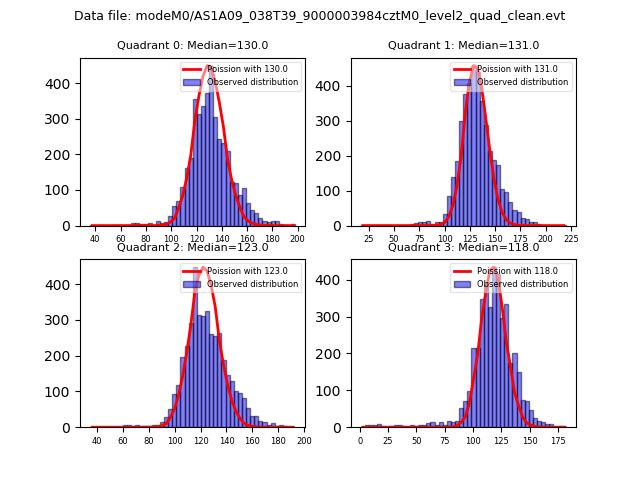 |
 |
| Quadrant-wise count rates Data is divided into 100 sec bins |
 |
|
| Module-wise count rates for Quadrant A Data is divided into 100 sec bins |
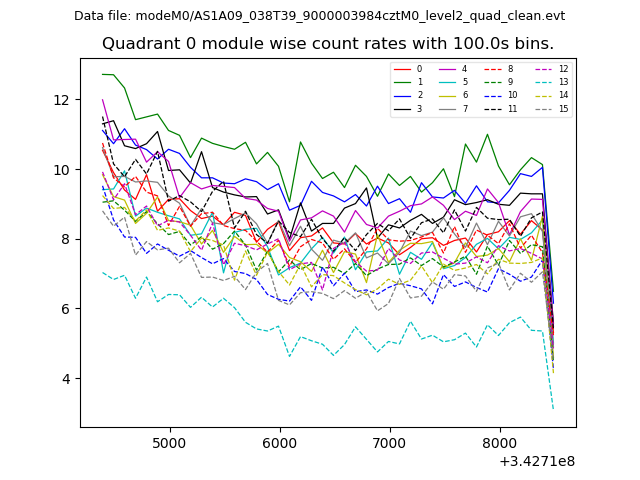 |
 |
| Module-wise count rates for Quadrant B Data is divided into 100 sec bins |
 |
 |
| Module-wise count rates for Quadrant C Data is divided into 100 sec bins |
 |
 |
| Module-wise count rates for Quadrant D Data is divided into 100 sec bins |
 |
 |
| Parameter | Plot |
|---|---|
| CZT HV Monitor |  |
| D_VDD |  |
| Temperature 1 |  |
| Veto HV Monitor | 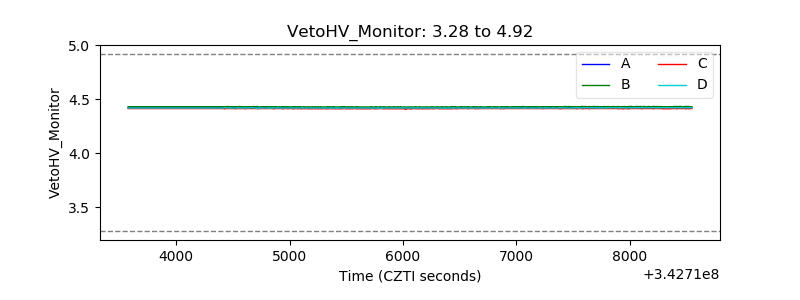 |
| Veto LLD | 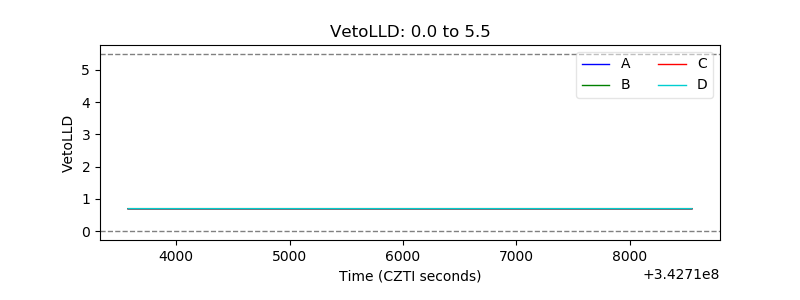 |
| Alpha Counter | 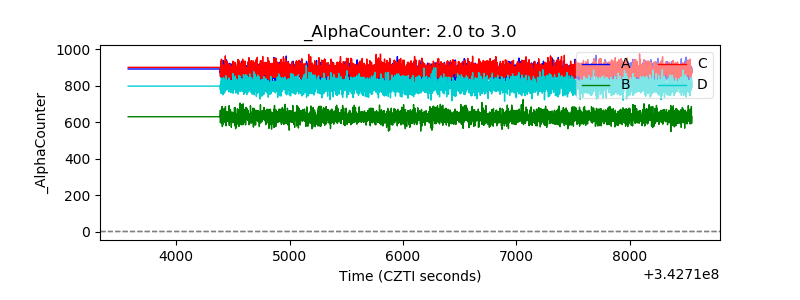 |
| _CPM_Rate |  |
| CZT Counter |  |
| +2.5 Volts monitor |  |
| +5 Volts monitor |  |
| _ROLL_ROT |  |
| _Roll_DEC |  |
| _Roll_RA |  |
| Veto Counter | 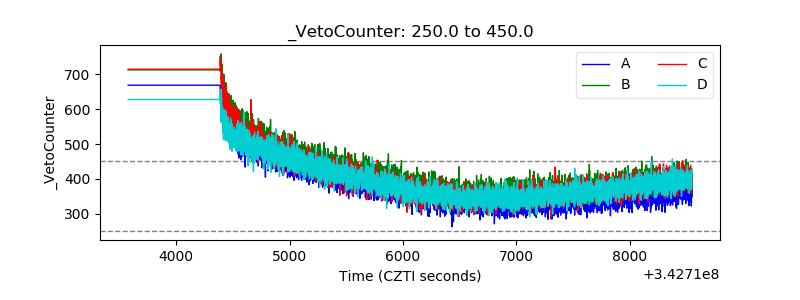 |