| Param | Original file | Final file |
|---|---|---|
| Filename | modeM0/AS1A09_038T39_9000003984_27685cztM0_level2.evt | modeM0/AS1A09_038T39_9000003984_27685cztM0_level2_quad_clean.evt |
| Size (bytes) | 146,802,240 | 30,968,640 |
| Size | 140.0 MB | 29.5 MB |
| Events in quadrant A | 810,172 | 213,814 |
| Events in quadrant B | 975,964 | 216,037 |
| Events in quadrant C | 793,489 | 206,262 |
| Events in quadrant D | 1,761,213 | 189,333 |
| Mode M9 | |||
|---|---|---|---|
| Quadrant | BADHDUFLAG | Total packets | Discarded packets |
| A | 0 | 9 | 0 |
| B | 0 | 9 | 0 |
| C | 0 | 9 | 0 |
| D | 0 | 9 | 0 |
| Mode M0 | |||
|---|---|---|---|
| Quadrant | BADHDUFLAG | Total packets | Discarded packets |
| A | 0 | 3292 | 0 |
| B | 0 | 3894 | 0 |
| C | 0 | 3266 | 0 |
| D | 0 | 6254 | 0 |
| Quadrant | Total seconds | Saturated seconds | Saturation percentage |
|---|---|---|---|
| A | 1512 | 12 | 0.793651% |
| B | 1512 | 47 | 3.108466% |
| C | 1512 | 18 | 1.190476% |
| D | 1512 | 232 | 15.343915% |
Noise dominated data is calculated using 1-second bins in cleaned event files. If a bin has >2000 counts, and if more than 50% of those come from <1% of pixels, then it is considered to be noise-dominated and hence unusable.
| Quadrant | # 1 sec bins | Bins with >0 counts | Bins with >2000 counts | High rate bins dominated by noise | Noise dominated (total time) | Noise dominated (detector-on time) | Marked lightcurve |
|---|---|---|---|---|---|---|---|
| A | 1512 | 1512 | 0 | 0 | 0.00% | 0.00% | 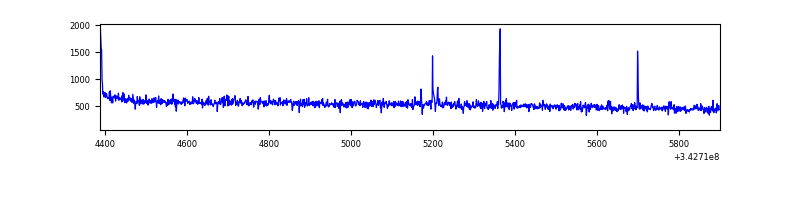 |
| B | 1512 | 1512 | 29 | 29 | 1.92% | 1.92% | 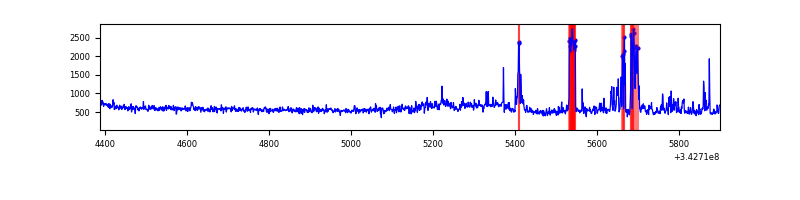 |
| C | 1512 | 1512 | 3 | 3 | 0.20% | 0.20% | 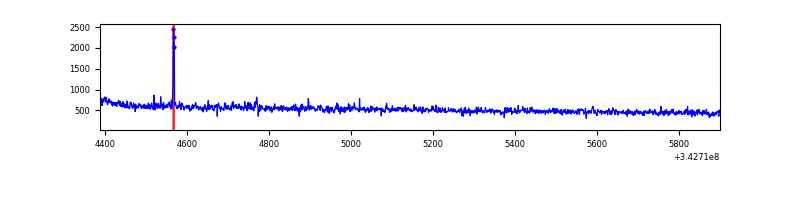 |
| D | 1512 | 1512 | 167 | 167 | 11.04% | 11.04% | 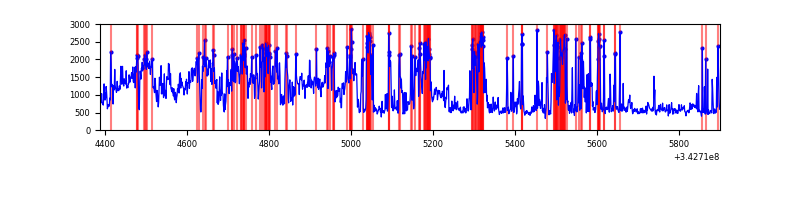 |
Top three noisy pixels from each quadrant. If the there are fewer than three noisy pixels in the level2.evt file, extra rows are filled as -1
| Pixel properties | Quadrant properties | ||||||
|---|---|---|---|---|---|---|---|
| Quadrant | DetID | PixID | Counts | Sigma | Mean | Median | Sigma |
| A | 13 | 248 | 13402 | 308.51 | 204 | 201 | 42.8 |
| A | 8 | 192 | 5585 | 125.83 | 204 | 201 | 42.8 |
| A | 13 | 254 | 2739 | 59.31 | 204 | 201 | 42.8 |
| B | 5 | 172 | 140803 | 3510.64 | 200 | 195 | 40.1 |
| B | 0 | 230 | 44839 | 1114.65 | 200 | 195 | 40.1 |
| B | 12 | 111 | 4367 | 104.16 | 200 | 195 | 40.1 |
| C | 14 | 238 | 30676 | 661.92 | 190 | 191 | 46.1 |
| C | 15 | 208 | 9779 | 208.18 | 190 | 191 | 46.1 |
| C | 3 | 233 | 7374 | 155.96 | 190 | 191 | 46.1 |
| D | 1 | 52 | 861499 | 18566.71 | 187 | 182 | 46.4 |
| D | 2 | 250 | 127193 | 2737.87 | 187 | 182 | 46.4 |
| D | 12 | 2 | 33333 | 714.61 | 187 | 182 | 46.4 |
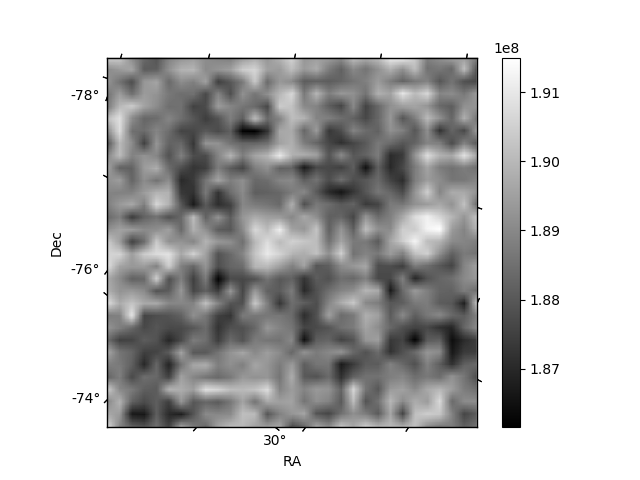
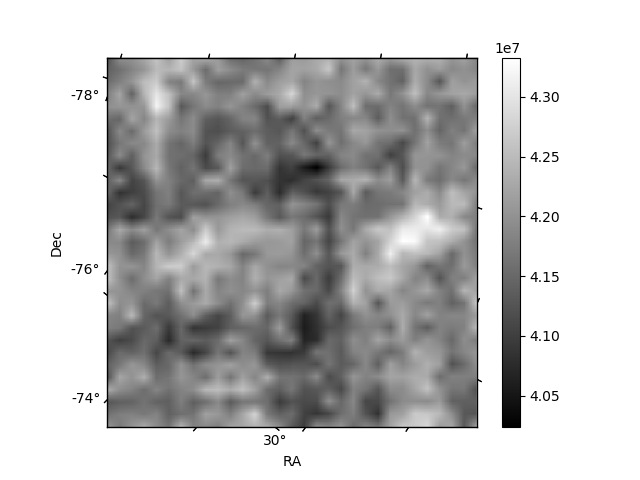
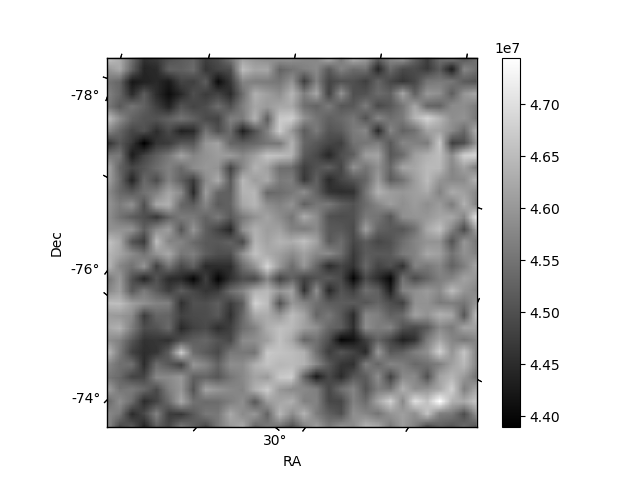
Histogram calculated using DETX and DETY for each event in the final _common_clean file
| Quadrant A | 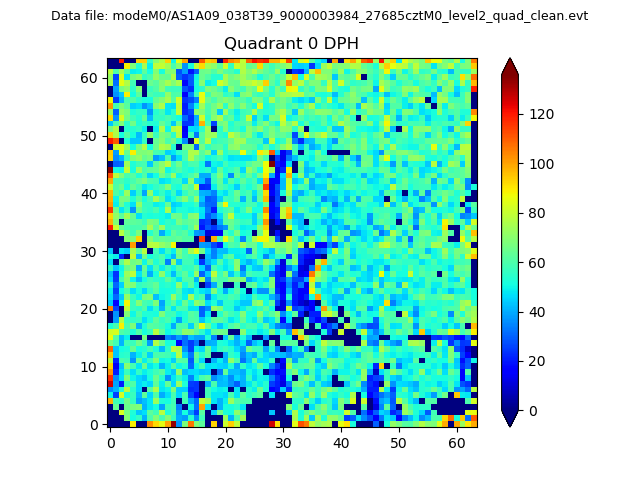 |
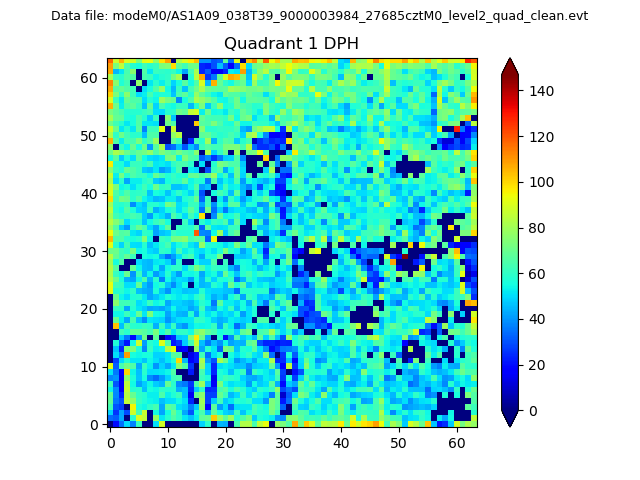 |
Quadrant B |
|---|---|---|---|
| Quadrant D | 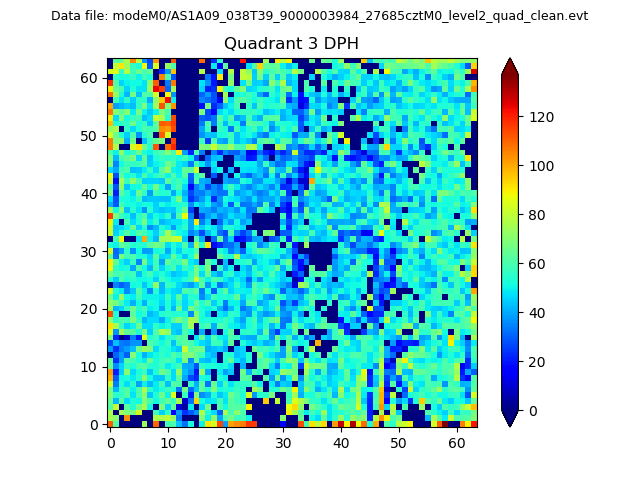 |
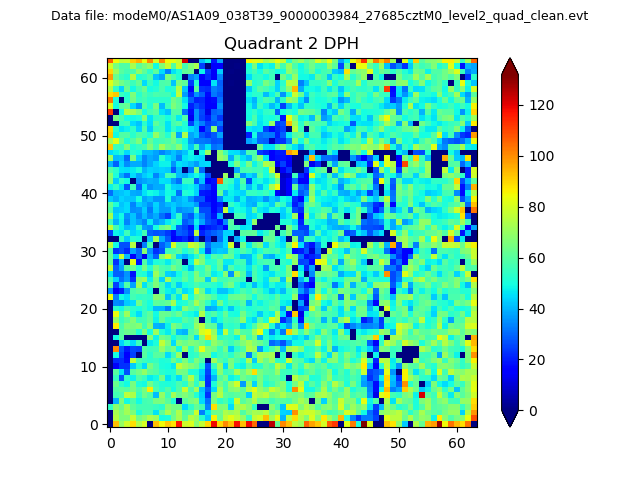 |
Quadrant C |
| Plot type | Count rate plots | Images |
|---|---|---|
| Comparison with Poisson distribution Blue bars denote a histogram of data divided into 1 sec bins. Red curve is a Poisson curve with rate = median count rate of data. |
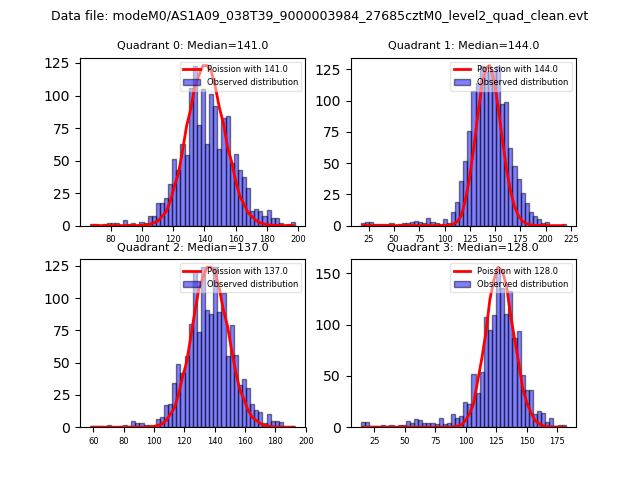 |
 |
| Quadrant-wise count rates Data is divided into 100 sec bins |
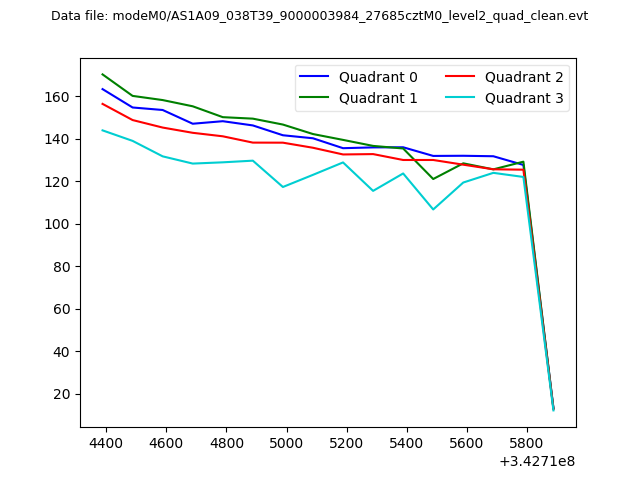 |
|
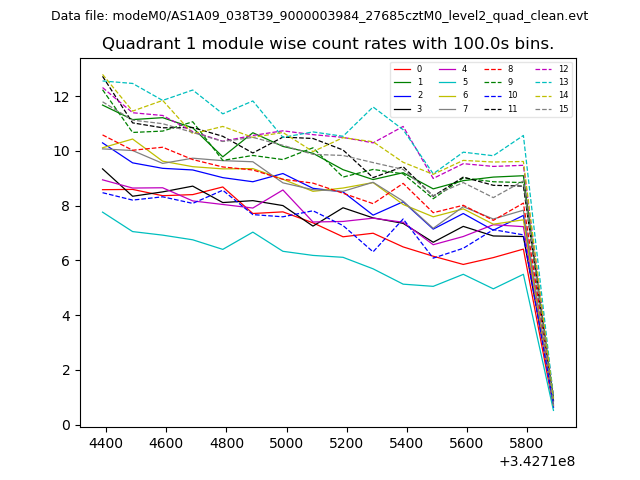
| Module-wise count rates for Quadrant A Data is divided into 100 sec bins |
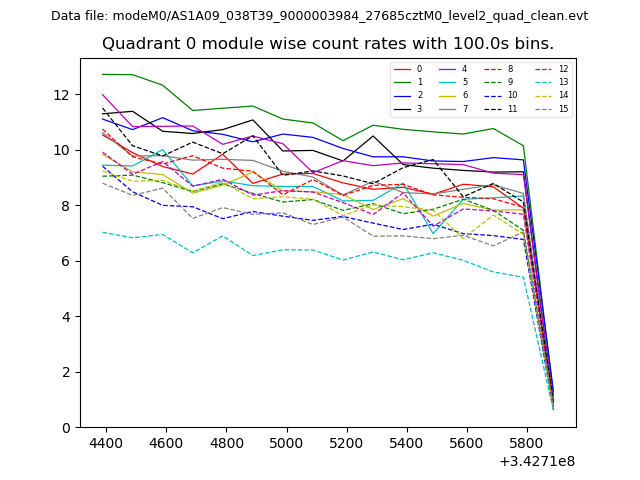 |
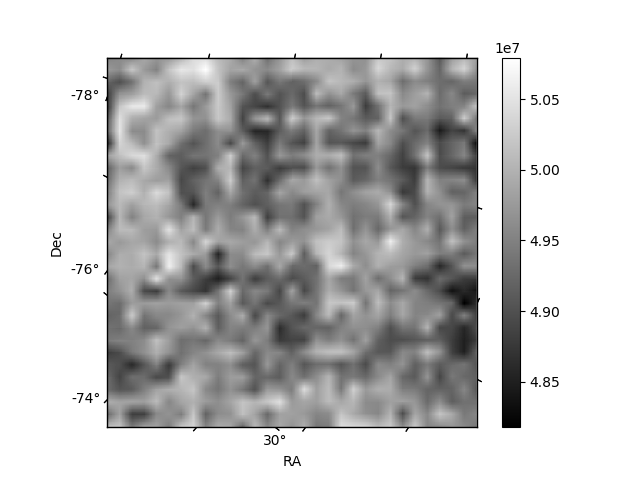 |
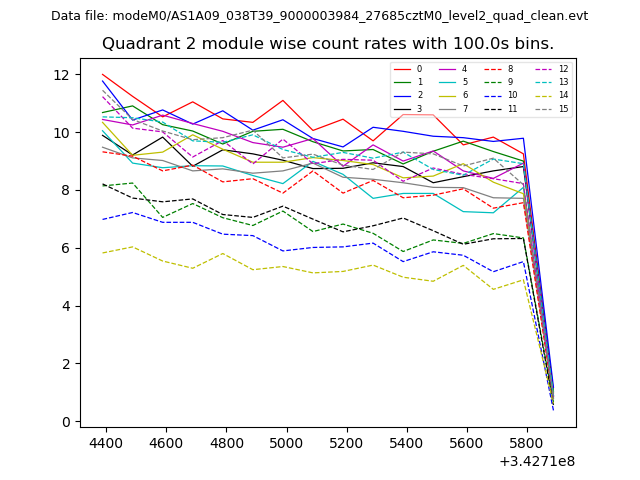
| Module-wise count rates for Quadrant B Data is divided into 100 sec bins |
 |
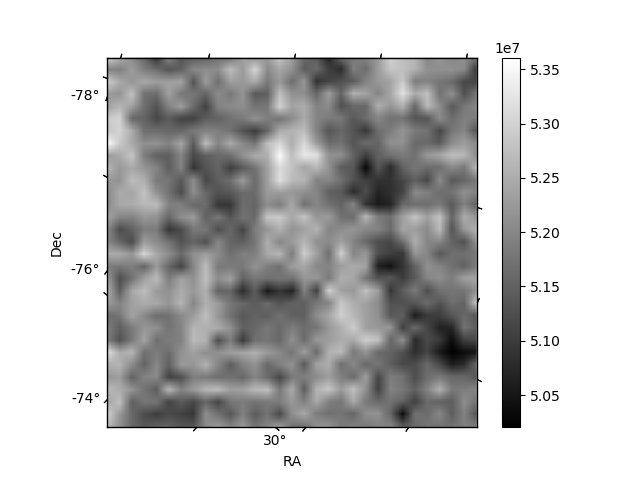 |
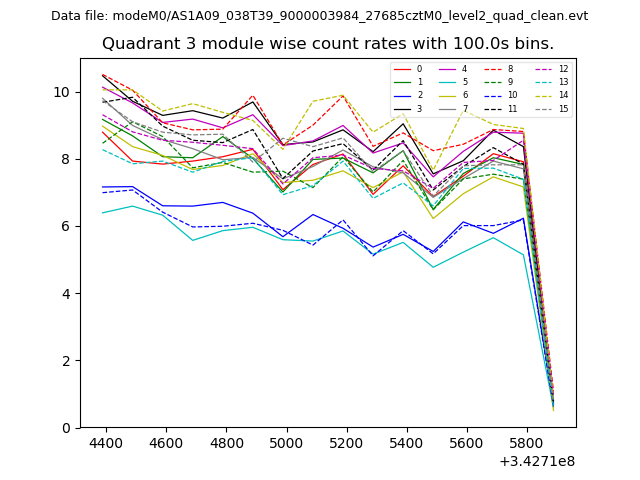
| Module-wise count rates for Quadrant C Data is divided into 100 sec bins |
 |
 |
| Module-wise count rates for Quadrant D Data is divided into 100 sec bins |
 |
 |
| Parameter | Plot |
|---|---|
| CZT HV Monitor | 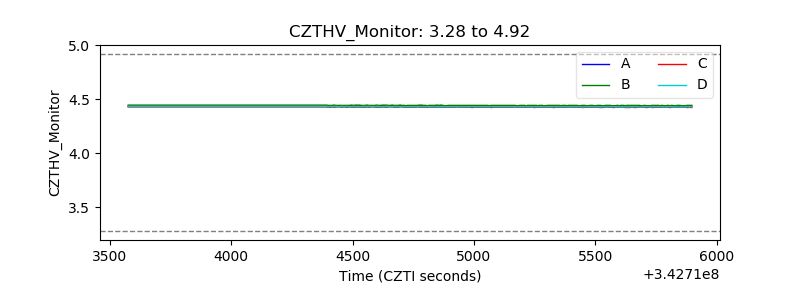 |
| D_VDD | 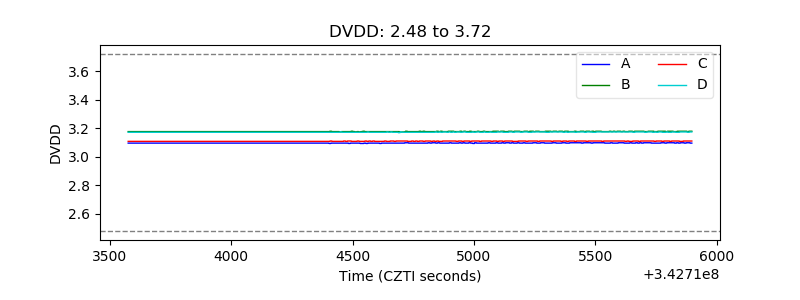 |
| Temperature 1 |  |
| Veto HV Monitor | 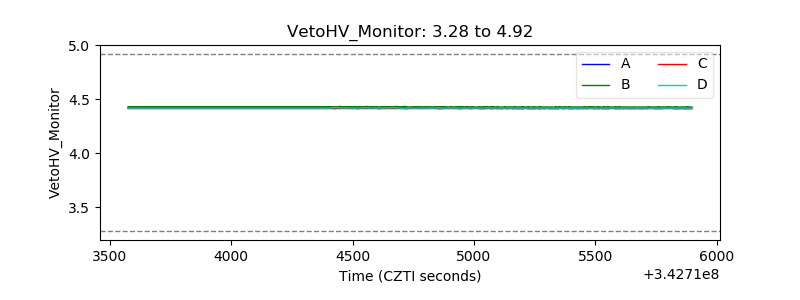 |
| Veto LLD | 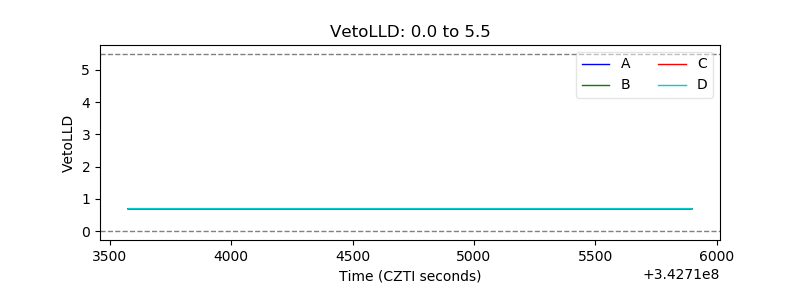 |
| Alpha Counter | 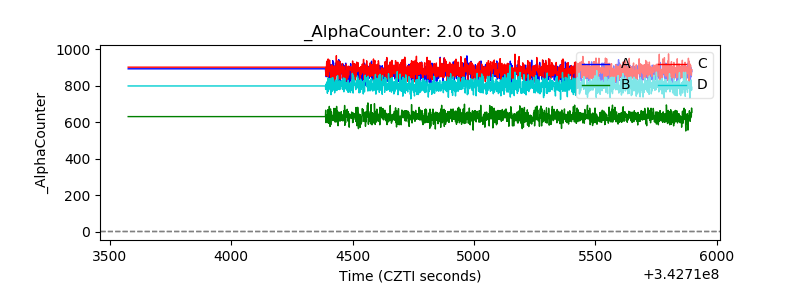 |
| _CPM_Rate | 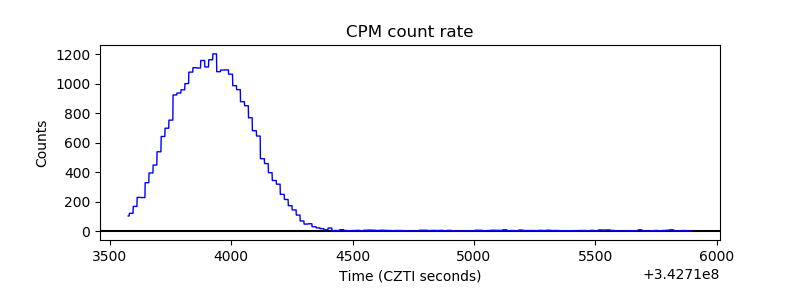 |
| CZT Counter | 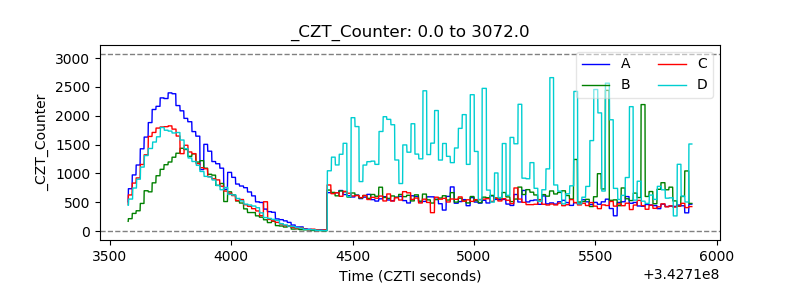 |
| +2.5 Volts monitor | 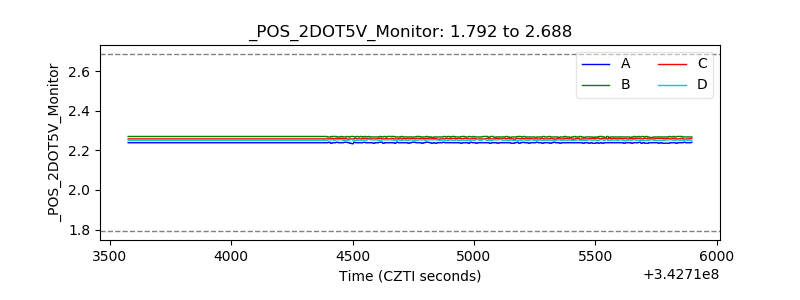 |
| +5 Volts monitor | 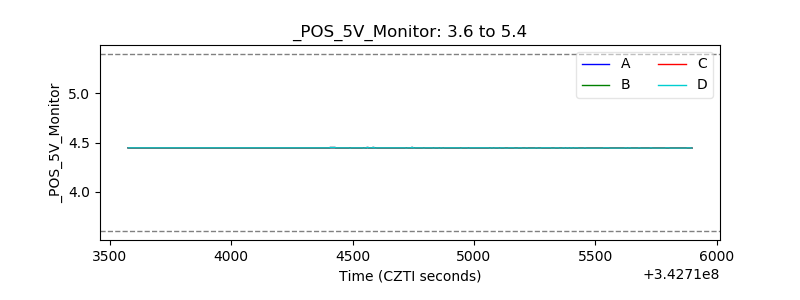 |
| _ROLL_ROT | 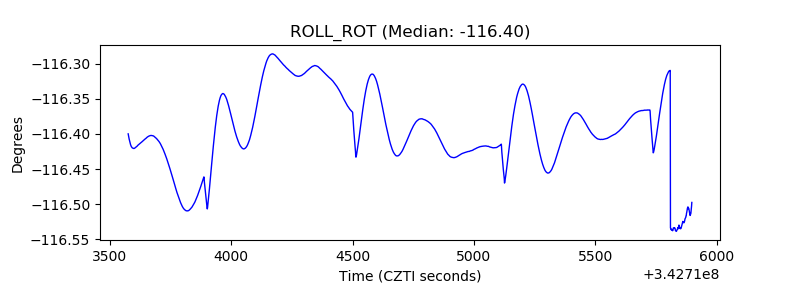 |
| _Roll_DEC | 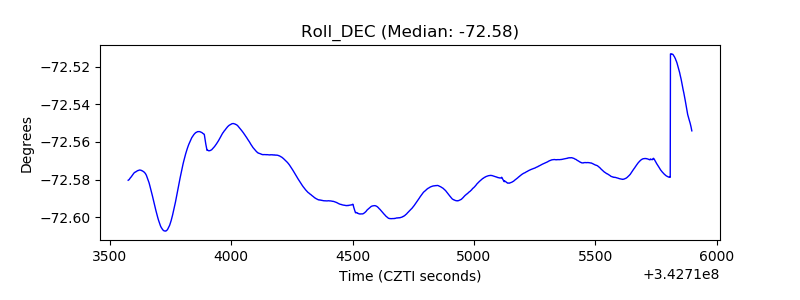 |
| _Roll_RA | 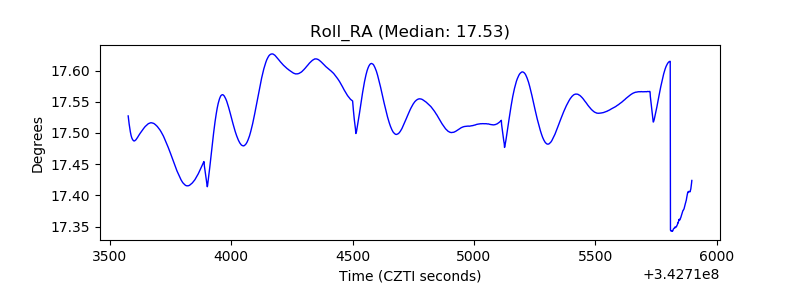 |
| Veto Counter | 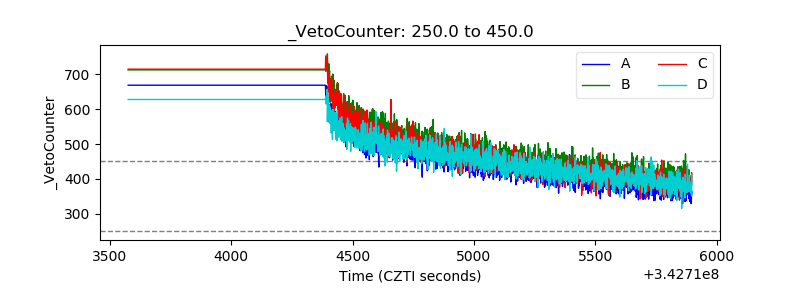 |