| Param | Original file | Final file |
|---|---|---|
| Filename | modeM0/AS1A09_038T39_9000003984_27686cztM0_level2.evt | modeM0/AS1A09_038T39_9000003984_27686cztM0_level2_quad_clean.evt |
| Size (bytes) | 305,847,360 | 72,881,280 |
| Size | 291.7 MB | 69.5 MB |
| Events in quadrant A | 1,772,518 | 501,389 |
| Events in quadrant B | 1,999,804 | 503,299 |
| Events in quadrant C | 1,731,525 | 476,361 |
| Events in quadrant D | 3,493,004 | 451,103 |
| Mode M0 | |||
|---|---|---|---|
| Quadrant | BADHDUFLAG | Total packets | Discarded packets |
| A | 0 | 8024 | 0 |
| B | 0 | 8639 | 0 |
| C | 0 | 7888 | 0 |
| D | 0 | 13074 | 0 |
| Quadrant | Total seconds | Saturated seconds | Saturation percentage |
|---|---|---|---|
| A | 3891 | 19 | 0.488306% |
| B | 3891 | 51 | 1.310717% |
| C | 3892 | 19 | 0.488181% |
| D | 3892 | 250 | 6.423433% |
Noise dominated data is calculated using 1-second bins in cleaned event files. If a bin has >2000 counts, and if more than 50% of those come from <1% of pixels, then it is considered to be noise-dominated and hence unusable.
| Quadrant | # 1 sec bins | Bins with >0 counts | Bins with >2000 counts | High rate bins dominated by noise | Noise dominated (total time) | Noise dominated (detector-on time) | Marked lightcurve |
|---|---|---|---|---|---|---|---|
| A | 3891 | 3891 | 14 | 14 | 0.36% | 0.36% |  |
| B | 3891 | 3891 | 31 | 31 | 0.80% | 0.80% |  |
| C | 3892 | 3892 | 1 | 1 | 0.03% | 0.03% |  |
| D | 3892 | 3892 | 260 | 260 | 6.68% | 6.68% |  |
Top three noisy pixels from each quadrant. If the there are fewer than three noisy pixels in the level2.evt file, extra rows are filled as -1
| Pixel properties | Quadrant properties | ||||||
|---|---|---|---|---|---|---|---|
| Quadrant | DetID | PixID | Counts | Sigma | Mean | Median | Sigma |
| A | 13 | 248 | 54151 | 587.48 | 445 | 437 | 91.4 |
| A | 13 | 254 | 7160 | 73.53 | 445 | 437 | 91.4 |
| A | 3 | 137 | 4089 | 39.94 | 445 | 437 | 91.4 |
| B | 5 | 172 | 162184 | 1900.9 | 443 | 433 | 85.1 |
| B | 0 | 230 | 57893 | 675.27 | 443 | 433 | 85.1 |
| B | 0 | 244 | 11916 | 134.95 | 443 | 433 | 85.1 |
| C | 14 | 238 | 68577 | 687.95 | 419 | 422 | 99.1 |
| C | 8 | 208 | 11340 | 110.21 | 419 | 422 | 99.1 |
| C | 15 | 208 | 9131 | 87.91 | 419 | 422 | 99.1 |
| D | 1 | 52 | 1061253 | 10743.94 | 411 | 401 | 98.7 |
| D | 12 | 2 | 625996 | 6335.81 | 411 | 401 | 98.7 |
| D | 2 | 250 | 163194 | 1648.71 | 411 | 401 | 98.7 |
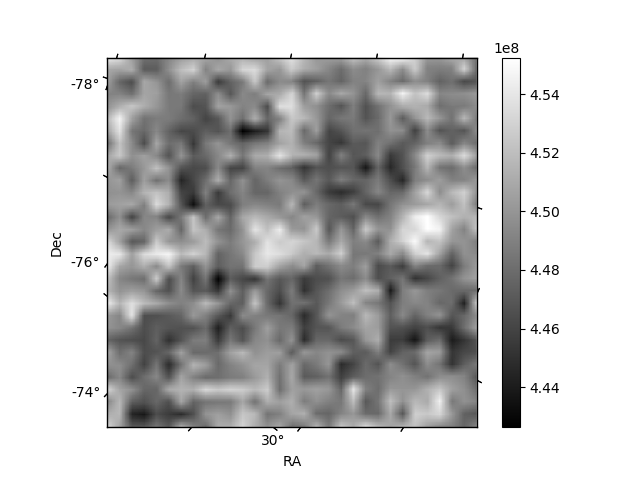
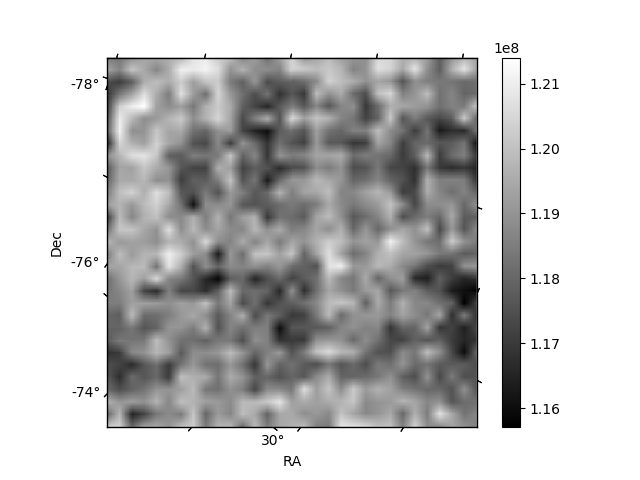
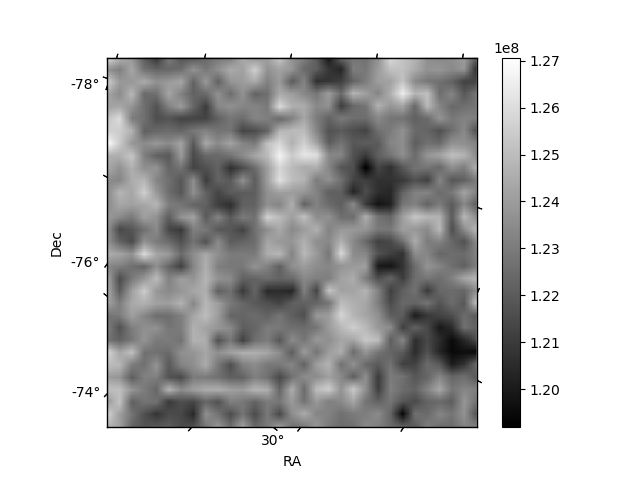
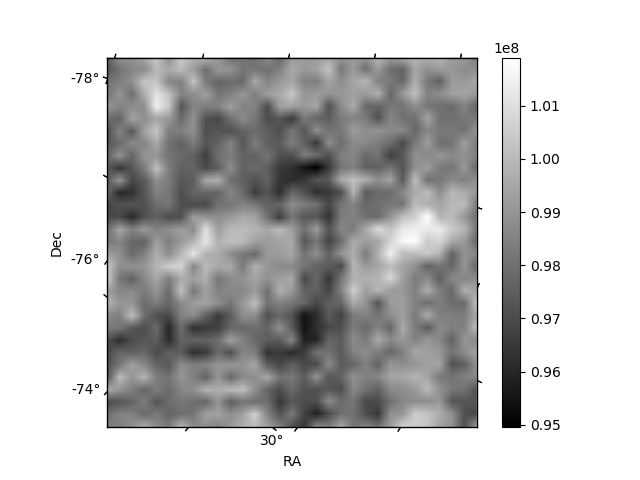
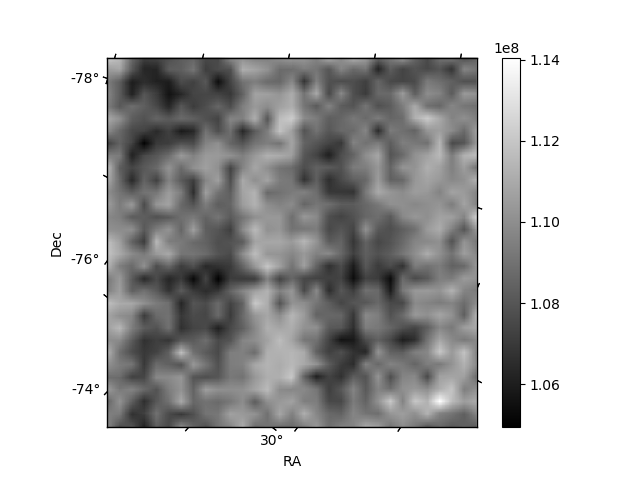
Histogram calculated using DETX and DETY for each event in the final _common_clean file
| Quadrant A | 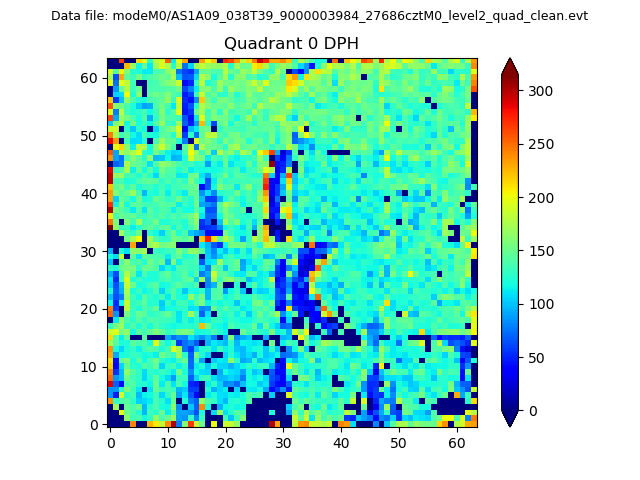 |
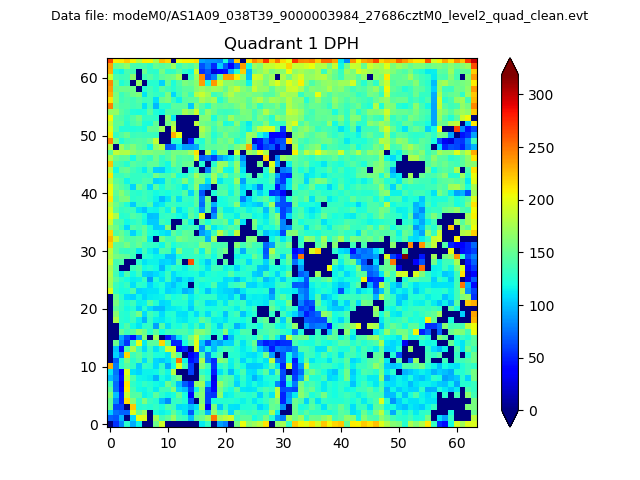 |
Quadrant B |
|---|---|---|---|
| Quadrant D | 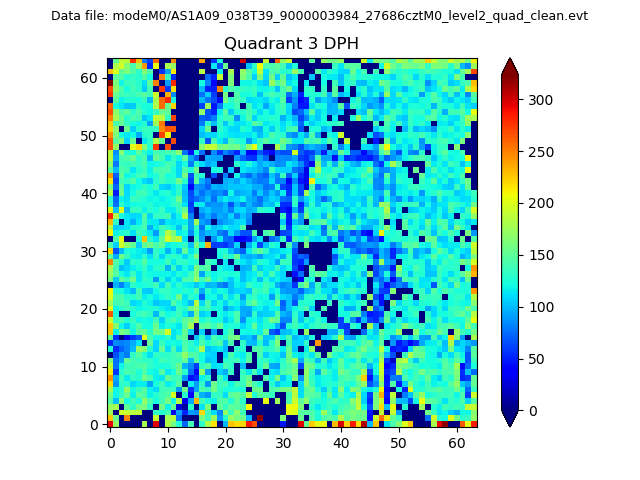 |
 |
Quadrant C |
| Plot type | Count rate plots | Images |
|---|---|---|
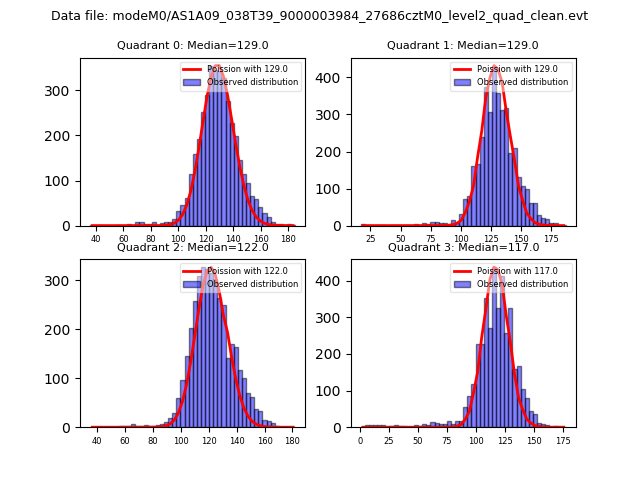
| Comparison with Poisson distribution Blue bars denote a histogram of data divided into 1 sec bins. Red curve is a Poisson curve with rate = median count rate of data. |
 |
 |
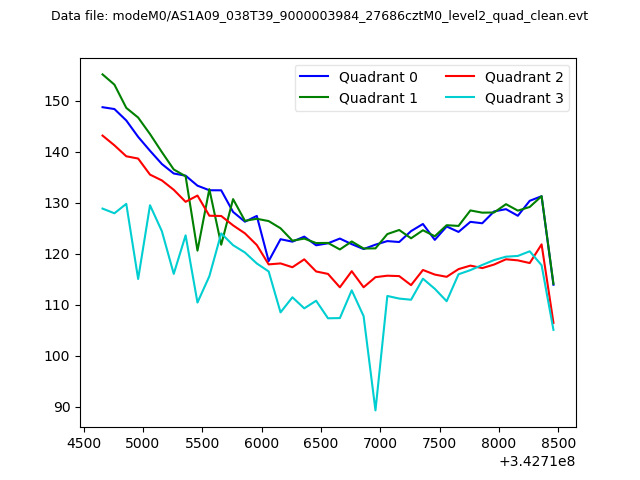
| Quadrant-wise count rates Data is divided into 100 sec bins |
 |
|
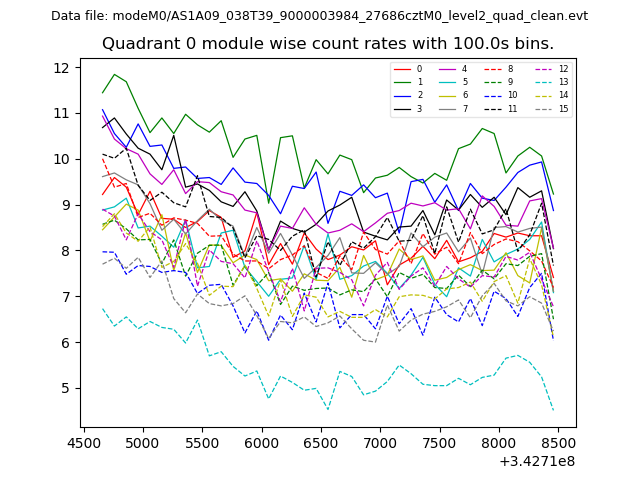
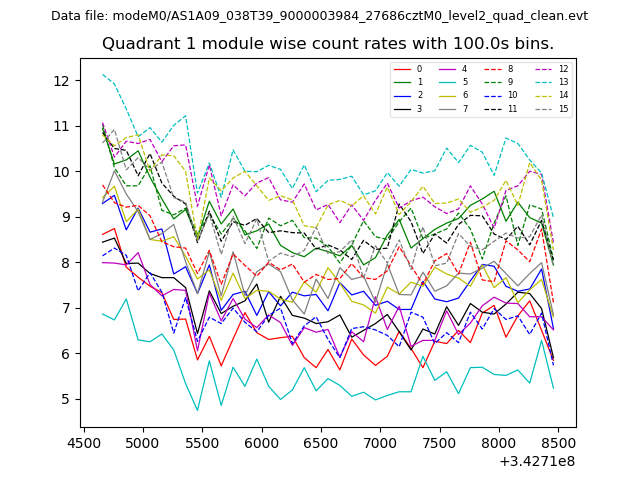
| Module-wise count rates for Quadrant A Data is divided into 100 sec bins |
 |
 |
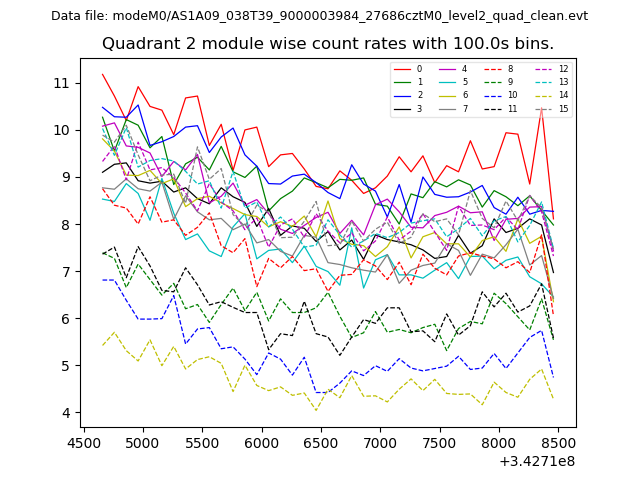
| Module-wise count rates for Quadrant B Data is divided into 100 sec bins |
 |
 |
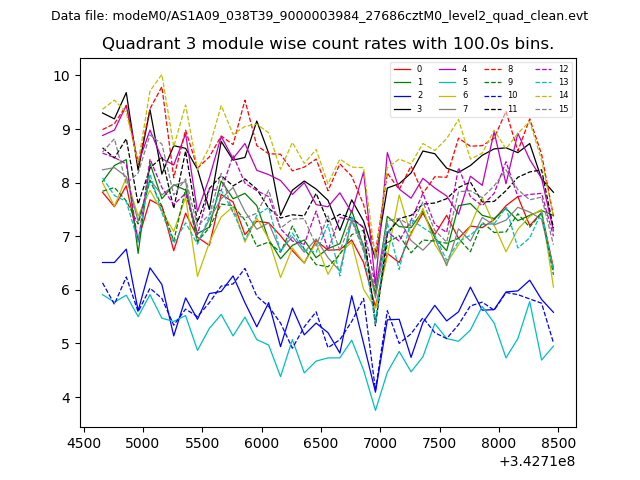
| Module-wise count rates for Quadrant C Data is divided into 100 sec bins |
 |
 |
| Module-wise count rates for Quadrant D Data is divided into 100 sec bins |
 |
 |
| Parameter | Plot |
|---|---|
| CZT HV Monitor | 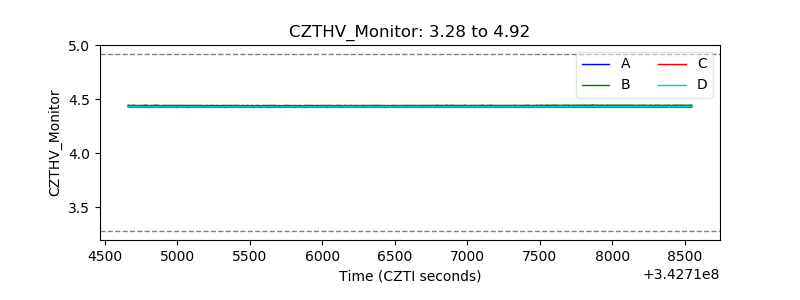 |
| D_VDD | 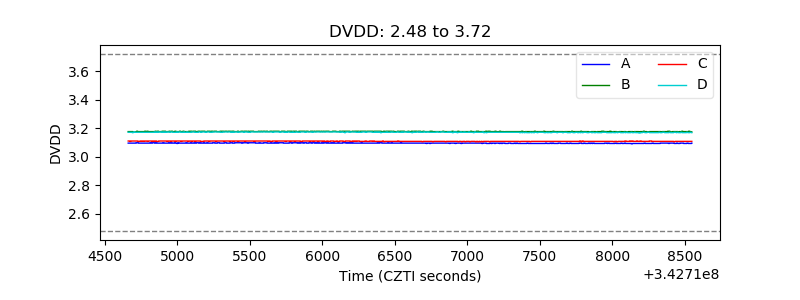 |
| Temperature 1 | 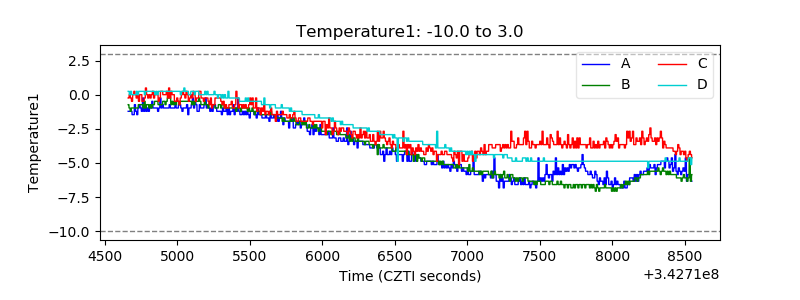 |
| Veto HV Monitor | 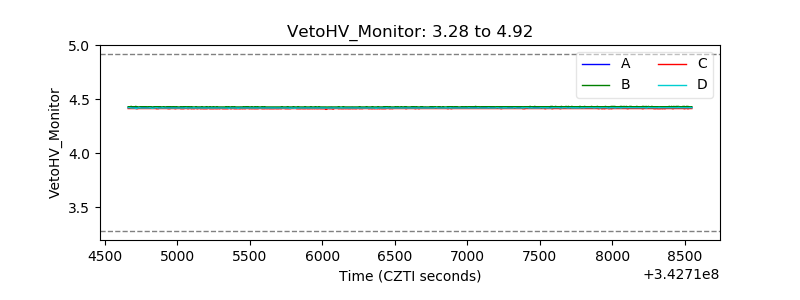 |
| Veto LLD | 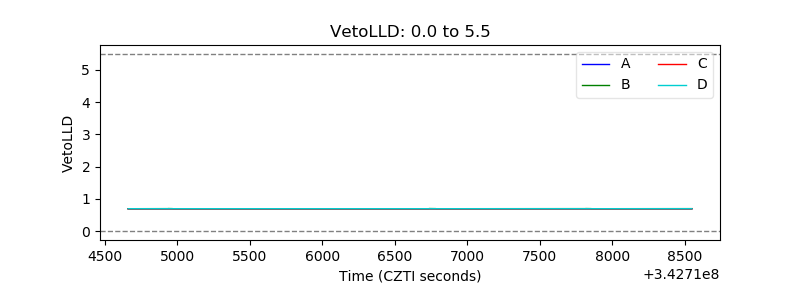 |
| Alpha Counter | 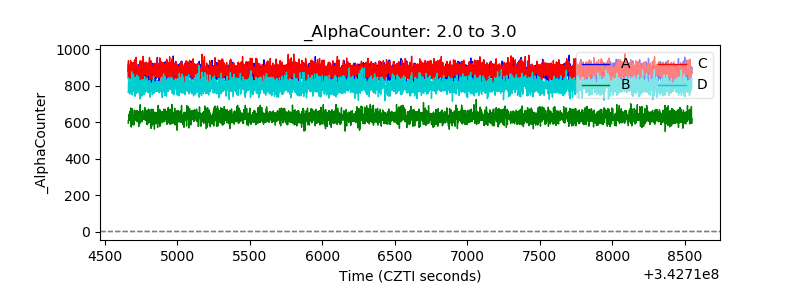 |
| _CPM_Rate | 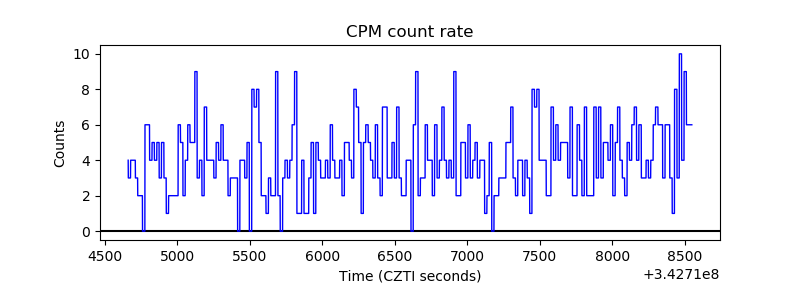 |
| CZT Counter | 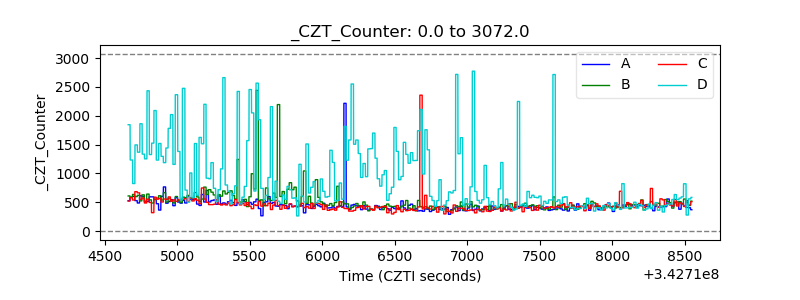 |
| +2.5 Volts monitor |  |
| +5 Volts monitor |  |
| _ROLL_ROT | 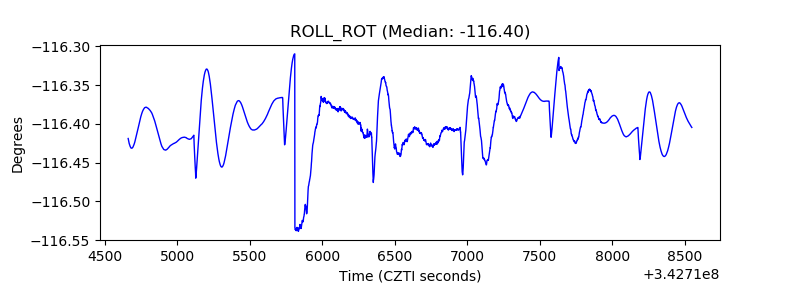 |
| _Roll_DEC | 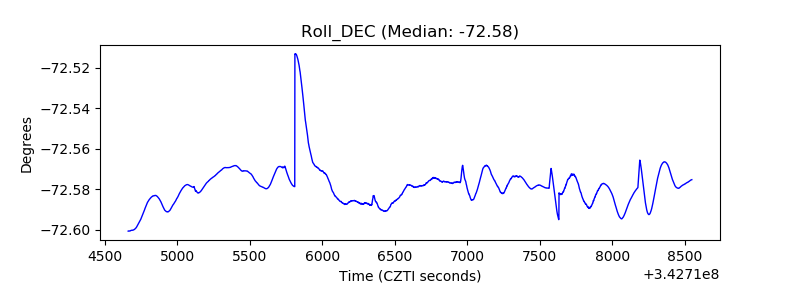 |
| _Roll_RA | 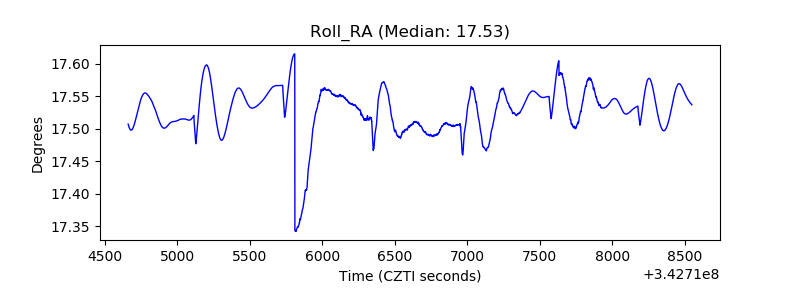 |
| Veto Counter | 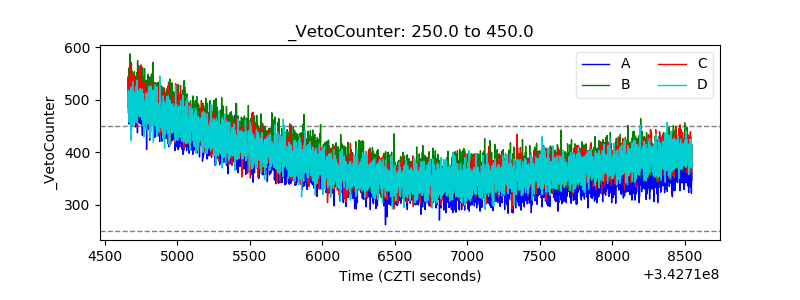 |