| Param | Original file | Final file |
|---|---|---|
| Filename | modeM0/AS1A09_038T39_9000003984_27689cztM0_level2.evt | modeM0/AS1A09_038T39_9000003984_27689cztM0_level2_quad_clean.evt |
| Size (bytes) | 233,985,600 | 58,314,240 |
| Size | 223.1 MB | 55.6 MB |
| Events in quadrant A | 1,379,628 | 399,644 |
| Events in quadrant B | 1,572,605 | 399,685 |
| Events in quadrant C | 1,351,915 | 377,984 |
| Events in quadrant D | 2,564,257 | 362,381 |
| Mode M0 | |||
|---|---|---|---|
| Quadrant | BADHDUFLAG | Total packets | Discarded packets |
| A | 0 | 6473 | 0 |
| B | 0 | 6914 | 0 |
| C | 0 | 6378 | 0 |
| D | 0 | 9812 | 0 |
| Quadrant | Total seconds | Saturated seconds | Saturation percentage |
|---|---|---|---|
| A | 3176 | 15 | 0.472292% |
| B | 3177 | 45 | 1.416431% |
| C | 3177 | 15 | 0.472144% |
| D | 3177 | 114 | 3.588291% |
Noise dominated data is calculated using 1-second bins in cleaned event files. If a bin has >2000 counts, and if more than 50% of those come from <1% of pixels, then it is considered to be noise-dominated and hence unusable.
| Quadrant | # 1 sec bins | Bins with >0 counts | Bins with >2000 counts | High rate bins dominated by noise | Noise dominated (total time) | Noise dominated (detector-on time) | Marked lightcurve |
|---|---|---|---|---|---|---|---|
| A | 3176 | 3176 | 14 | 14 | 0.44% | 0.44% |  |
| B | 3177 | 3177 | 31 | 31 | 0.98% | 0.98% |  |
| C | 3177 | 3177 | 1 | 1 | 0.03% | 0.03% |  |
| D | 3177 | 3177 | 156 | 156 | 4.91% | 4.91% |  |
Top three noisy pixels from each quadrant. If the there are fewer than three noisy pixels in the level2.evt file, extra rows are filled as -1
| Pixel properties | Quadrant properties | ||||||
|---|---|---|---|---|---|---|---|
| Quadrant | DetID | PixID | Counts | Sigma | Mean | Median | Sigma |
| A | 13 | 248 | 44157 | 609.05 | 346 | 339 | 71.9 |
| A | 13 | 254 | 5815 | 76.11 | 346 | 339 | 71.9 |
| A | 3 | 137 | 3131 | 38.81 | 346 | 339 | 71.9 |
| B | 5 | 172 | 156244 | 2340.63 | 345 | 338 | 66.6 |
| B | 0 | 230 | 21289 | 314.54 | 345 | 338 | 66.6 |
| B | 0 | 244 | 10247 | 148.76 | 345 | 338 | 66.6 |
| C | 14 | 238 | 53885 | 689.56 | 328 | 330 | 77.7 |
| C | 8 | 208 | 9139 | 113.42 | 328 | 330 | 77.7 |
| C | 15 | 208 | 6746 | 82.61 | 328 | 330 | 77.7 |
| D | 12 | 2 | 625891 | 8029.27 | 322 | 313 | 77.9 |
| D | 1 | 52 | 605704 | 7770.17 | 322 | 313 | 77.9 |
| D | 2 | 250 | 39199 | 499.1 | 322 | 313 | 77.9 |
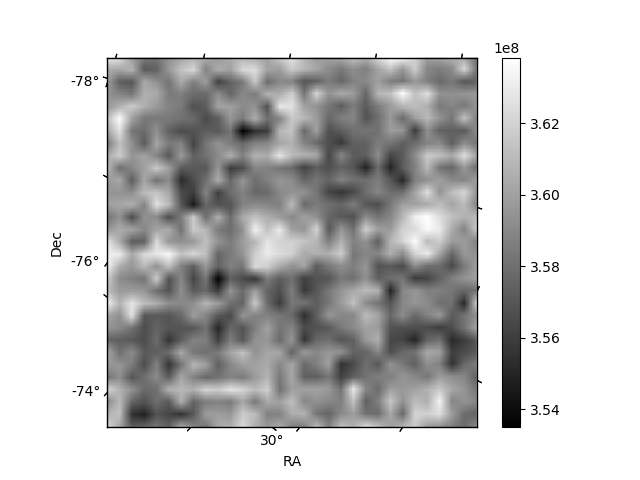
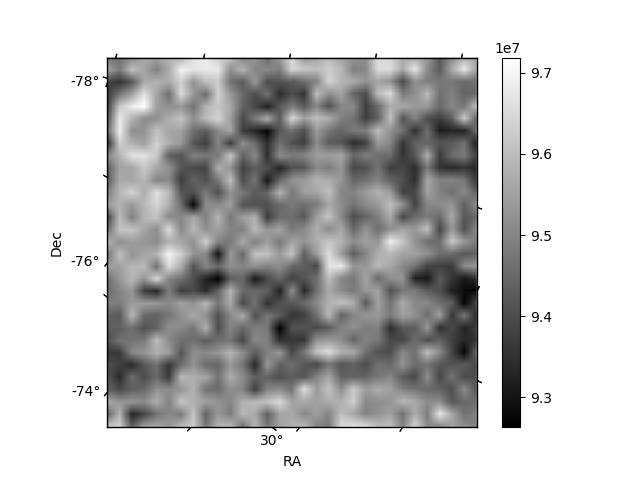
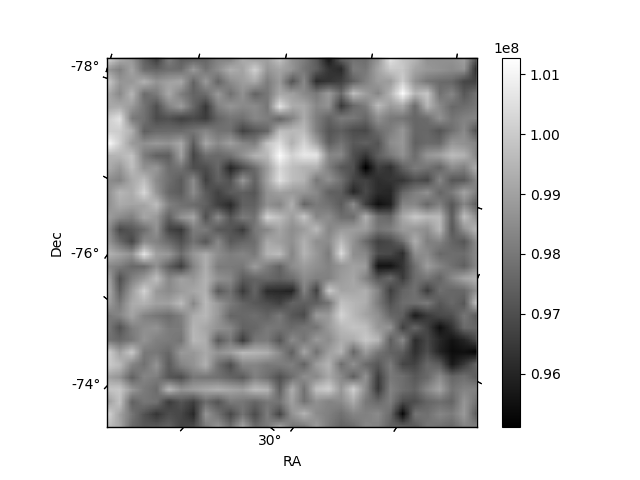
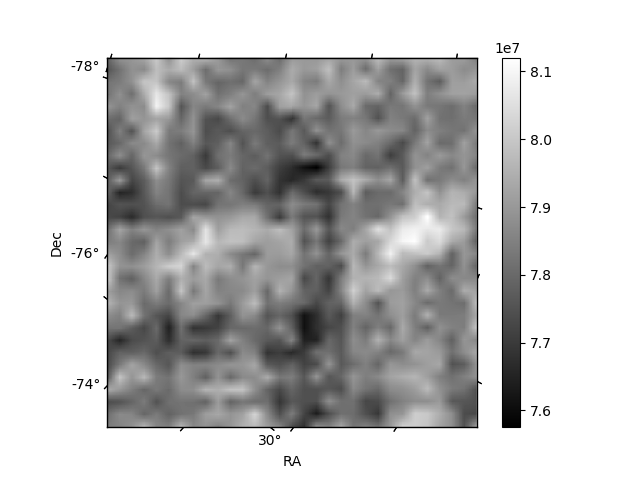
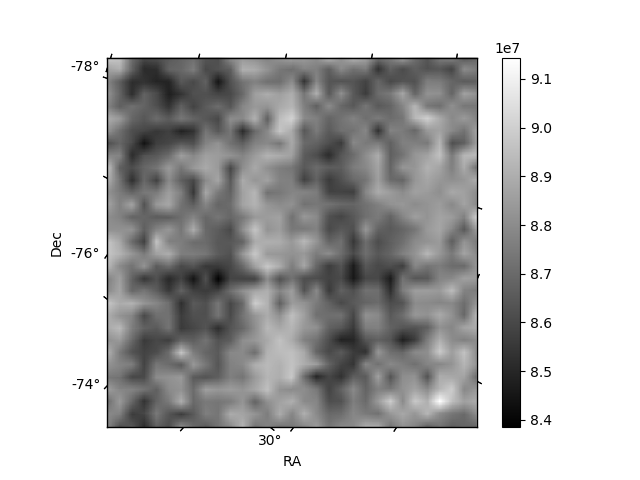
Histogram calculated using DETX and DETY for each event in the final _common_clean file
| Quadrant A | 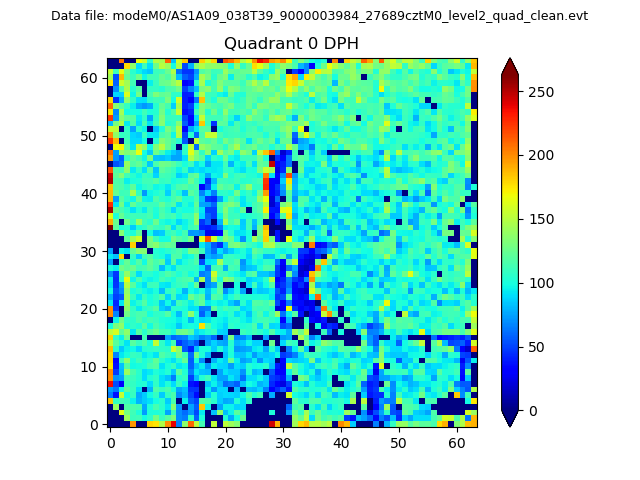 |
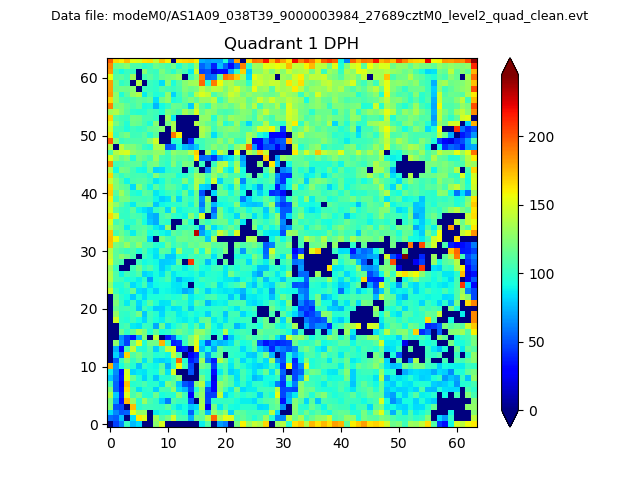 |
Quadrant B |
|---|---|---|---|
| Quadrant D | 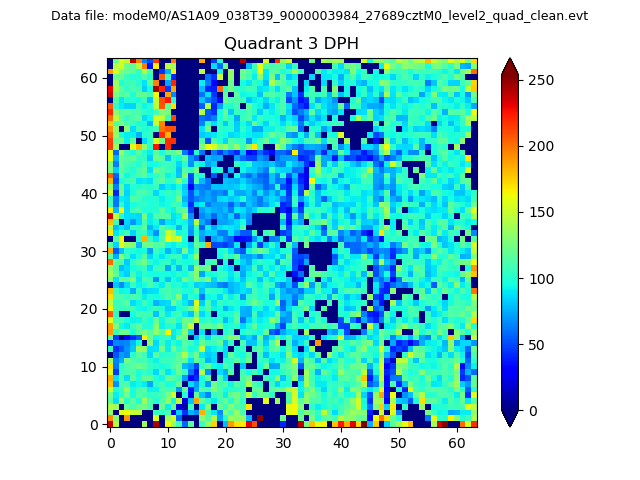 |
 |
Quadrant C |
| Plot type | Count rate plots | Images |
|---|---|---|
| Comparison with Poisson distribution Blue bars denote a histogram of data divided into 1 sec bins. Red curve is a Poisson curve with rate = median count rate of data. |
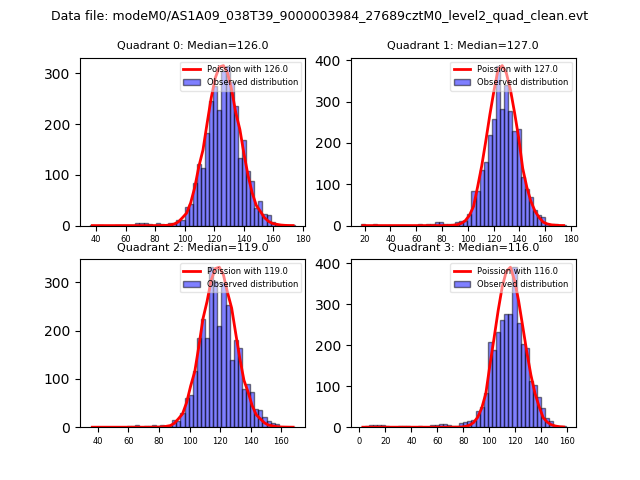 |
 |
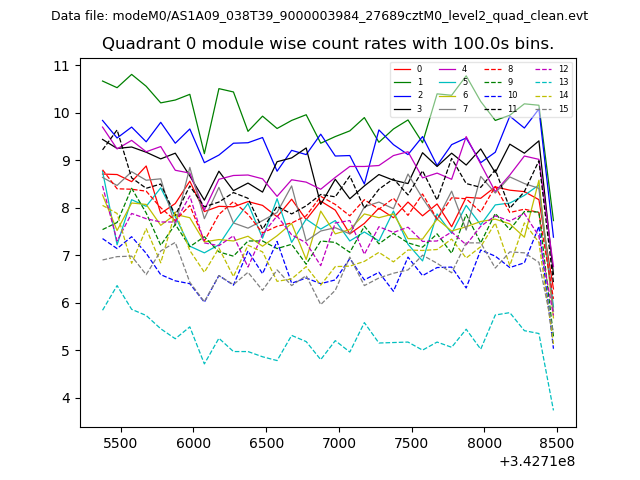
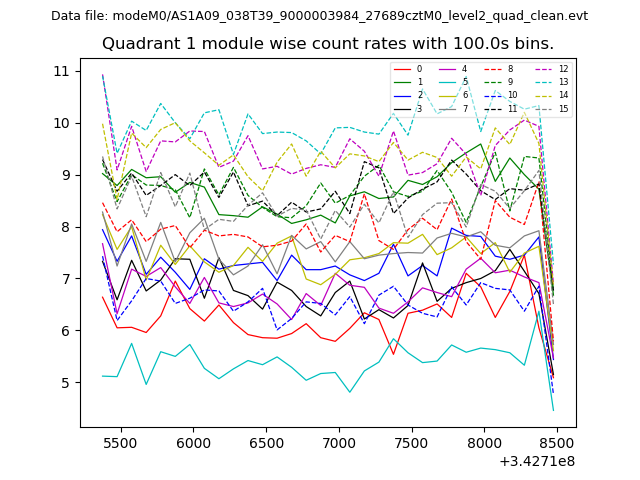
| Quadrant-wise count rates Data is divided into 100 sec bins |
 |
|
| Module-wise count rates for Quadrant A Data is divided into 100 sec bins |
 |
 |
| Module-wise count rates for Quadrant B Data is divided into 100 sec bins |
 |
 |
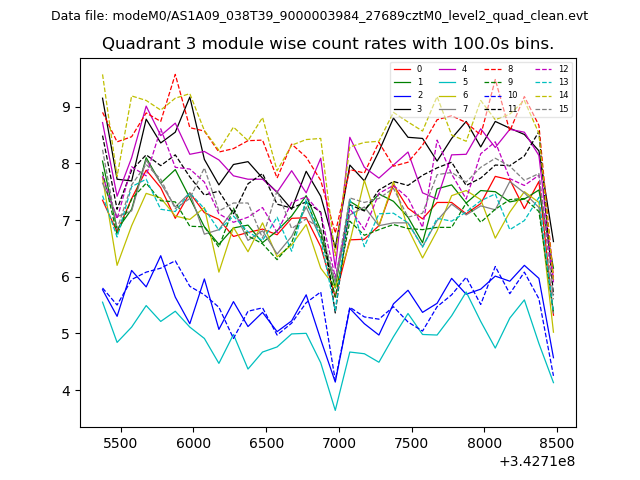
| Module-wise count rates for Quadrant C Data is divided into 100 sec bins |
 |
 |
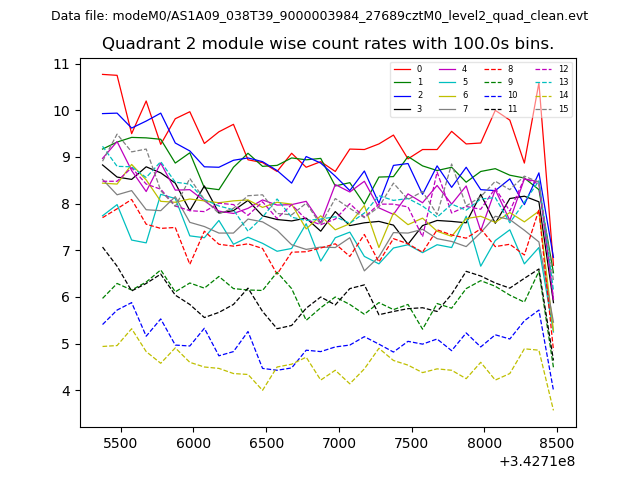
| Module-wise count rates for Quadrant D Data is divided into 100 sec bins |
 |
 |
| Parameter | Plot |
|---|---|
| CZT HV Monitor | 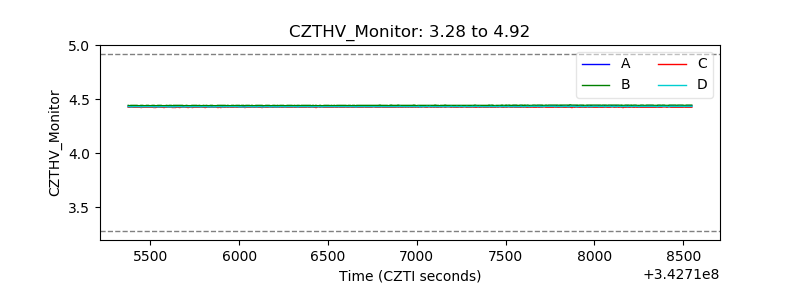 |
| D_VDD | 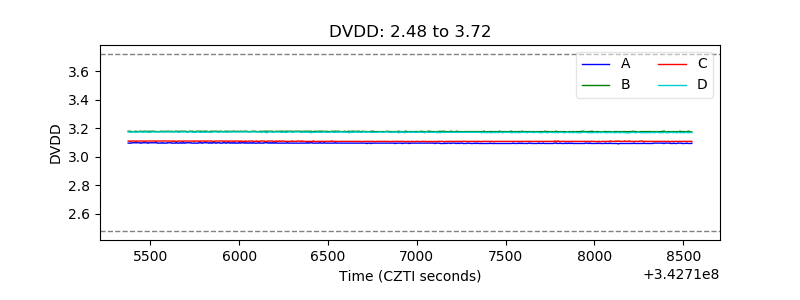 |
| Temperature 1 | 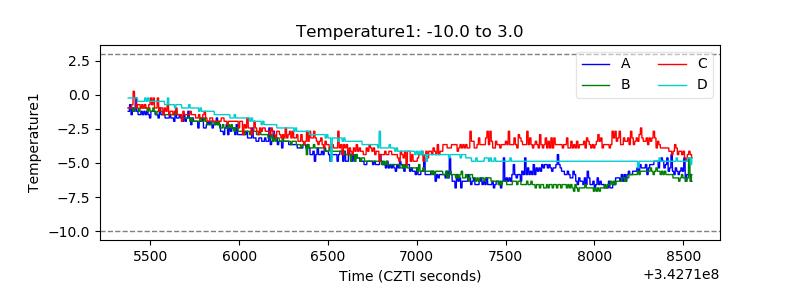 |
| Veto HV Monitor | 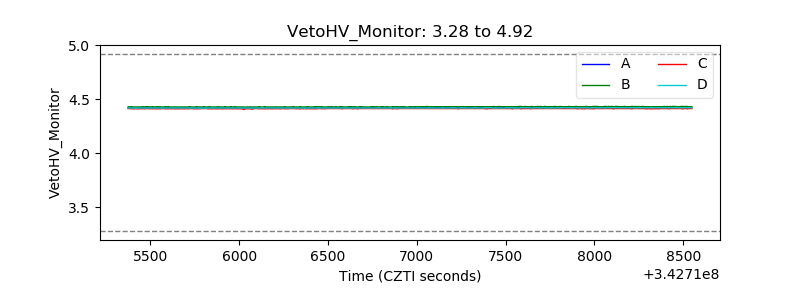 |
| Veto LLD | 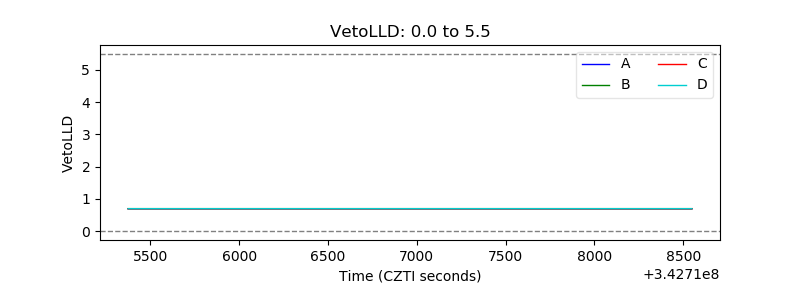 |
| Alpha Counter | 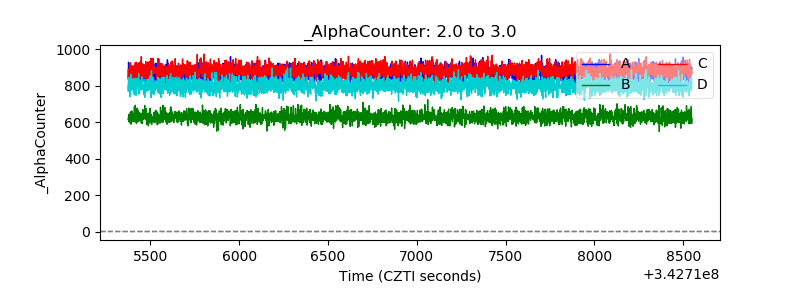 |
| _CPM_Rate | 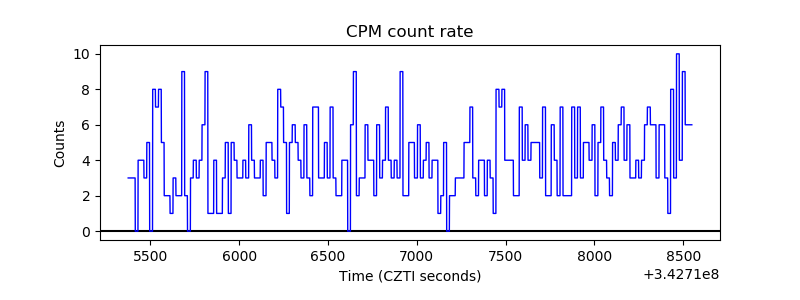 |
| CZT Counter |  |
| +2.5 Volts monitor |  |
| +5 Volts monitor |  |
| _ROLL_ROT | 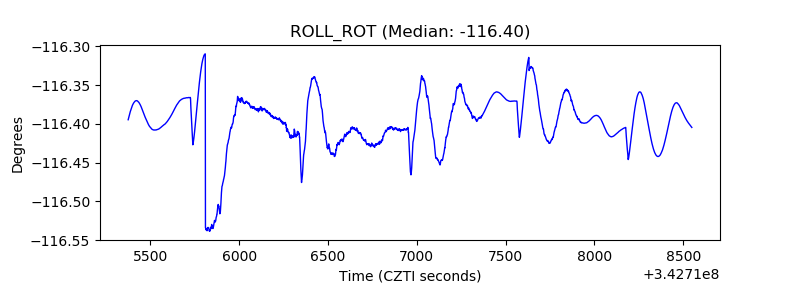 |
| _Roll_DEC | 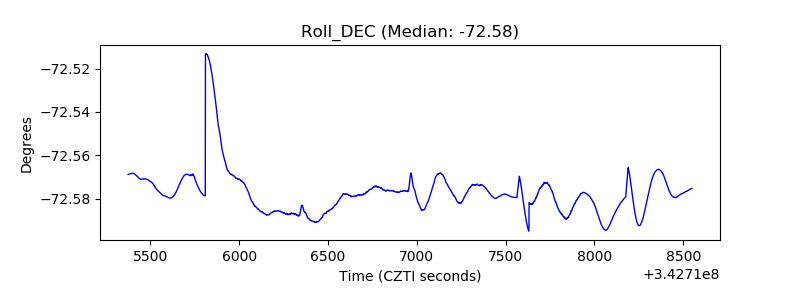 |
| _Roll_RA | 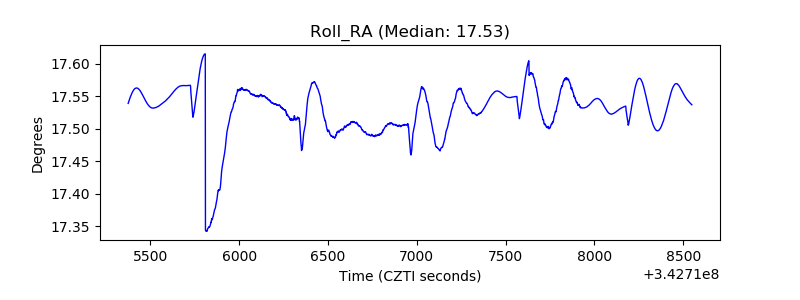 |
| Veto Counter | 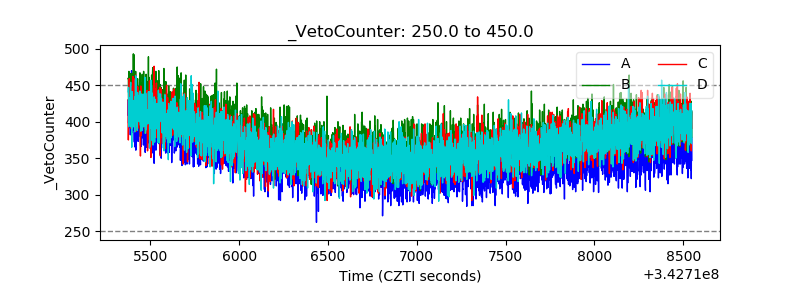 |