| Param | Original file | Final file |
|---|---|---|
| Filename | modeM0/AS1A09_038T41_9000003986cztM0_level2.fits | modeM0/AS1A09_038T41_9000003986cztM0_level2_quad_clean.evt |
| Size (bytes) | 48,559,680 | 63,342,720 |
| Size | 46.3 MB | 60.4 MB |
| Events in quadrant A | 303,080 | 422,614 |
| Events in quadrant B | 290,496 | 418,725 |
| Events in quadrant C | 288,134 | 386,665 |
| Events in quadrant D | 245,298 | 345,980 |
| Mode M0 | |||
|---|---|---|---|
| Quadrant | BADHDUFLAG | Total packets | Discarded packets |
| A | 0 | 10235 | 0 |
| B | 0 | 11221 | 0 |
| C | 0 | 10818 | 0 |
| D | 0 | 14828 | 0 |
| Mode M9 | |||
|---|---|---|---|
| Quadrant | BADHDUFLAG | Total packets | Discarded packets |
| A | 0 | 11 | 0 |
| B | 0 | 11 | 0 |
| C | 0 | 11 | 0 |
| D | 0 | 11 | 0 |
| Mode SS | |||
|---|---|---|---|
| Quadrant | BADHDUFLAG | Total packets | Discarded packets |
| A | 0 | 98 | 0 |
| B | 0 | 98 | 0 |
| C | 0 | 98 | 0 |
| D | 0 | 98 | 0 |
| Quadrant | Total seconds | Saturated seconds | Saturation percentage |
|---|---|---|---|
| A | 4906 | 42 | 0.856095% |
| B | 4906 | 110 | 2.242152% |
| C | 4906 | 80 | 1.630656% |
| D | 4906 | 433 | 8.825927% |
Noise dominated data is calculated using 1-second bins in cleaned event files. If a bin has >2000 counts, and if more than 50% of those come from <1% of pixels, then it is considered to be noise-dominated and hence unusable.
| Quadrant | # 1 sec bins | Bins with >0 counts | Bins with >2000 counts | High rate bins dominated by noise | Noise dominated (total time) | Noise dominated (detector-on time) | Marked lightcurve |
|---|---|---|---|---|---|---|---|
| A | 5960 | 4904 | 0 | 0 | 0.00% | 0.00% | 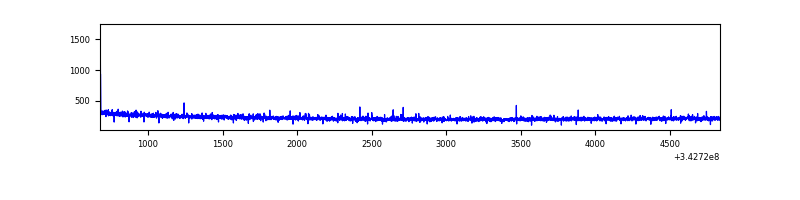 |
| B | 5960 | 4904 | 0 | 0 | 0.00% | 0.00% |  |
| C | 5961 | 4905 | 0 | 0 | 0.00% | 0.00% |  |
| D | 5960 | 4902 | 0 | 0 | 0.00% | 0.00% |  |
Top three noisy pixels from each quadrant. If the there are fewer than three noisy pixels in the level2.evt file, extra rows are filled as -1
| Pixel properties | Quadrant properties | ||||||
|---|---|---|---|---|---|---|---|
| Quadrant | DetID | PixID | Counts | Sigma | Mean | Median | Sigma |
| A | 0 | 29 | 292 | 10.02 | 79 | 74 | 21.7 |
| A | 0 | 30 | 244 | 7.81 | 79 | 74 | 21.7 |
| A | 15 | 236 | 235 | 7.39 | 79 | 74 | 21.7 |
| B | 2 | 9 | 218 | 8.43 | 77 | 74 | 17.1 |
| B | 5 | 232 | 205 | 7.67 | 77 | 74 | 17.1 |
| B | 5 | 128 | 202 | 7.49 | 77 | 74 | 17.1 |
| C | 3 | 187 | 204 | 6.29 | 76 | 72 | 21.0 |
| C | 3 | 126 | 203 | 6.24 | 76 | 72 | 21.0 |
| C | 2 | 191 | 199 | 6.05 | 76 | 72 | 21.0 |
| D | 4 | 246 | 196 | 6.47 | 69 | 63 | 20.6 |
| D | 10 | 113 | 185 | 5.94 | 69 | 63 | 20.6 |
| D | 6 | 231 | 181 | 5.74 | 69 | 63 | 20.6 |
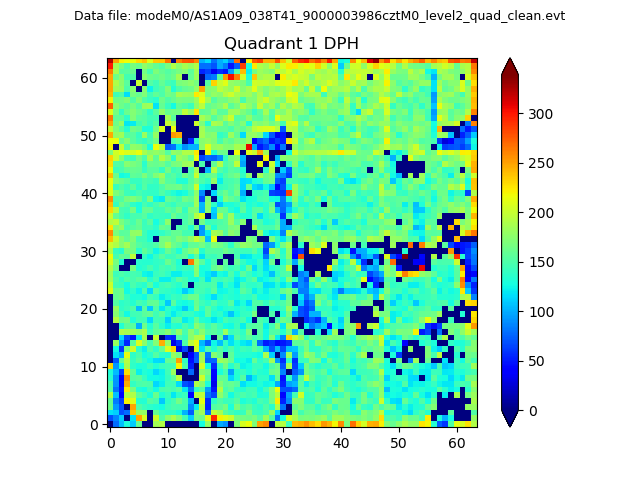
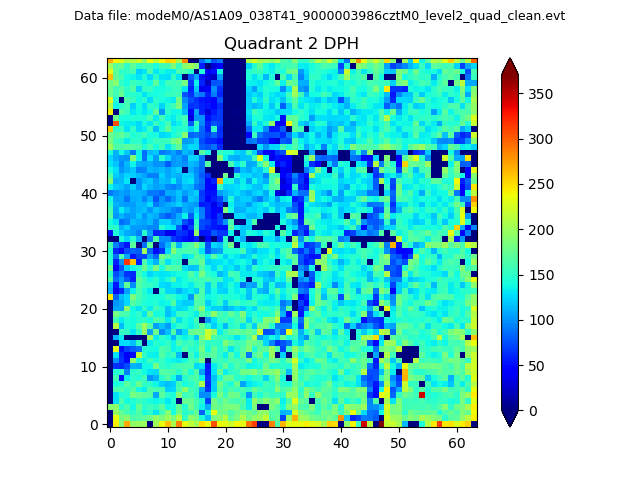
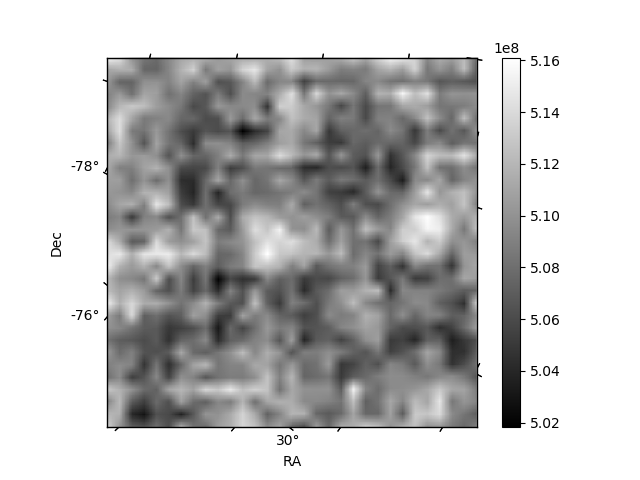
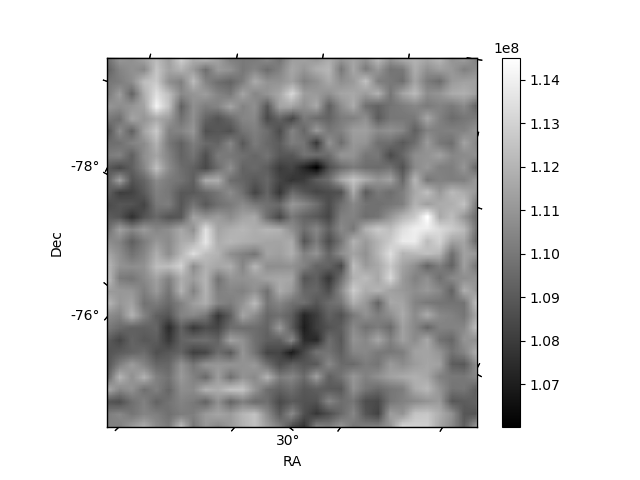
Histogram calculated using DETX and DETY for each event in the final _common_clean file
| Quadrant A |  |
 |
Quadrant B |
|---|---|---|---|
| Quadrant D |  |
 |
Quadrant C |
| Plot type | Count rate plots | Images |
|---|---|---|
| Comparison with Poisson distribution Blue bars denote a histogram of data divided into 1 sec bins. Red curve is a Poisson curve with rate = median count rate of data. |
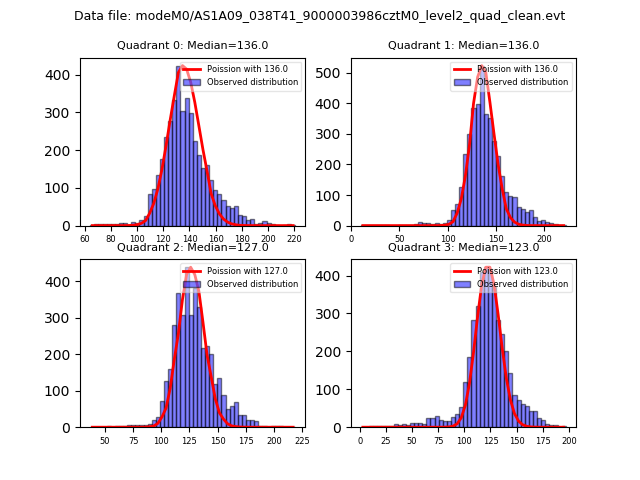 |
 |
| Quadrant-wise count rates Data is divided into 100 sec bins |
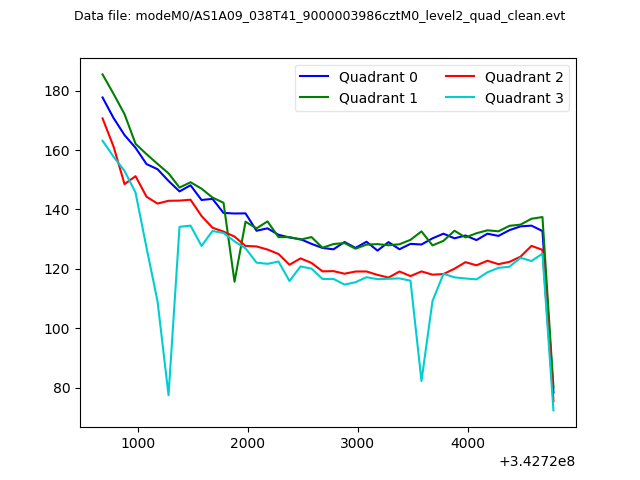 |
|
| Module-wise count rates for Quadrant A Data is divided into 100 sec bins |
 |
 |
| Module-wise count rates for Quadrant B Data is divided into 100 sec bins |
 |
 |
| Module-wise count rates for Quadrant C Data is divided into 100 sec bins |
 |
 |
| Module-wise count rates for Quadrant D Data is divided into 100 sec bins |
 |
 |
| Parameter | Plot |
|---|---|
| CZT HV Monitor |  |
| D_VDD | 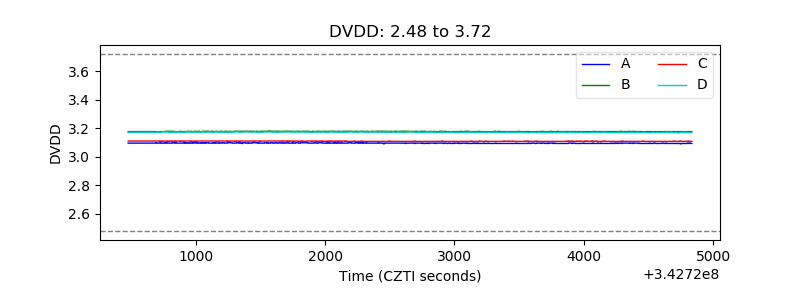 |
| Temperature 1 |  |
| Veto HV Monitor |  |
| Veto LLD |  |
| Alpha Counter | 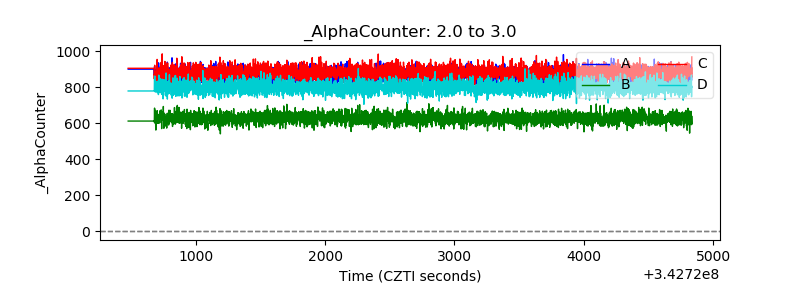 |
| _CPM_Rate |  |
| CZT Counter |  |
| +2.5 Volts monitor |  |
| +5 Volts monitor | 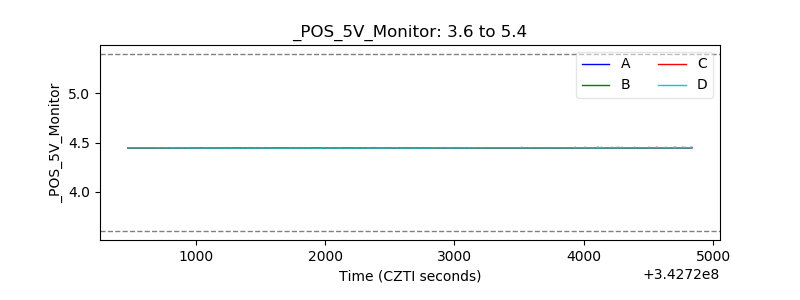 |
| _ROLL_ROT |  |
| _Roll_DEC |  |
| _Roll_RA |  |
| Veto Counter |  |