| Param | Original file | Final file |
|---|---|---|
| Filename | modeM0/AS1A09_038T41_9000003986_27686cztM0_level2.evt | modeM0/AS1A09_038T41_9000003986_27686cztM0_level2_quad_clean.evt |
| Size (bytes) | 204,871,680 | 45,561,600 |
| Size | 195.4 MB | 43.5 MB |
| Events in quadrant A | 1,158,059 | 317,377 |
| Events in quadrant B | 1,422,815 | 322,042 |
| Events in quadrant C | 1,310,381 | 301,883 |
| Events in quadrant D | 2,163,797 | 280,876 |
| Mode M0 | |||
|---|---|---|---|
| Quadrant | BADHDUFLAG | Total packets | Discarded packets |
| A | 0 | 4767 | 0 |
| B | 0 | 5653 | 0 |
| C | 0 | 5292 | 0 |
| D | 0 | 7891 | 0 |
| Mode M9 | |||
|---|---|---|---|
| Quadrant | BADHDUFLAG | Total packets | Discarded packets |
| A | 0 | 11 | 0 |
| B | 0 | 11 | 0 |
| C | 0 | 11 | 0 |
| D | 0 | 11 | 0 |
| Quadrant | Total seconds | Saturated seconds | Saturation percentage |
|---|---|---|---|
| A | 2177 | 41 | 1.883326% |
| B | 2177 | 99 | 4.547542% |
| C | 2177 | 73 | 3.353238% |
| D | 2176 | 338 | 15.533088% |
Noise dominated data is calculated using 1-second bins in cleaned event files. If a bin has >2000 counts, and if more than 50% of those come from <1% of pixels, then it is considered to be noise-dominated and hence unusable.
| Quadrant | # 1 sec bins | Bins with >0 counts | Bins with >2000 counts | High rate bins dominated by noise | Noise dominated (total time) | Noise dominated (detector-on time) | Marked lightcurve |
|---|---|---|---|---|---|---|---|
| A | 3232 | 2177 | 1 | 1 | 0.03% | 0.05% | 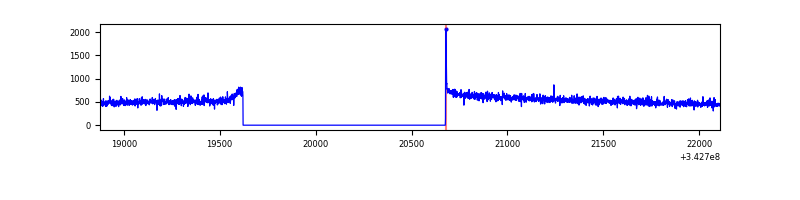 |
| B | 3232 | 2177 | 38 | 38 | 1.18% | 1.75% | 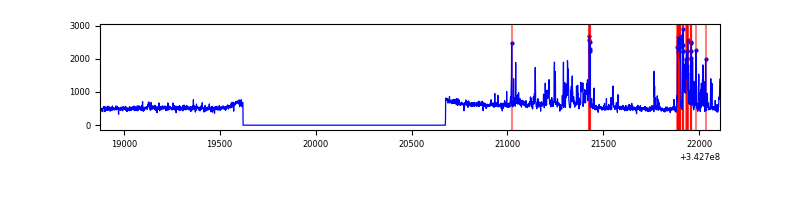 |
| C | 3232 | 2177 | 15 | 15 | 0.46% | 0.69% | 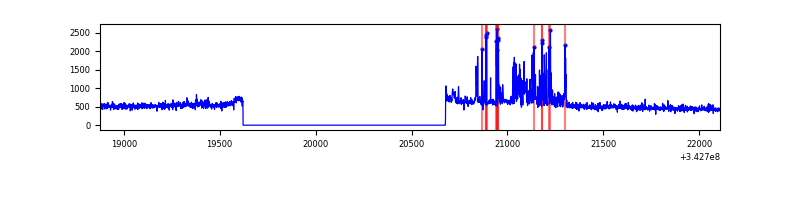 |
| D | 3231 | 2176 | 302 | 302 | 9.35% | 13.88% | 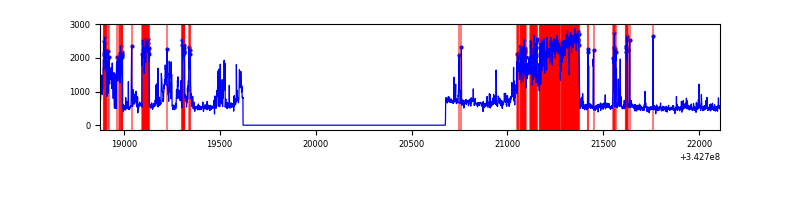 |
Top three noisy pixels from each quadrant. If the there are fewer than three noisy pixels in the level2.evt file, extra rows are filled as -1
| Pixel properties | Quadrant properties | ||||||
|---|---|---|---|---|---|---|---|
| Quadrant | DetID | PixID | Counts | Sigma | Mean | Median | Sigma |
| A | 8 | 192 | 6562 | 102.72 | 298 | 292 | 61.0 |
| A | 13 | 254 | 3781 | 57.16 | 298 | 292 | 61.0 |
| A | 0 | 226 | 2698 | 39.42 | 298 | 292 | 61.0 |
| B | 5 | 172 | 238598 | 4145.91 | 294 | 288 | 57.5 |
| B | 0 | 230 | 15177 | 259.03 | 294 | 288 | 57.5 |
| B | 3 | 64 | 8040 | 134.86 | 294 | 288 | 57.5 |
| C | 8 | 208 | 170231 | 2546.67 | 279 | 279 | 66.7 |
| C | 14 | 238 | 45000 | 670.13 | 279 | 279 | 66.7 |
| C | 3 | 233 | 6412 | 91.9 | 279 | 279 | 66.7 |
| D | 6 | 112 | 542605 | 8204.05 | 274 | 266 | 66.1 |
| D | 1 | 52 | 507306 | 7670.08 | 274 | 266 | 66.1 |
| D | 11 | 176 | 30954 | 464.22 | 274 | 266 | 66.1 |
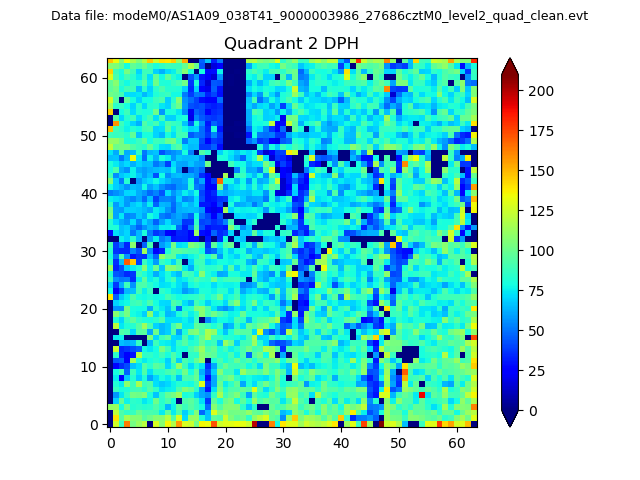
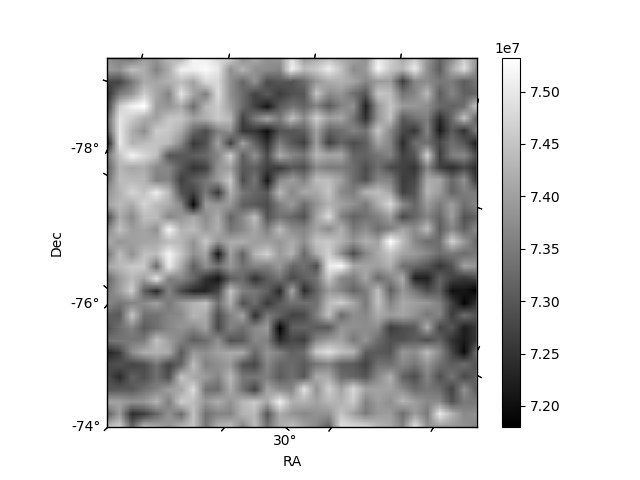
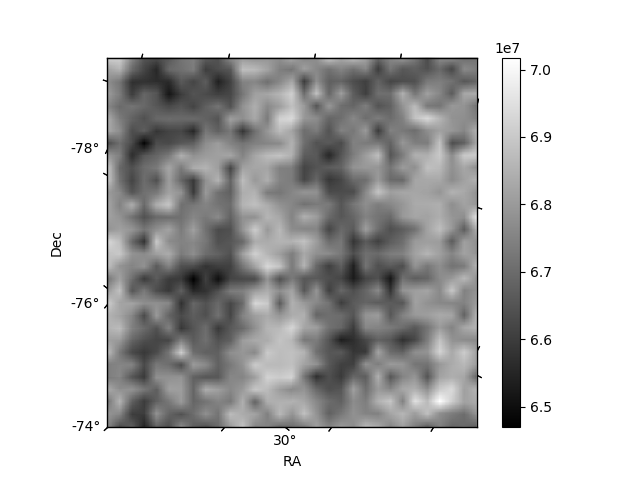
Histogram calculated using DETX and DETY for each event in the final _common_clean file
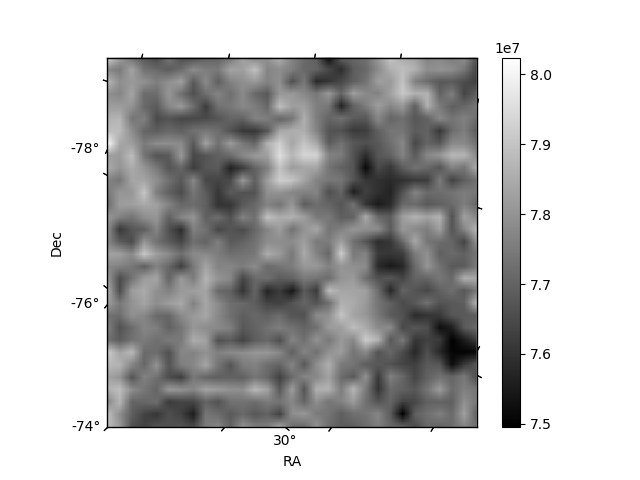
| Quadrant A | 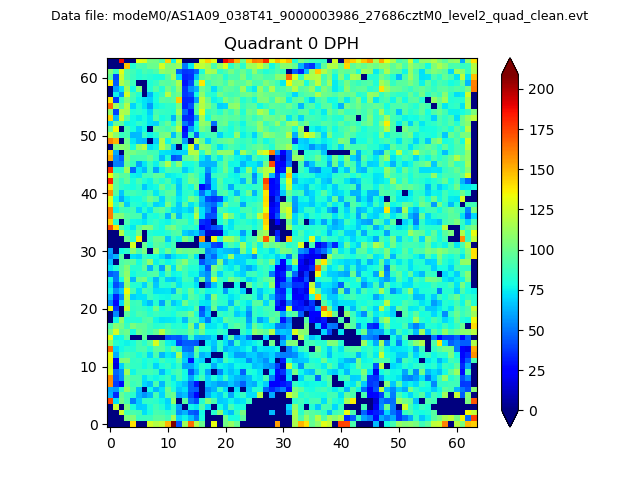 |
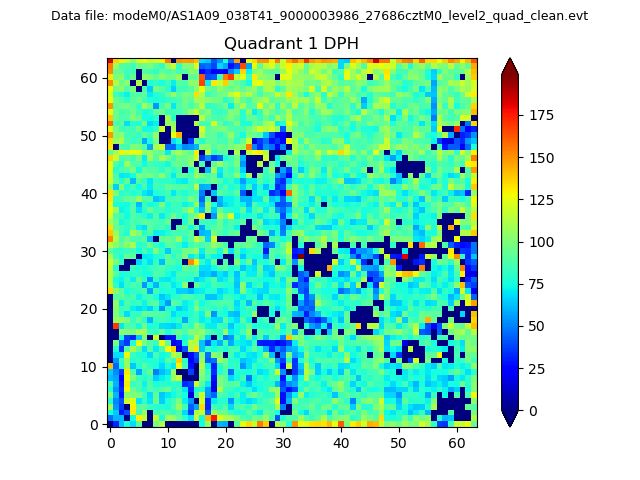 |
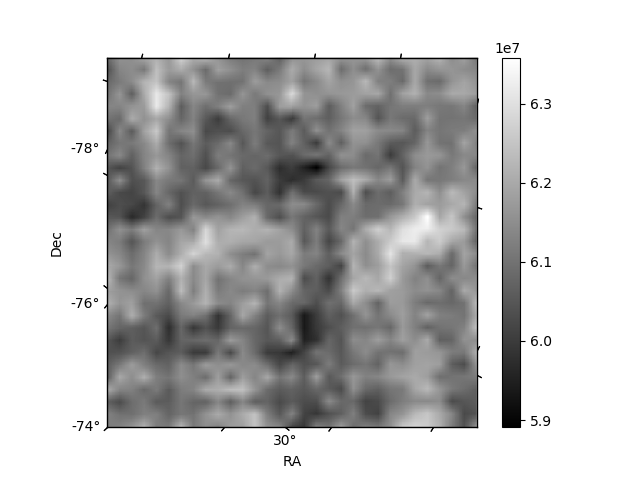
Quadrant B |
|---|---|---|---|
| Quadrant D | 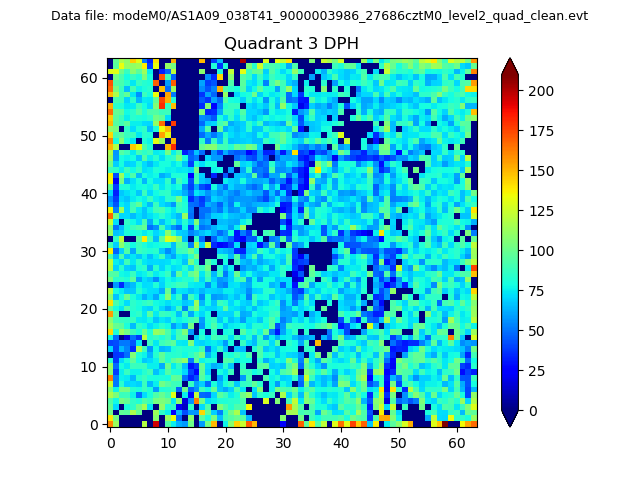 |
 |
Quadrant C |
| Plot type | Count rate plots | Images |
|---|---|---|
| Comparison with Poisson distribution Blue bars denote a histogram of data divided into 1 sec bins. Red curve is a Poisson curve with rate = median count rate of data. |
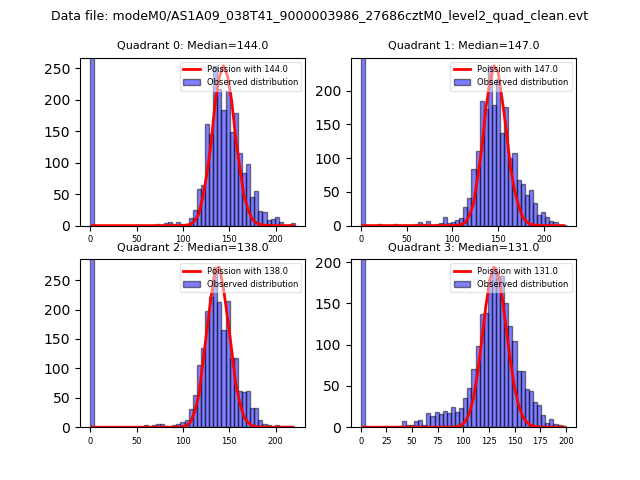 |
 |
| Quadrant-wise count rates Data is divided into 100 sec bins |
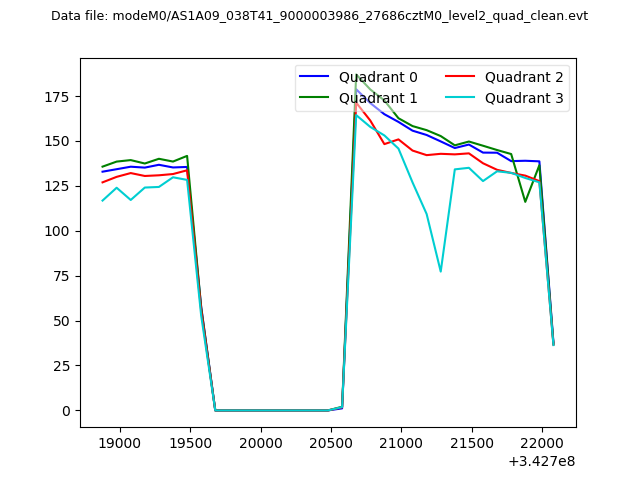 |
|
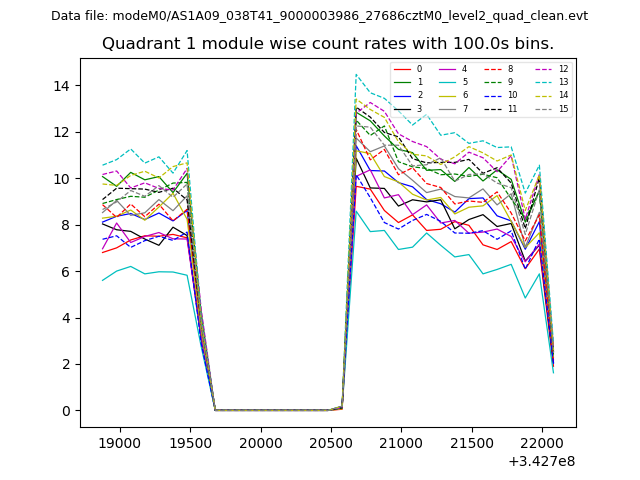
| Module-wise count rates for Quadrant A Data is divided into 100 sec bins |
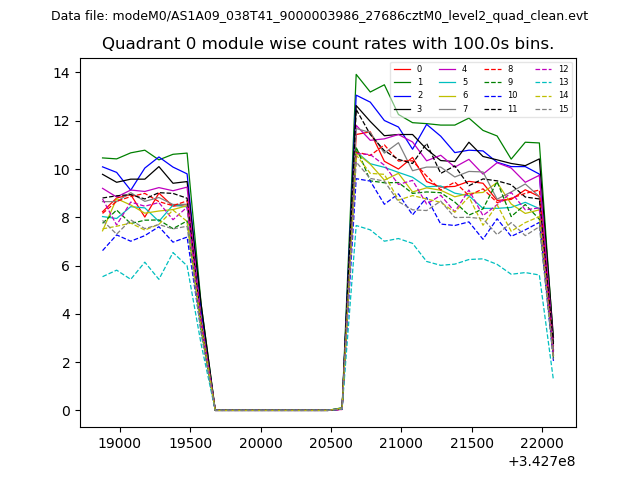 |
 |
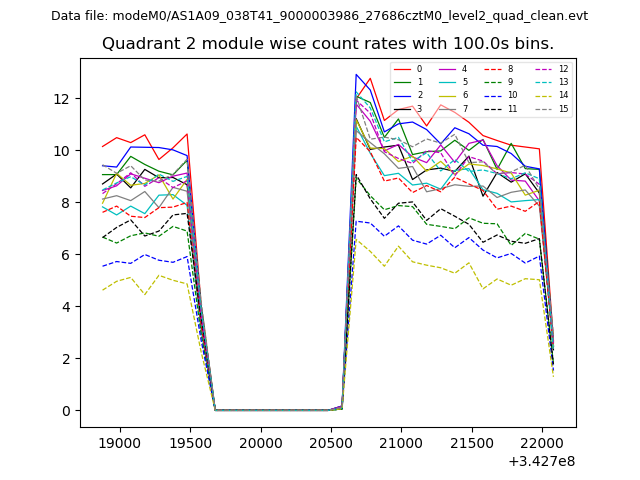
| Module-wise count rates for Quadrant B Data is divided into 100 sec bins |
 |
 |
| Module-wise count rates for Quadrant C Data is divided into 100 sec bins |
 |
 |
| Module-wise count rates for Quadrant D Data is divided into 100 sec bins |
 |
 |
| Parameter | Plot |
|---|---|
| CZT HV Monitor | 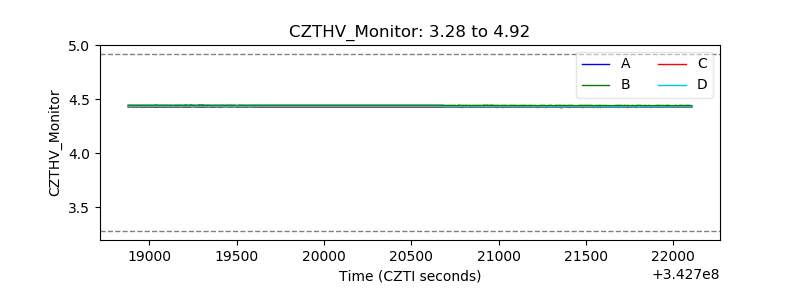 |
| D_VDD | 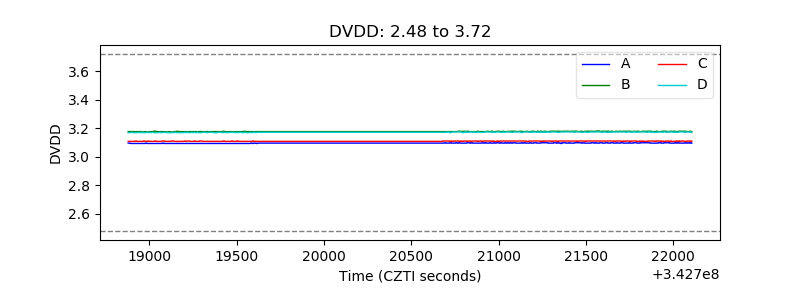 |
| Temperature 1 | 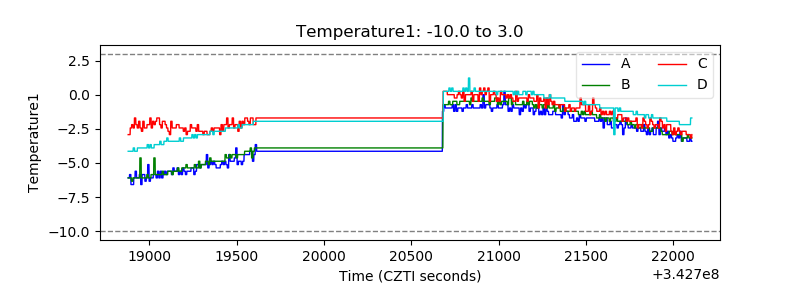 |
| Veto HV Monitor | 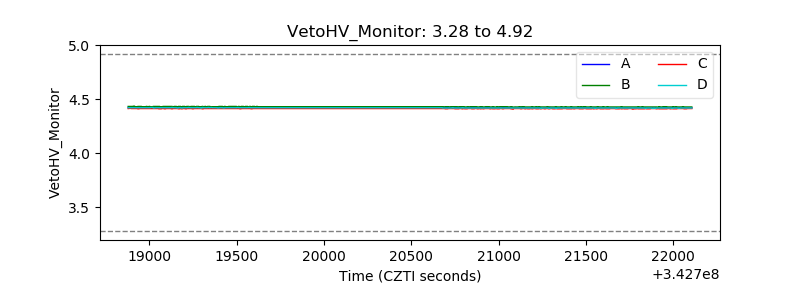 |
| Veto LLD | 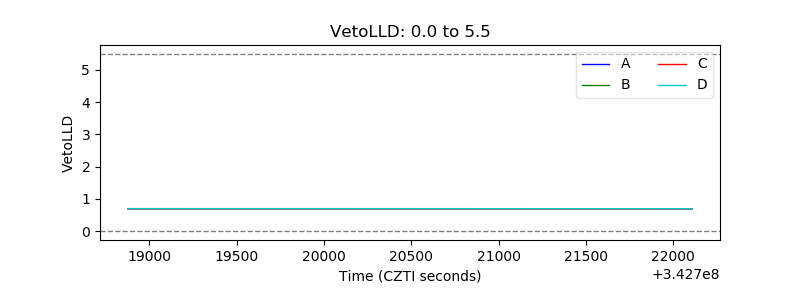 |
| Alpha Counter |  |
| _CPM_Rate |  |
| CZT Counter | 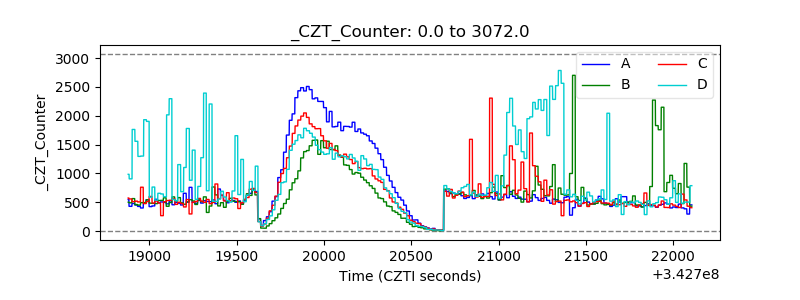 |
| +2.5 Volts monitor |  |
| +5 Volts monitor |  |
| _ROLL_ROT | 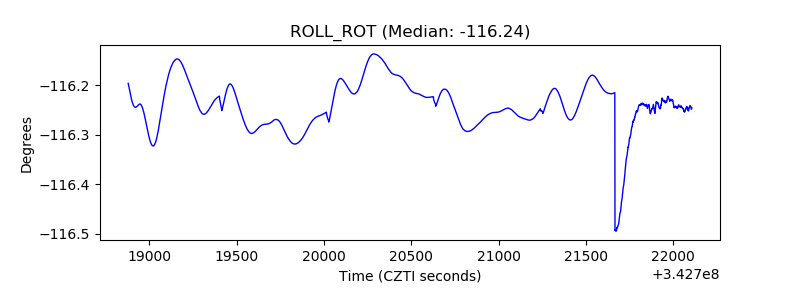 |
| _Roll_DEC | 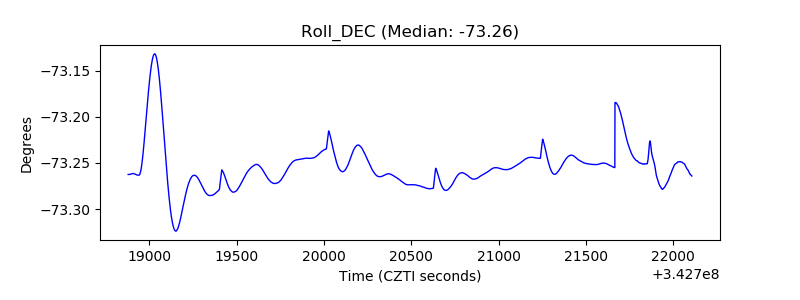 |
| _Roll_RA | 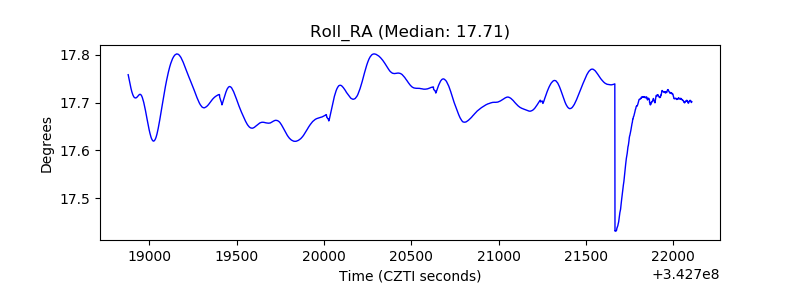 |
| Veto Counter | 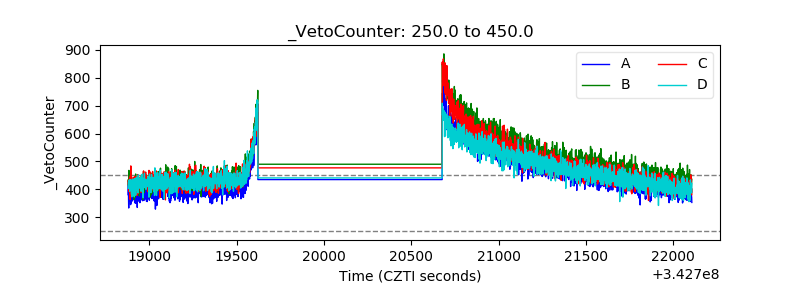 |