| Param | Original file | Final file |
|---|---|---|
| Filename | modeM0/AS1A09_038T41_9000003986_27688cztM0_level2.evt | modeM0/AS1A09_038T41_9000003986_27688cztM0_level2_quad_clean.evt |
| Size (bytes) | 319,953,600 | 82,105,920 |
| Size | 305.1 MB | 78.3 MB |
| Events in quadrant A | 1,926,775 | 572,341 |
| Events in quadrant B | 2,263,316 | 576,595 |
| Events in quadrant C | 2,113,854 | 536,171 |
| Events in quadrant D | 3,102,347 | 508,395 |
| Mode M0 | |||
|---|---|---|---|
| Quadrant | BADHDUFLAG | Total packets | Discarded packets |
| A | 0 | 8672 | 0 |
| B | 0 | 9656 | 0 |
| C | 0 | 9211 | 0 |
| D | 0 | 12102 | 0 |
| Mode M9 | |||
|---|---|---|---|
| Quadrant | BADHDUFLAG | Total packets | Discarded packets |
| A | 0 | 2 | 0 |
| B | 0 | 3 | 0 |
| C | 0 | 3 | 0 |
| D | 0 | 3 | 0 |
| Quadrant | Total seconds | Saturated seconds | Saturation percentage |
|---|---|---|---|
| A | 4160 | 10 | 0.240385% |
| B | 4160 | 74 | 1.778846% |
| C | 4160 | 49 | 1.177885% |
| D | 4160 | 332 | 7.980769% |
Noise dominated data is calculated using 1-second bins in cleaned event files. If a bin has >2000 counts, and if more than 50% of those come from <1% of pixels, then it is considered to be noise-dominated and hence unusable.
| Quadrant | # 1 sec bins | Bins with >0 counts | Bins with >2000 counts | High rate bins dominated by noise | Noise dominated (total time) | Noise dominated (detector-on time) | Marked lightcurve |
|---|---|---|---|---|---|---|---|
| A | 4160 | 4160 | 1 | 1 | 0.02% | 0.02% | 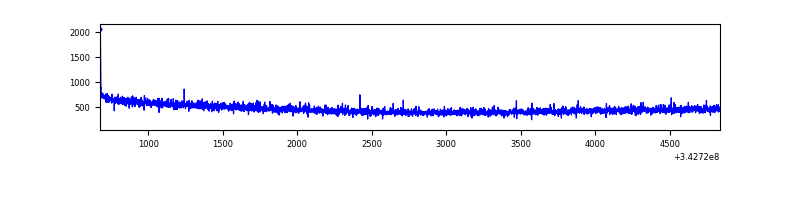 |
| B | 4160 | 4160 | 43 | 43 | 1.03% | 1.03% | 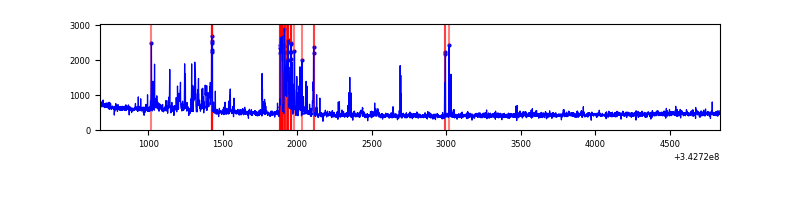 |
| C | 4160 | 4160 | 15 | 15 | 0.36% | 0.36% | 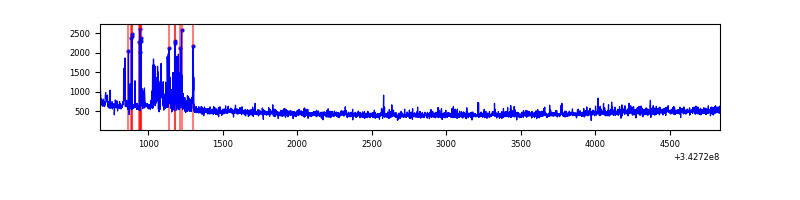 |
| D | 4160 | 4160 | 334 | 334 | 8.03% | 8.03% | 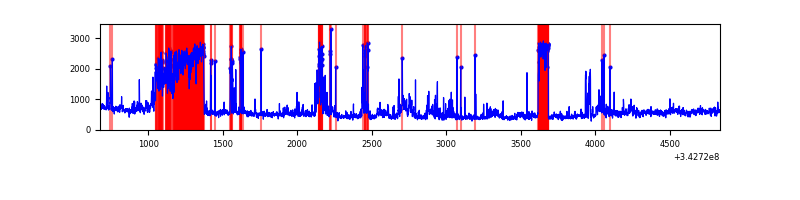 |
Top three noisy pixels from each quadrant. If the there are fewer than three noisy pixels in the level2.evt file, extra rows are filled as -1
| Pixel properties | Quadrant properties | ||||||
|---|---|---|---|---|---|---|---|
| Quadrant | DetID | PixID | Counts | Sigma | Mean | Median | Sigma |
| A | 13 | 254 | 7310 | 68.58 | 497 | 488 | 99.5 |
| A | 8 | 192 | 6810 | 63.55 | 497 | 488 | 99.5 |
| A | 3 | 137 | 4419 | 39.52 | 497 | 488 | 99.5 |
| B | 5 | 172 | 248493 | 2640.32 | 498 | 486 | 93.9 |
| B | 3 | 64 | 25175 | 262.84 | 498 | 486 | 93.9 |
| B | 0 | 230 | 22578 | 235.19 | 498 | 486 | 93.9 |
| C | 8 | 208 | 204680 | 1878.8 | 467 | 469 | 108.7 |
| C | 14 | 238 | 76940 | 703.56 | 467 | 469 | 108.7 |
| C | 3 | 233 | 5877 | 49.76 | 467 | 469 | 108.7 |
| D | 6 | 112 | 542772 | 5009.3 | 456 | 443 | 108.3 |
| D | 1 | 52 | 538881 | 4973.36 | 456 | 443 | 108.3 |
| D | 2 | 250 | 94310 | 867.02 | 456 | 443 | 108.3 |
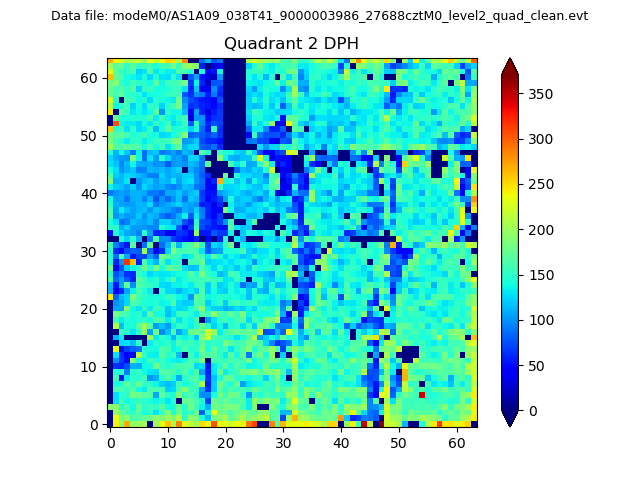
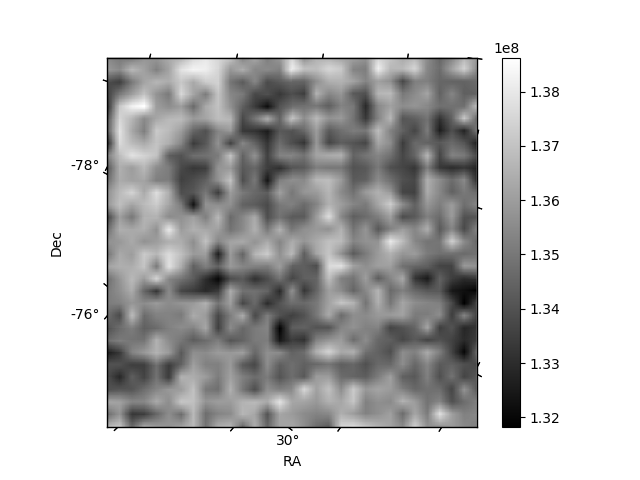
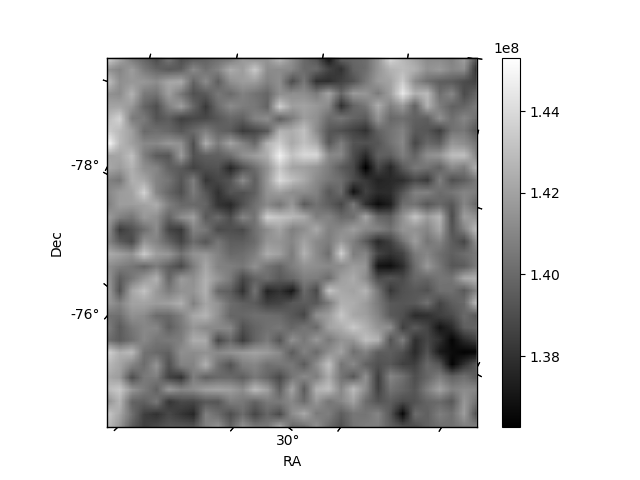
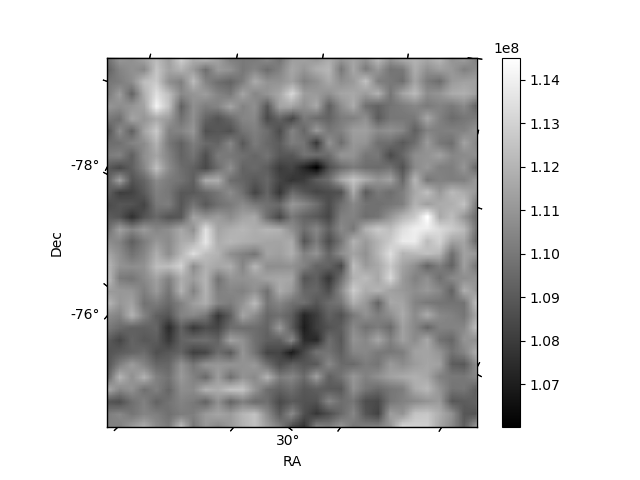
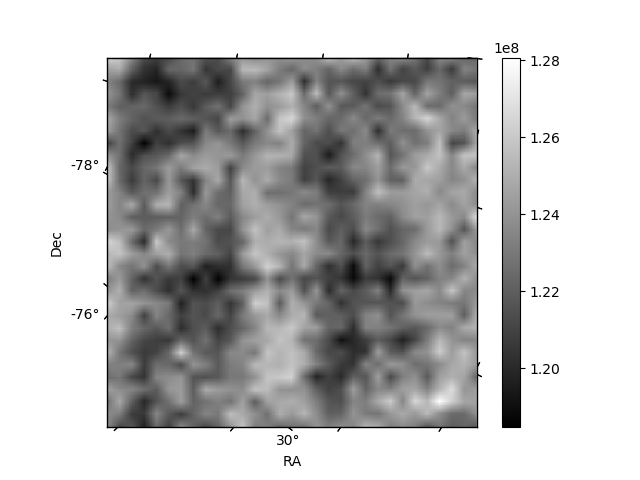
Histogram calculated using DETX and DETY for each event in the final _common_clean file
| Quadrant A | 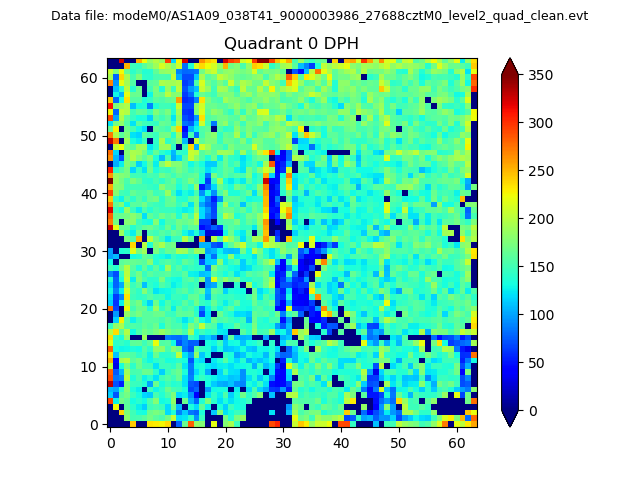 |
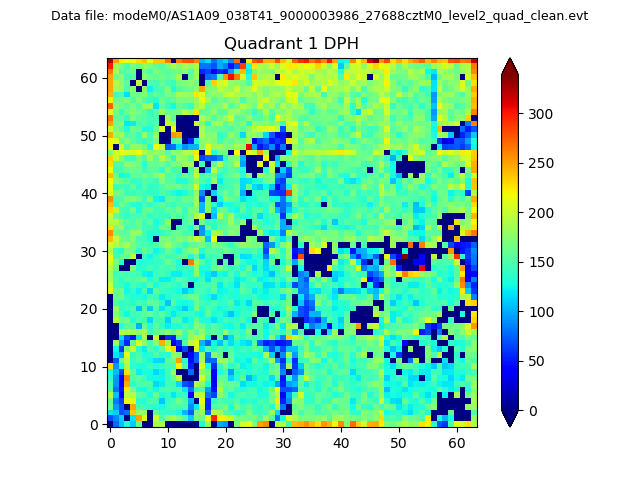 |
Quadrant B |
|---|---|---|---|
| Quadrant D | 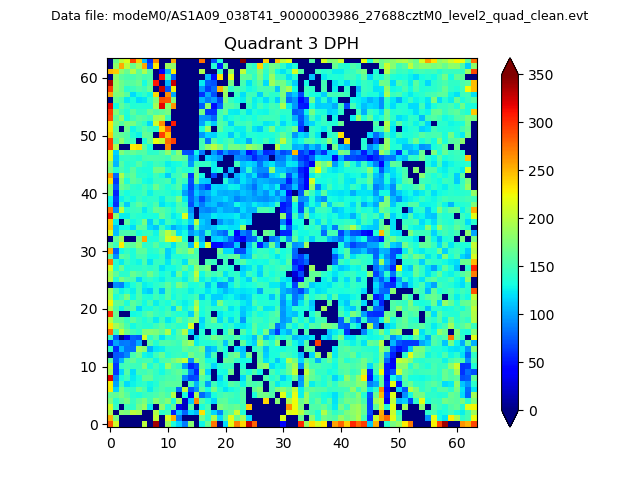 |
 |
Quadrant C |
| Plot type | Count rate plots | Images |
|---|---|---|
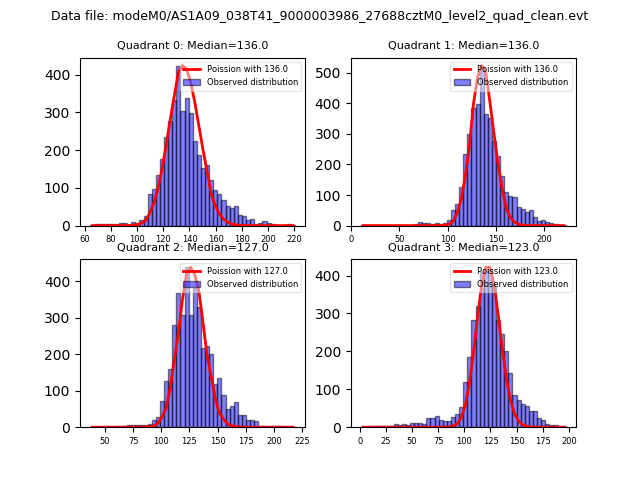
| Comparison with Poisson distribution Blue bars denote a histogram of data divided into 1 sec bins. Red curve is a Poisson curve with rate = median count rate of data. |
 |
 |
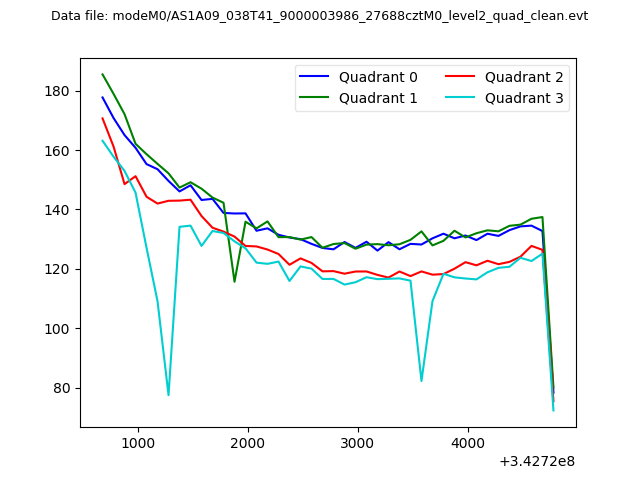
| Quadrant-wise count rates Data is divided into 100 sec bins |
 |
|
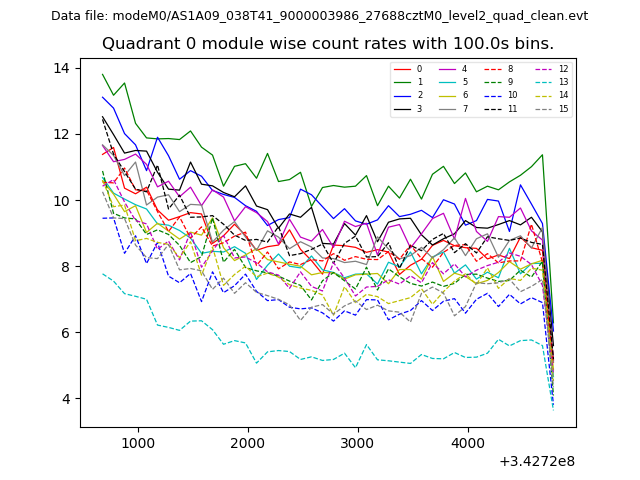
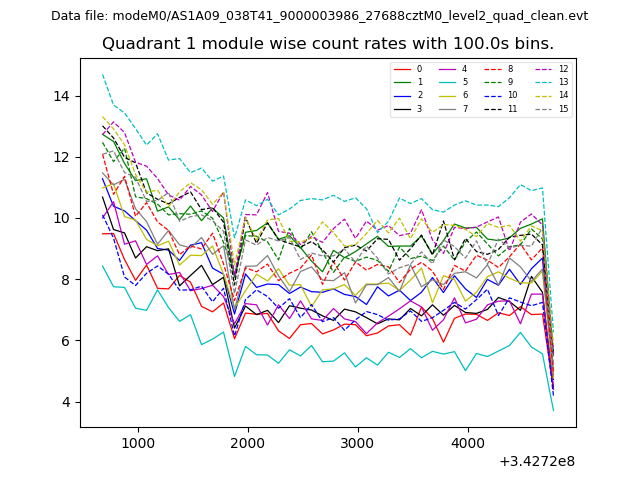
| Module-wise count rates for Quadrant A Data is divided into 100 sec bins |
 |
 |
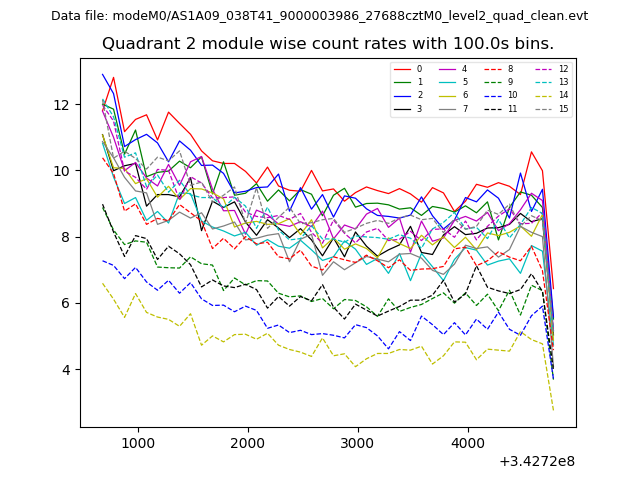
| Module-wise count rates for Quadrant B Data is divided into 100 sec bins |
 |
 |
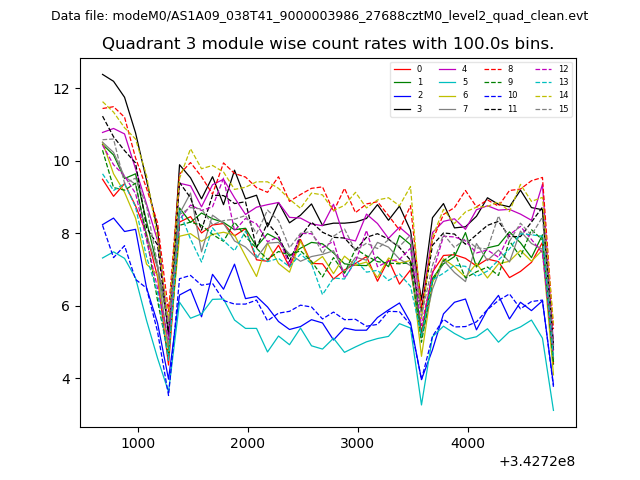
| Module-wise count rates for Quadrant C Data is divided into 100 sec bins |
 |
 |
| Module-wise count rates for Quadrant D Data is divided into 100 sec bins |
 |
 |
| Parameter | Plot |
|---|---|
| CZT HV Monitor | 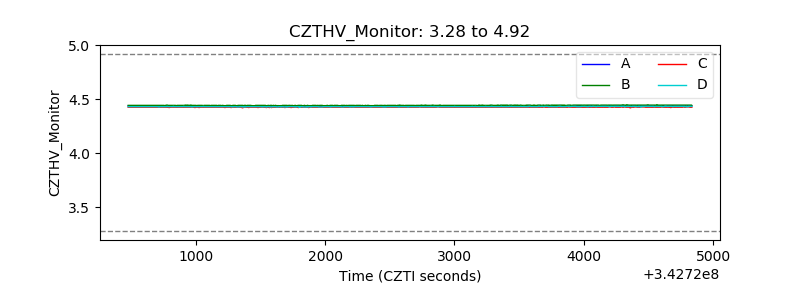 |
| D_VDD | 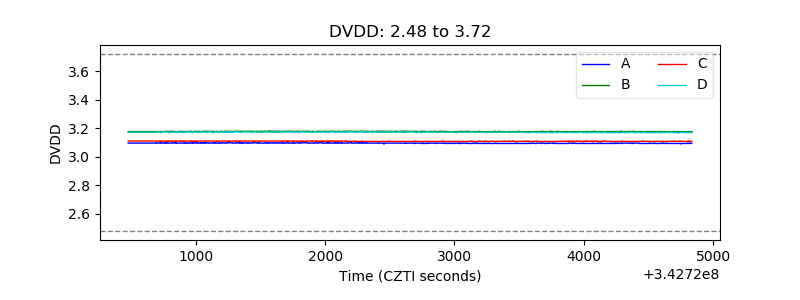 |
| Temperature 1 | 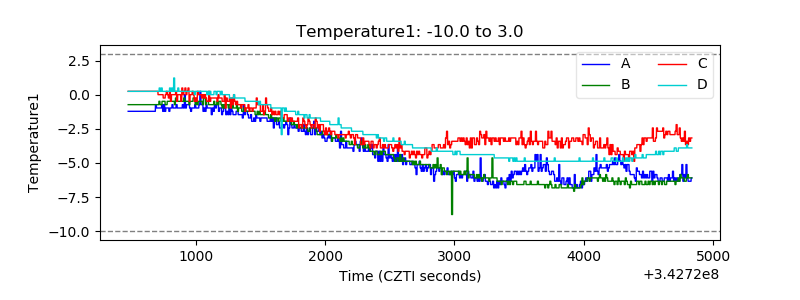 |
| Veto HV Monitor |  |
| Veto LLD | 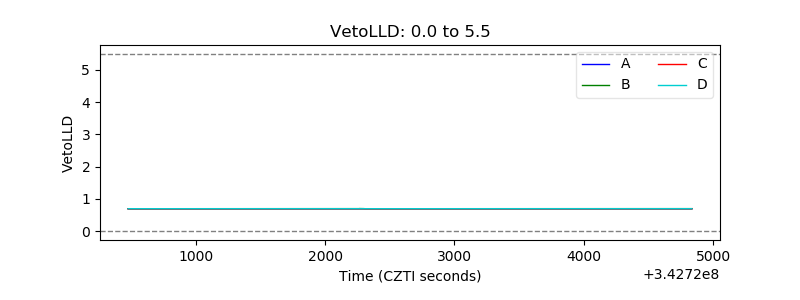 |
| Alpha Counter | 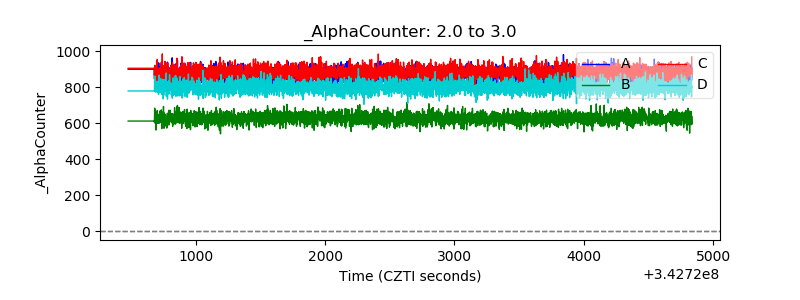 |
| _CPM_Rate | 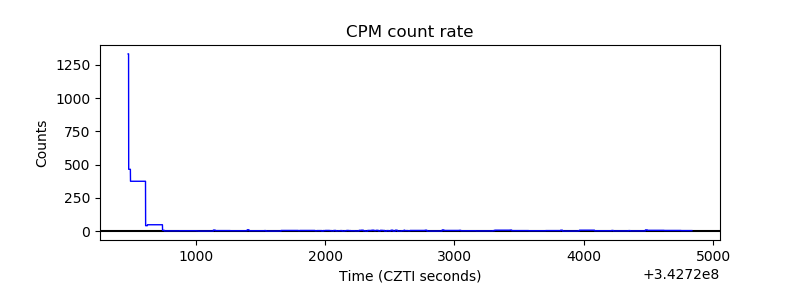 |
| CZT Counter | 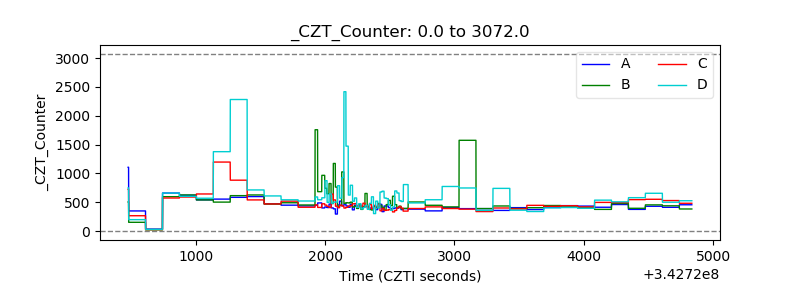 |
| +2.5 Volts monitor |  |
| +5 Volts monitor | 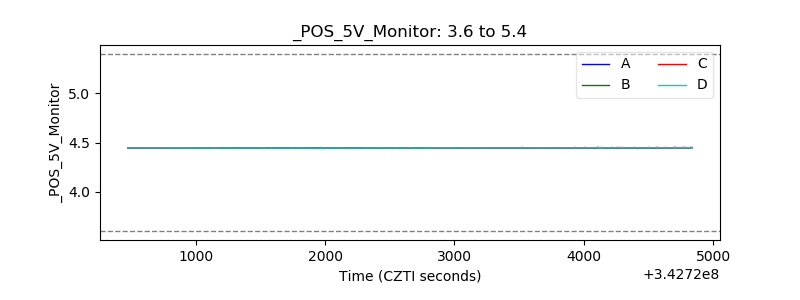 |
| _ROLL_ROT | 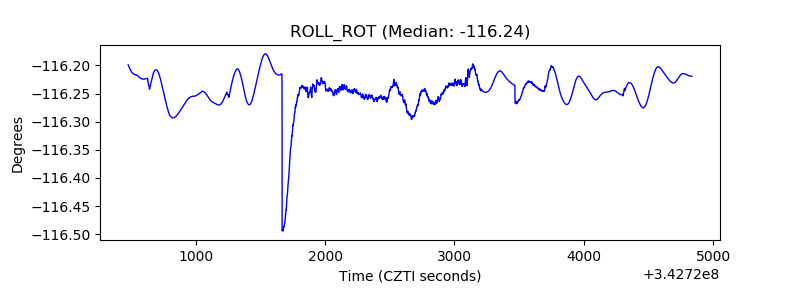 |
| _Roll_DEC | 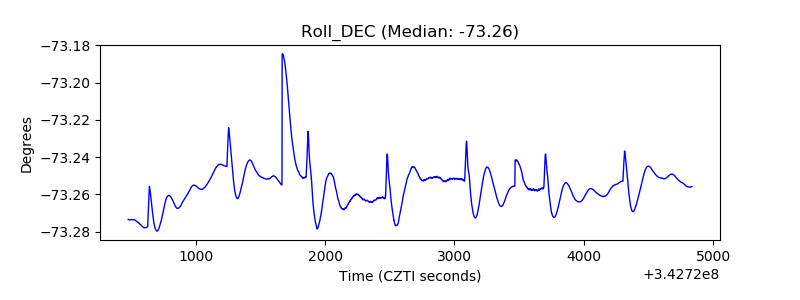 |
| _Roll_RA | 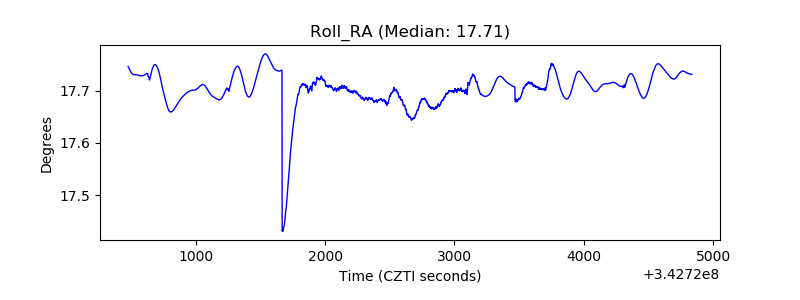 |
| Veto Counter | 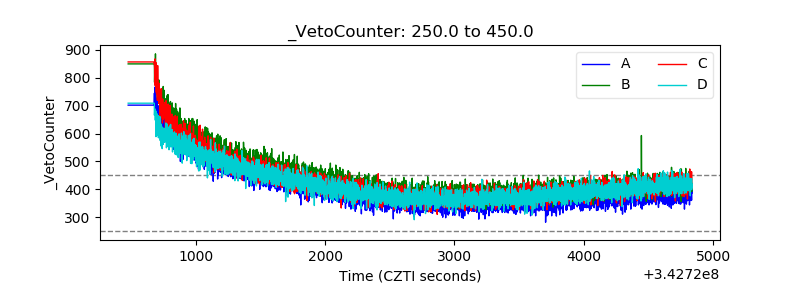 |