| Param | Original file | Final file |
|---|---|---|
| Filename | modeM0/AS1A09_038T41_9000003986_27689cztM0_level2.evt | modeM0/AS1A09_038T41_9000003986_27689cztM0_level2_quad_clean.evt |
| Size (bytes) | 385,289,280 | 96,756,480 |
| Size | 367.4 MB | 92.3 MB |
| Events in quadrant A | 2,310,607 | 672,886 |
| Events in quadrant B | 2,655,043 | 679,611 |
| Events in quadrant C | 2,516,938 | 633,481 |
| Events in quadrant D | 3,852,547 | 600,480 |
| Mode M0 | |||
|---|---|---|---|
| Quadrant | BADHDUFLAG | Total packets | Discarded packets |
| A | 0 | 10235 | 0 |
| B | 0 | 11221 | 0 |
| C | 0 | 10818 | 0 |
| D | 0 | 14828 | 0 |
| Mode M9 | |||
|---|---|---|---|
| Quadrant | BADHDUFLAG | Total packets | Discarded packets |
| A | 0 | 11 | 0 |
| B | 0 | 11 | 0 |
| C | 0 | 11 | 0 |
| D | 0 | 11 | 0 |
| Quadrant | Total seconds | Saturated seconds | Saturation percentage |
|---|---|---|---|
| A | 4906 | 42 | 0.856095% |
| B | 4906 | 110 | 2.242152% |
| C | 4906 | 80 | 1.630656% |
| D | 4906 | 433 | 8.825927% |
Noise dominated data is calculated using 1-second bins in cleaned event files. If a bin has >2000 counts, and if more than 50% of those come from <1% of pixels, then it is considered to be noise-dominated and hence unusable.
| Quadrant | # 1 sec bins | Bins with >0 counts | Bins with >2000 counts | High rate bins dominated by noise | Noise dominated (total time) | Noise dominated (detector-on time) | Marked lightcurve |
|---|---|---|---|---|---|---|---|
| A | 5961 | 4906 | 1 | 1 | 0.02% | 0.02% | 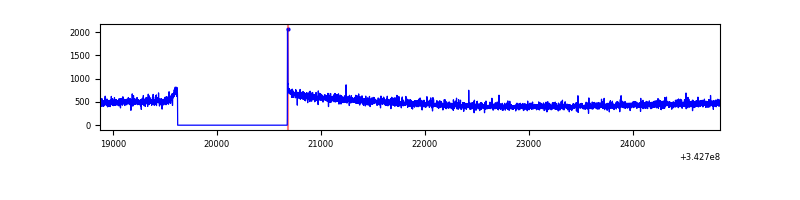 |
| B | 5961 | 4906 | 43 | 43 | 0.72% | 0.88% | 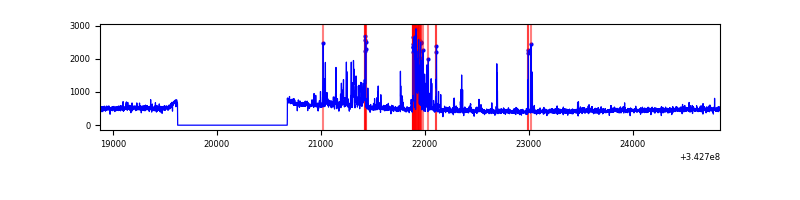 |
| C | 5961 | 4906 | 15 | 15 | 0.25% | 0.31% | 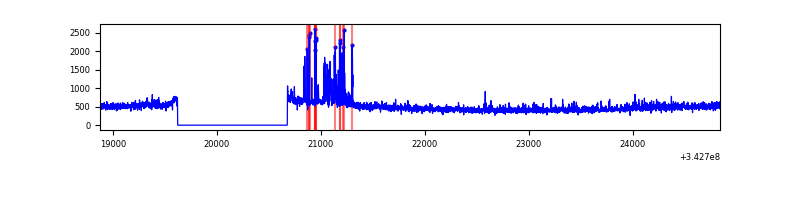 |
| D | 5961 | 4906 | 401 | 401 | 6.73% | 8.17% | 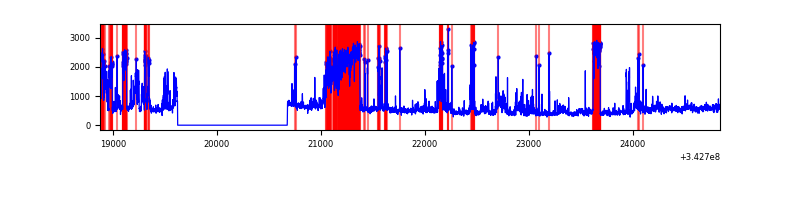 |
Top three noisy pixels from each quadrant. If the there are fewer than three noisy pixels in the level2.evt file, extra rows are filled as -1
| Pixel properties | Quadrant properties | ||||||
|---|---|---|---|---|---|---|---|
| Quadrant | DetID | PixID | Counts | Sigma | Mean | Median | Sigma |
| A | 13 | 254 | 8528 | 66.95 | 596 | 584 | 118.6 |
| A | 8 | 192 | 6968 | 53.81 | 596 | 584 | 118.6 |
| A | 3 | 137 | 5403 | 40.62 | 596 | 584 | 118.6 |
| B | 5 | 172 | 248604 | 2212.83 | 596 | 583 | 112.1 |
| B | 3 | 64 | 30767 | 269.3 | 596 | 583 | 112.1 |
| B | 0 | 230 | 22653 | 196.91 | 596 | 583 | 112.1 |
| C | 8 | 208 | 209031 | 1578.34 | 565 | 567 | 132.1 |
| C | 14 | 238 | 92447 | 695.65 | 565 | 567 | 132.1 |
| C | 3 | 233 | 8839 | 62.63 | 565 | 567 | 132.1 |
| D | 1 | 52 | 926577 | 7049.98 | 553 | 537 | 131.4 |
| D | 6 | 112 | 542865 | 4128.77 | 553 | 537 | 131.4 |
| D | 2 | 250 | 94559 | 715.79 | 553 | 537 | 131.4 |
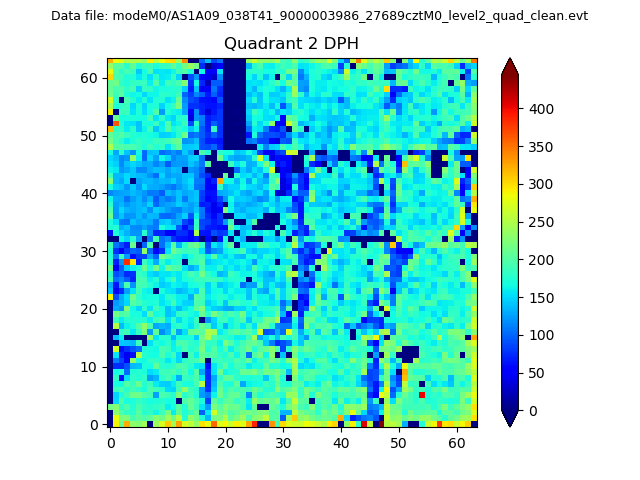
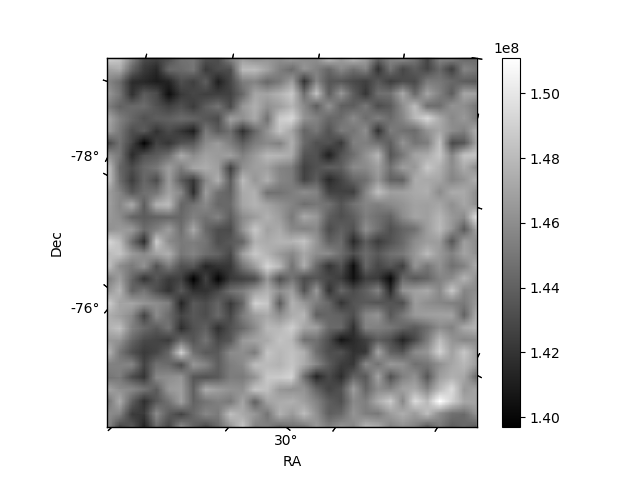
Histogram calculated using DETX and DETY for each event in the final _common_clean file
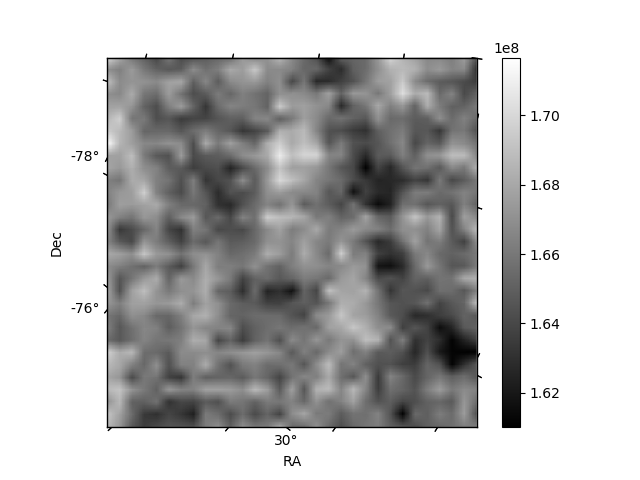
| Quadrant A | 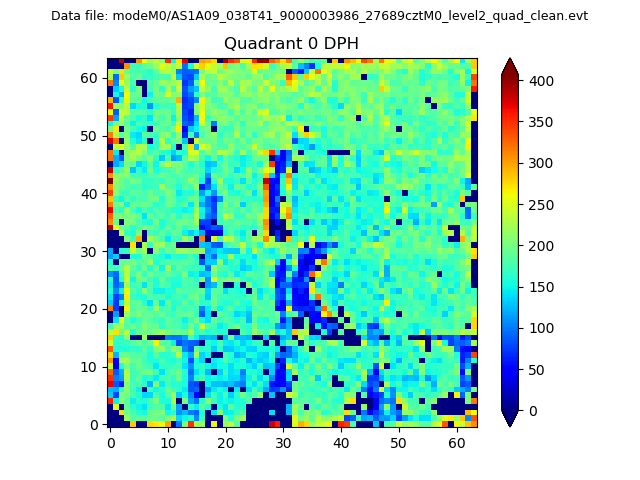 |
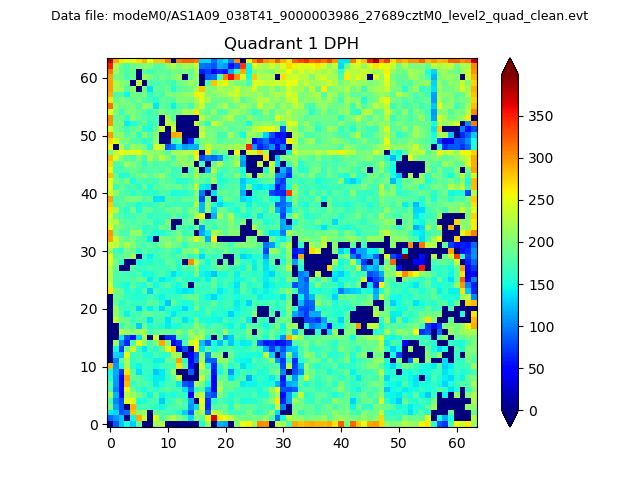 |
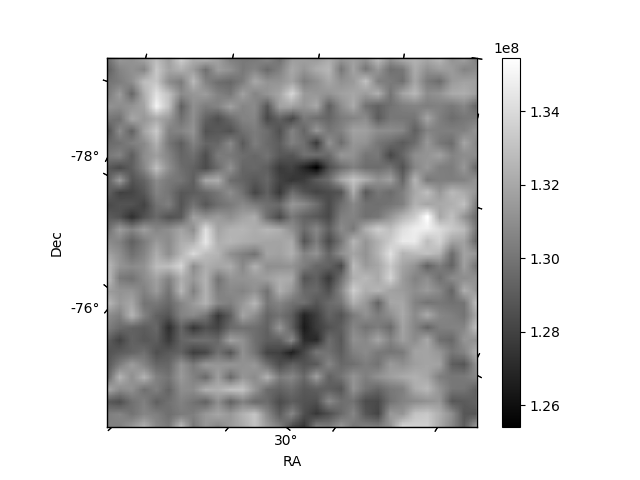
Quadrant B |
|---|---|---|---|
| Quadrant D | 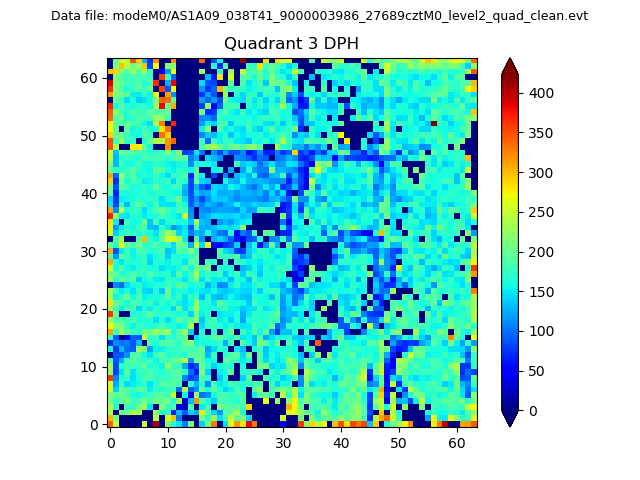 |
 |
Quadrant C |
| Plot type | Count rate plots | Images |
|---|---|---|
| Comparison with Poisson distribution Blue bars denote a histogram of data divided into 1 sec bins. Red curve is a Poisson curve with rate = median count rate of data. |
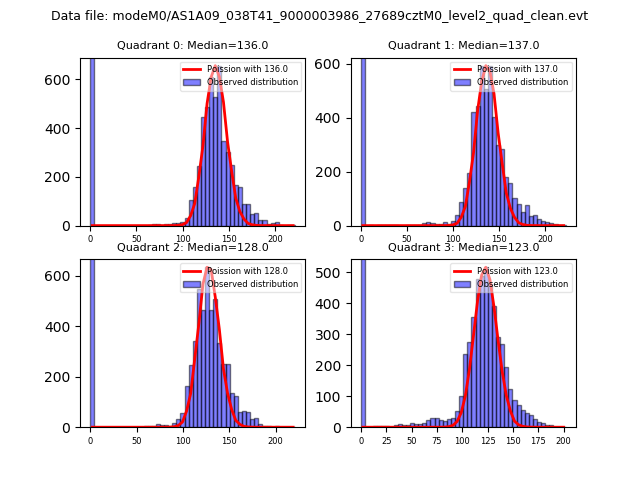 |
 |
| Quadrant-wise count rates Data is divided into 100 sec bins |
 |
|
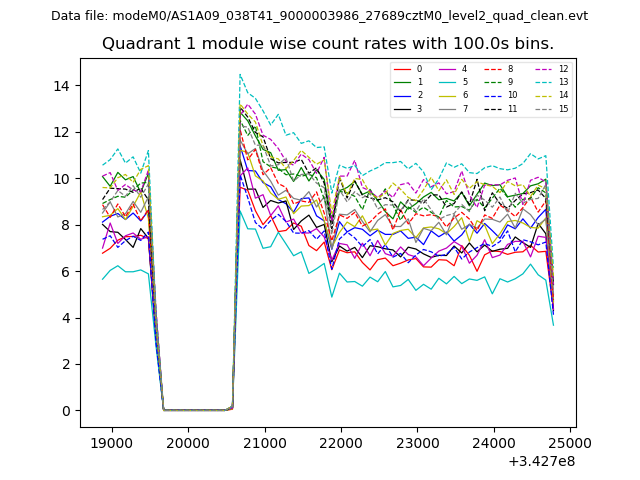
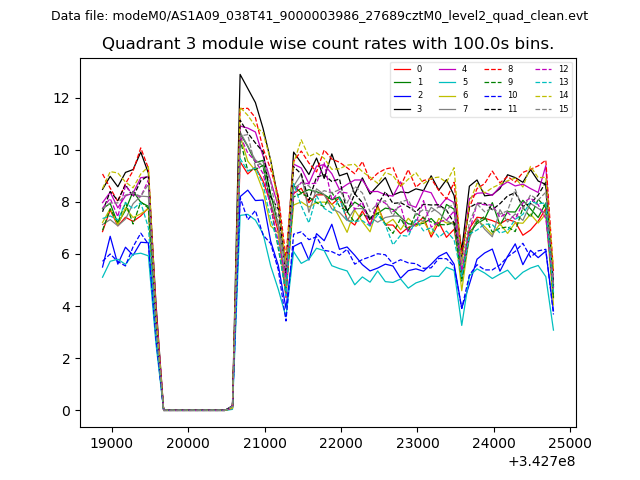
| Module-wise count rates for Quadrant A Data is divided into 100 sec bins |
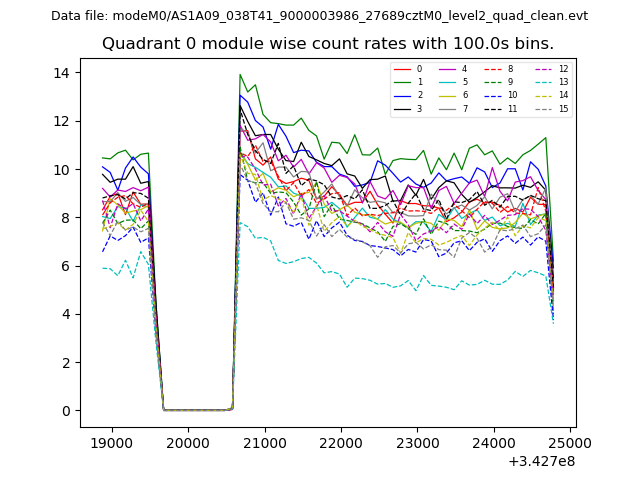 |
 |
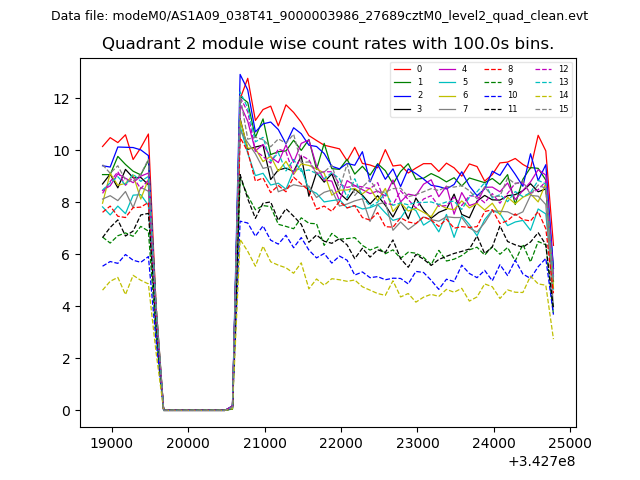
| Module-wise count rates for Quadrant B Data is divided into 100 sec bins |
 |
 |
| Module-wise count rates for Quadrant C Data is divided into 100 sec bins |
 |
 |
| Module-wise count rates for Quadrant D Data is divided into 100 sec bins |
 |
 |
| Parameter | Plot |
|---|---|
| CZT HV Monitor | 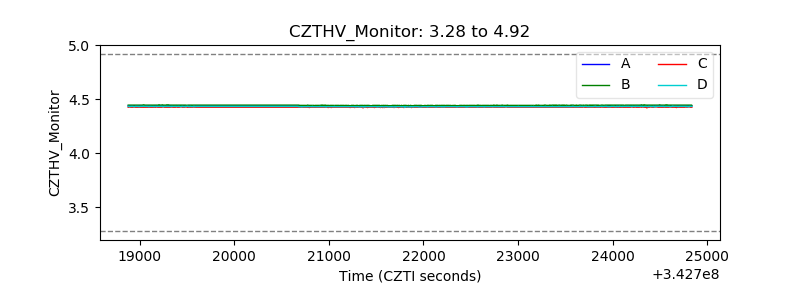 |
| D_VDD | 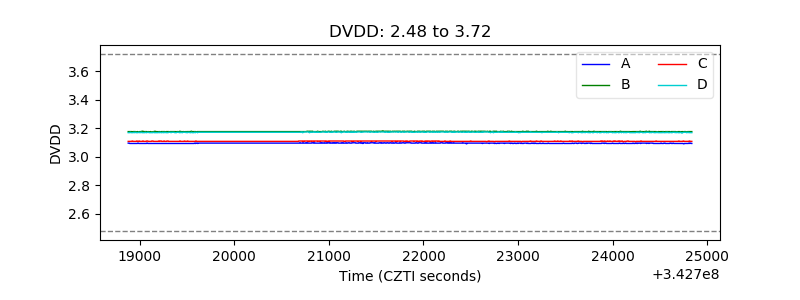 |
| Temperature 1 | 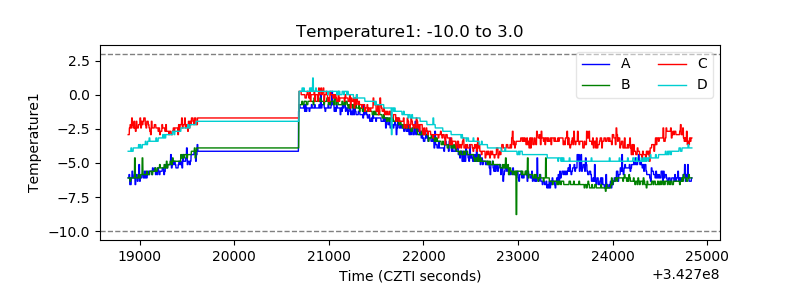 |
| Veto HV Monitor | 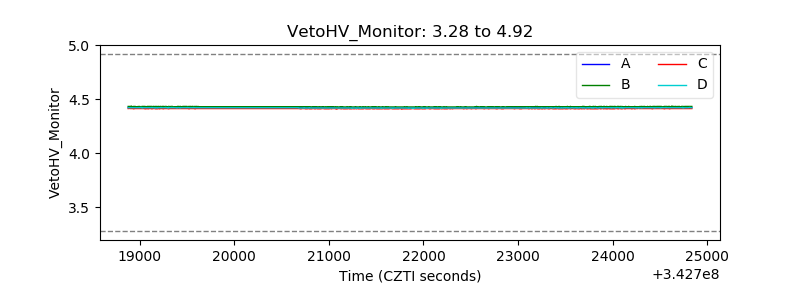 |
| Veto LLD | 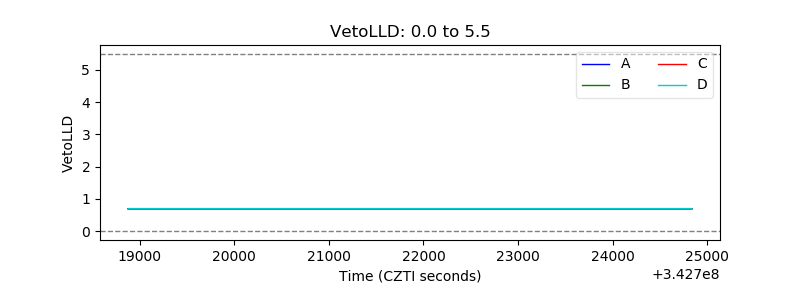 |
| Alpha Counter | 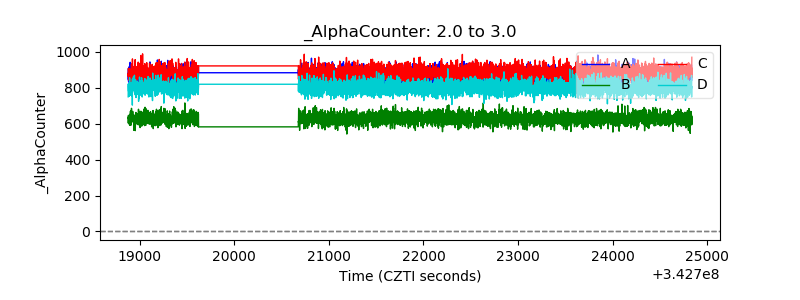 |
| _CPM_Rate |  |
| CZT Counter | 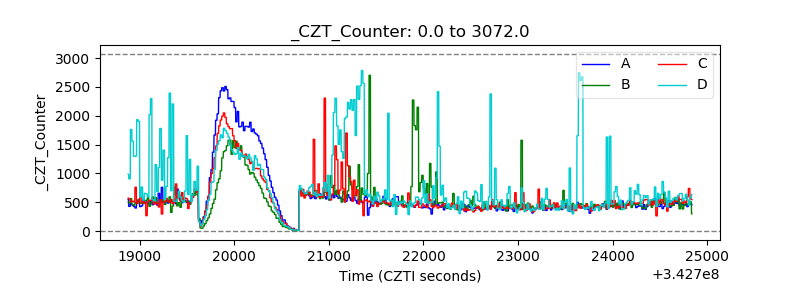 |
| +2.5 Volts monitor |  |
| +5 Volts monitor |  |
| _ROLL_ROT | 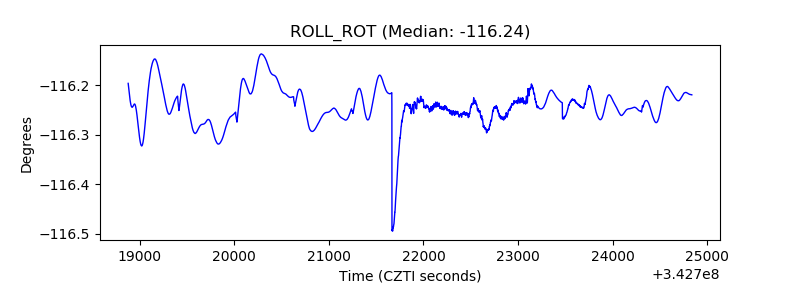 |
| _Roll_DEC | 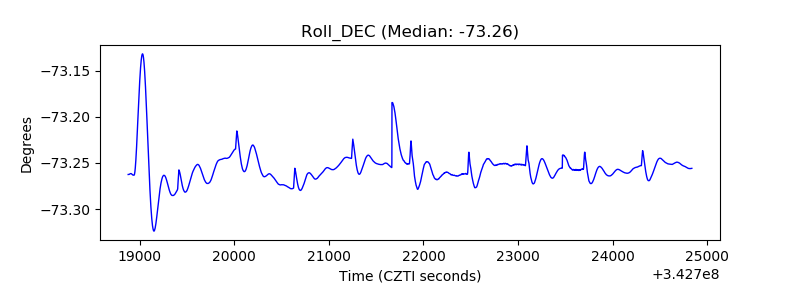 |
| _Roll_RA | 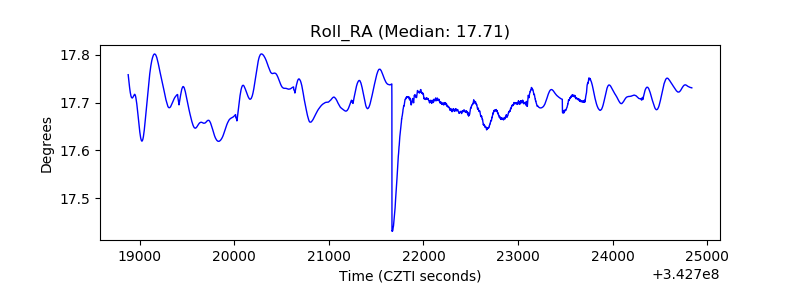 |
| Veto Counter | 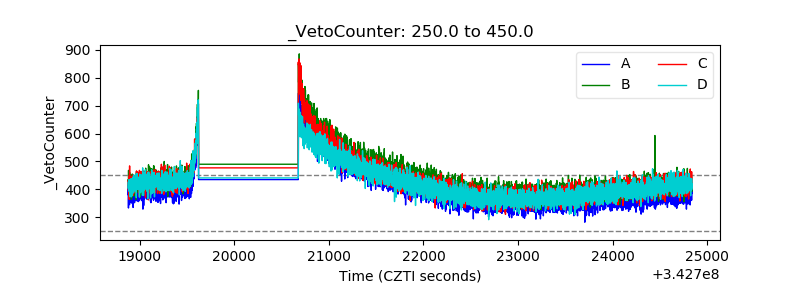 |