| Param | Original file | Final file |
|---|---|---|
| Filename | modeM0/AS1T03_262T01_9000003988cztM0_level2.fits | modeM0/AS1T03_262T01_9000003988cztM0_level2_quad_clean.evt |
| Size (bytes) | 1,502,959,680 | 1,236,297,600 |
| Size | 1.4 GB | 1.2 GB |
| Events in quadrant A | 9,342,694 | 7,147,719 |
| Events in quadrant B | 8,901,174 | 7,037,714 |
| Events in quadrant C | 9,058,198 | 6,791,417 |
| Events in quadrant D | 7,834,206 | 6,082,811 |
| Mode M0 | |||
|---|---|---|---|
| Quadrant | BADHDUFLAG | Total packets | Discarded packets |
| A | 0 | 315641 | 0 |
| B | 0 | 330691 | 0 |
| C | 0 | 322282 | 0 |
| D | 0 | 382021 | 0 |
| Mode SS | |||
|---|---|---|---|
| Quadrant | BADHDUFLAG | Total packets | Discarded packets |
| A | 0 | 3094 | 0 |
| B | 0 | 3092 | 0 |
| C | 0 | 3094 | 0 |
| D | 0 | 3094 | 0 |
| Mode M9 | |||
|---|---|---|---|
| Quadrant | BADHDUFLAG | Total packets | Discarded packets |
| A | 0 | 252 | 0 |
| B | 0 | 252 | 0 |
| C | 0 | 252 | 0 |
| D | 0 | 252 | 0 |
| Quadrant | Total seconds | Saturated seconds | Saturation percentage |
|---|---|---|---|
| A | 151482 | 1749 | 1.154593% |
| B | 151482 | 2720 | 1.795593% |
| C | 151482 | 2743 | 1.810776% |
| D | 151482 | 6007 | 3.965488% |
Noise dominated data is calculated using 1-second bins in cleaned event files. If a bin has >2000 counts, and if more than 50% of those come from <1% of pixels, then it is considered to be noise-dominated and hence unusable.
| Quadrant | # 1 sec bins | Bins with >0 counts | Bins with >2000 counts | High rate bins dominated by noise | Noise dominated (total time) | Noise dominated (detector-on time) | Marked lightcurve |
|---|---|---|---|---|---|---|---|
| A | 176131 | 151454 | 0 | 0 | 0.00% | 0.00% |  |
| B | 176131 | 151450 | 0 | 0 | 0.00% | 0.00% | 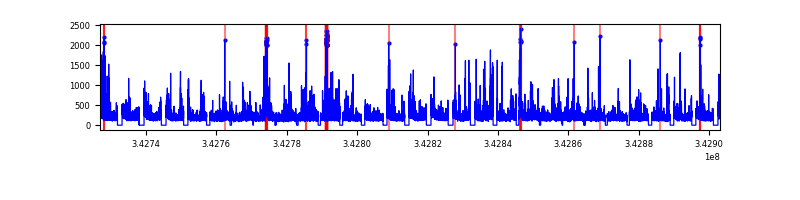 |
| C | 176131 | 151455 | 0 | 0 | 0.00% | 0.00% | 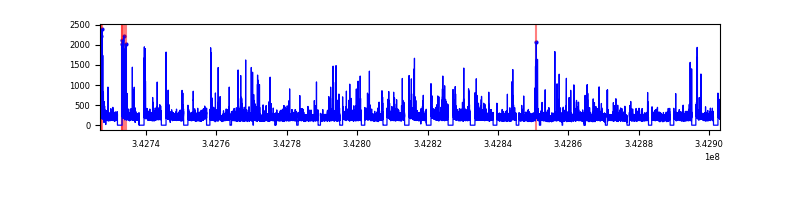 |
| D | 176131 | 151043 | 0 | 0 | 0.00% | 0.00% |  |
Top three noisy pixels from each quadrant. If the there are fewer than three noisy pixels in the level2.evt file, extra rows are filled as -1
| Pixel properties | Quadrant properties | ||||||
|---|---|---|---|---|---|---|---|
| Quadrant | DetID | PixID | Counts | Sigma | Mean | Median | Sigma |
| A | 0 | 29 | 7720 | 9.15 | 2434 | 2293 | 593.0 |
| A | 7 | 110 | 7443 | 8.68 | 2434 | 2293 | 593.0 |
| A | 9 | 19 | 6969 | 7.89 | 2434 | 2293 | 593.0 |
| B | 2 | 9 | 7010 | 10.45 | 2356 | 2250 | 455.3 |
| B | 5 | 128 | 5941 | 8.11 | 2356 | 2250 | 455.3 |
| B | 2 | 8 | 5821 | 7.84 | 2356 | 2250 | 455.3 |
| C | 12 | 241 | 6273 | 6.67 | 2398 | 2249 | 603.4 |
| C | 3 | 187 | 6011 | 6.23 | 2398 | 2249 | 603.4 |
| C | 9 | 209 | 6006 | 6.23 | 2398 | 2249 | 603.4 |
| D | 3 | 14 | 5624 | 6.06 | 2236 | 2039 | 591.3 |
| D | 15 | 46 | 5598 | 6.02 | 2236 | 2039 | 591.3 |
| D | 10 | 189 | 5591 | 6.01 | 2236 | 2039 | 591.3 |
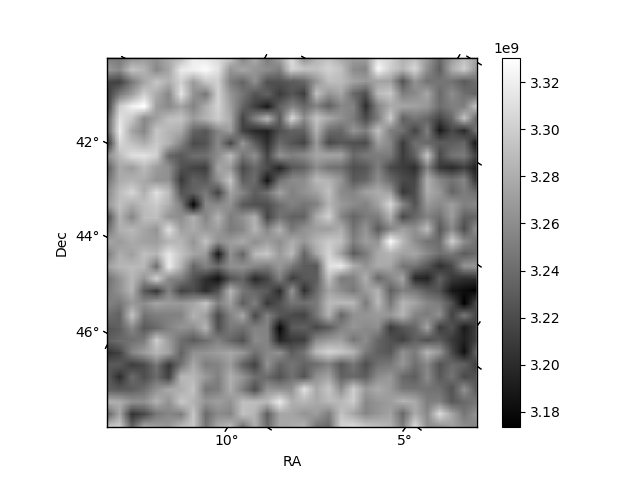
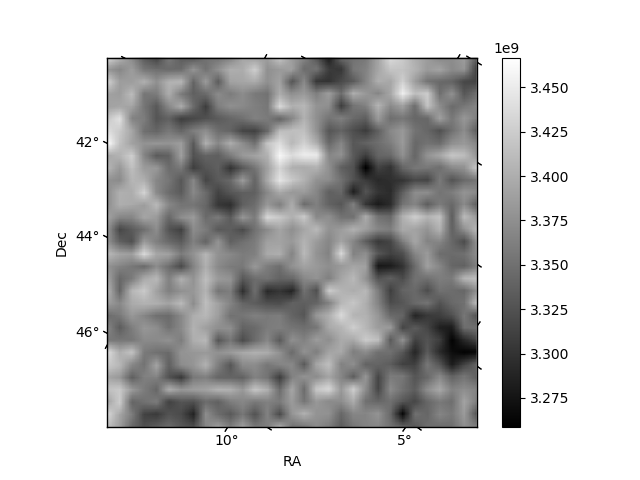
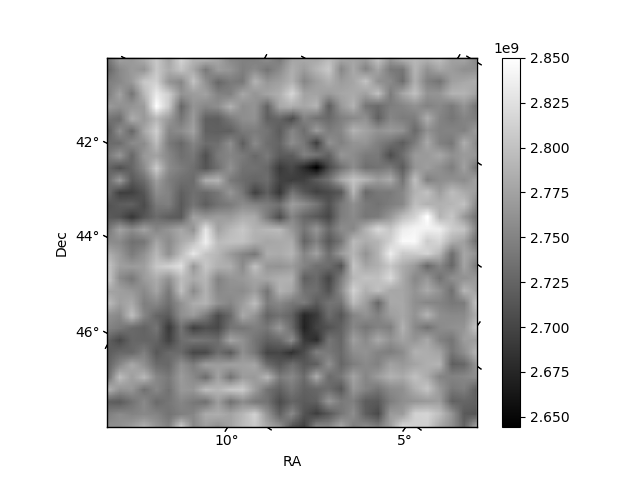
Histogram calculated using DETX and DETY for each event in the final _common_clean file
| Quadrant A | 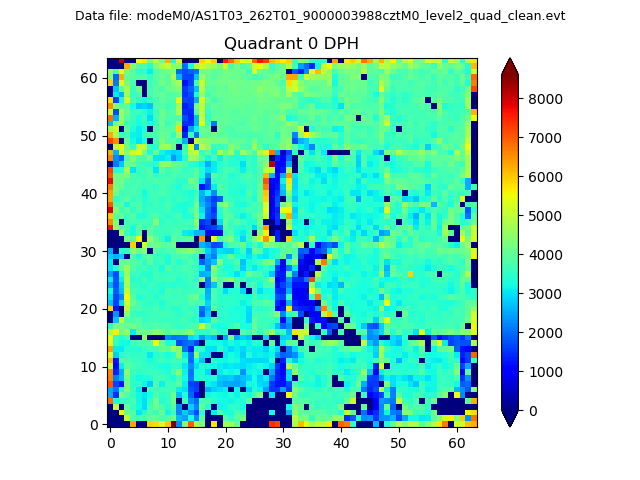 |
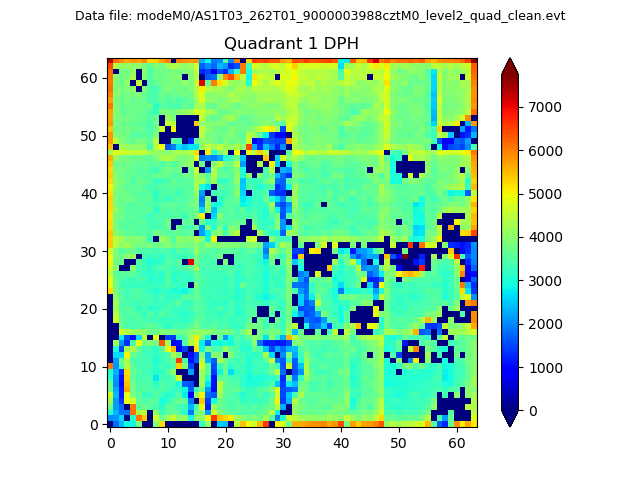 |
Quadrant B |
|---|---|---|---|
| Quadrant D |  |
 |
Quadrant C |
| Plot type | Count rate plots | Images |
|---|---|---|
| Comparison with Poisson distribution Blue bars denote a histogram of data divided into 1 sec bins. Red curve is a Poisson curve with rate = median count rate of data. |
 |
 |
| Quadrant-wise count rates Data is divided into 100 sec bins |
 |
|
| Module-wise count rates for Quadrant A Data is divided into 100 sec bins |
 |
 |
| Module-wise count rates for Quadrant B Data is divided into 100 sec bins |
 |
 |
| Module-wise count rates for Quadrant C Data is divided into 100 sec bins |
 |
 |
| Module-wise count rates for Quadrant D Data is divided into 100 sec bins |
 |
 |
| Parameter | Plot |
|---|---|
| CZT HV Monitor |  |
| D_VDD |  |
| Temperature 1 |  |
| Veto HV Monitor |  |
| Veto LLD | 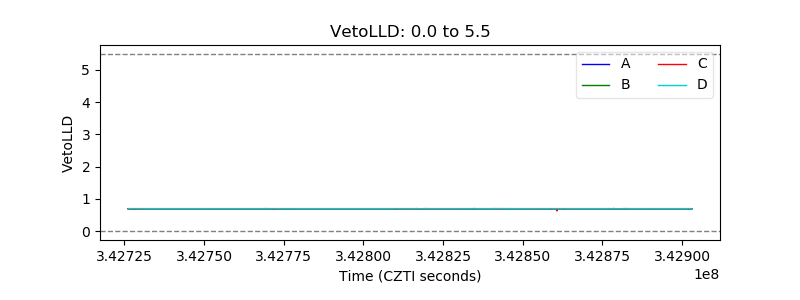 |
| Alpha Counter | 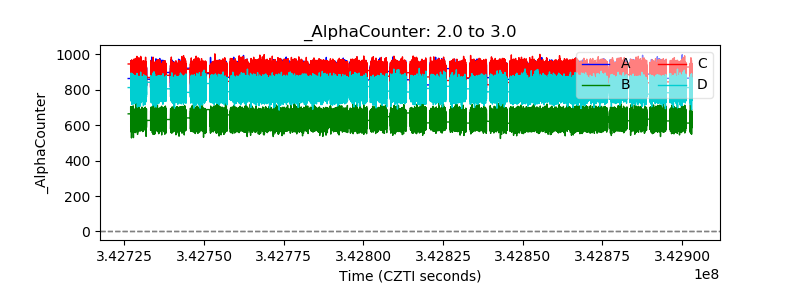 |
| _CPM_Rate |  |
| CZT Counter |  |
| +2.5 Volts monitor |  |
| +5 Volts monitor |  |
| _ROLL_ROT |  |
| _Roll_DEC | 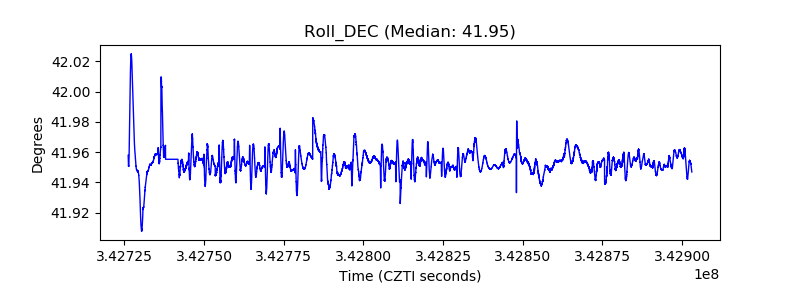 |
| _Roll_RA | 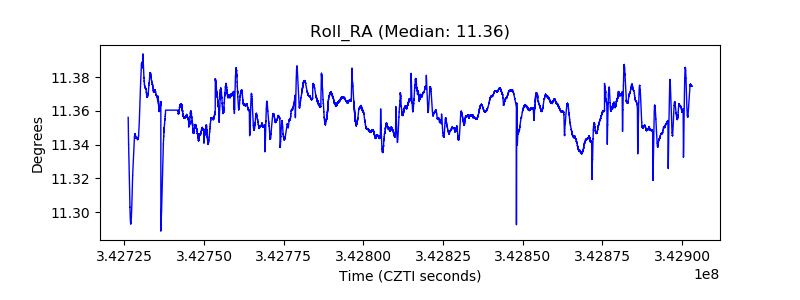 |
| Veto Counter |  |