| Param | Original file | Final file |
|---|---|---|
| Filename | modeM0/AS1T03_262T01_9000003988_27688cztM0_level2.evt | modeM0/AS1T03_262T01_9000003988_27688cztM0_level2_quad_clean.evt |
| Size (bytes) | 160,551,360 | 31,357,440 |
| Size | 153.1 MB | 29.9 MB |
| Events in quadrant A | 1,002,758 | 224,599 |
| Events in quadrant B | 1,338,196 | 205,939 |
| Events in quadrant C | 944,462 | 218,259 |
| Events in quadrant D | 1,484,336 | 200,758 |
| Mode M0 | |||
|---|---|---|---|
| Quadrant | BADHDUFLAG | Total packets | Discarded packets |
| A | 0 | 3933 | 0 |
| B | 0 | 4913 | 0 |
| C | 0 | 3758 | 0 |
| D | 0 | 5363 | 0 |
| Mode M9 | |||
|---|---|---|---|
| Quadrant | BADHDUFLAG | Total packets | Discarded packets |
| A | 0 | 8 | 0 |
| B | 0 | 8 | 0 |
| C | 0 | 8 | 0 |
| D | 0 | 8 | 0 |
| Quadrant | Total seconds | Saturated seconds | Saturation percentage |
|---|---|---|---|
| A | 1325 | 69 | 5.207547% |
| B | 1325 | 259 | 19.547170% |
| C | 1325 | 69 | 5.207547% |
| D | 1325 | 178 | 13.433962% |
Noise dominated data is calculated using 1-second bins in cleaned event files. If a bin has >2000 counts, and if more than 50% of those come from <1% of pixels, then it is considered to be noise-dominated and hence unusable.
| Quadrant | # 1 sec bins | Bins with >0 counts | Bins with >2000 counts | High rate bins dominated by noise | Noise dominated (total time) | Noise dominated (detector-on time) | Marked lightcurve |
|---|---|---|---|---|---|---|---|
| A | 1325 | 1325 | 43 | 43 | 3.25% | 3.25% | 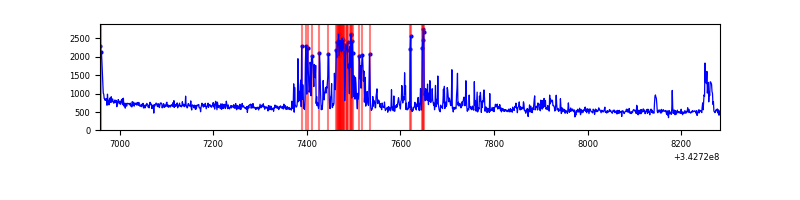 |
| B | 1325 | 1325 | 201 | 201 | 15.17% | 15.17% | 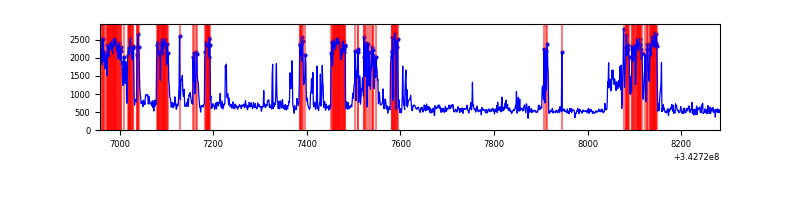 |
| C | 1325 | 1325 | 23 | 23 | 1.74% | 1.74% | 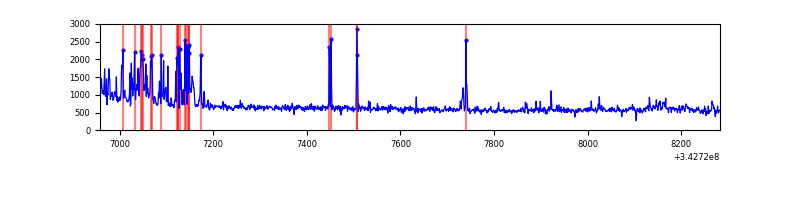 |
| D | 1325 | 1325 | 130 | 130 | 9.81% | 9.81% | 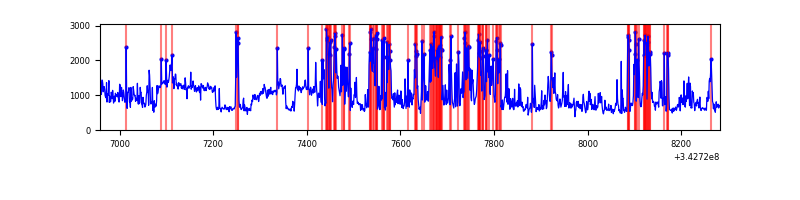 |
Top three noisy pixels from each quadrant. If the there are fewer than three noisy pixels in the level2.evt file, extra rows are filled as -1
| Pixel properties | Quadrant properties | ||||||
|---|---|---|---|---|---|---|---|
| Quadrant | DetID | PixID | Counts | Sigma | Mean | Median | Sigma |
| A | 0 | 13 | 219795 | 5451.04 | 197 | 193 | 40.3 |
| A | 13 | 248 | 15480 | 379.46 | 197 | 193 | 40.3 |
| A | 8 | 192 | 7506 | 181.53 | 197 | 193 | 40.3 |
| B | 5 | 172 | 610877 | 17604.85 | 177 | 173 | 34.7 |
| B | 0 | 244 | 20284 | 579.74 | 177 | 173 | 34.7 |
| B | 0 | 229 | 9866 | 279.42 | 177 | 173 | 34.7 |
| C | 8 | 208 | 93368 | 2047.08 | 190 | 192 | 45.5 |
| C | 0 | 207 | 38648 | 844.88 | 190 | 192 | 45.5 |
| C | 3 | 233 | 32943 | 719.54 | 190 | 192 | 45.5 |
| D | 11 | 176 | 201051 | 4331.1 | 188 | 183 | 46.4 |
| D | 1 | 52 | 190432 | 4102.14 | 188 | 183 | 46.4 |
| D | 12 | 6 | 189052 | 4072.38 | 188 | 183 | 46.4 |
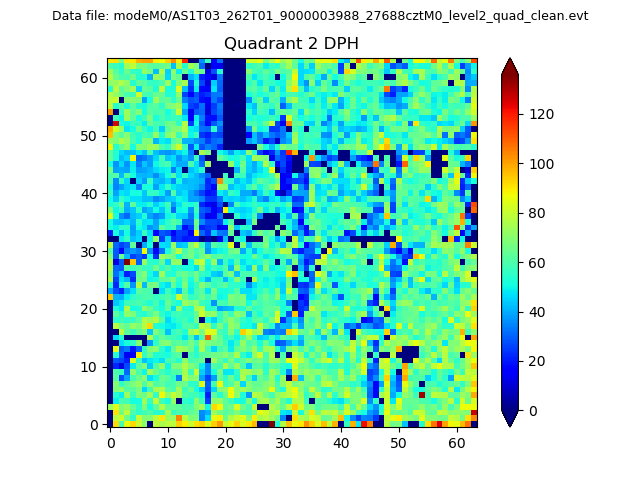
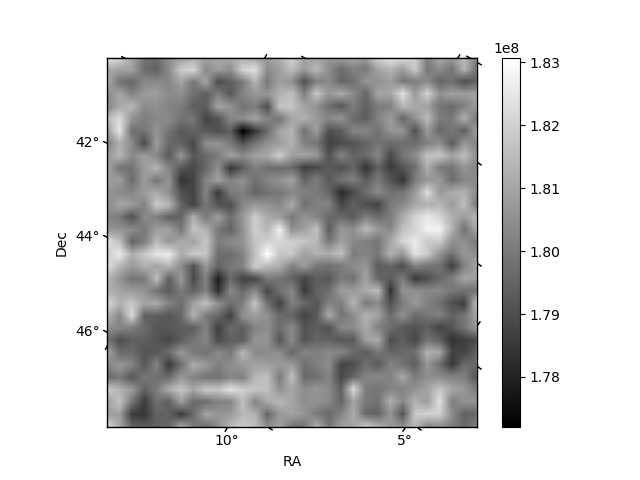
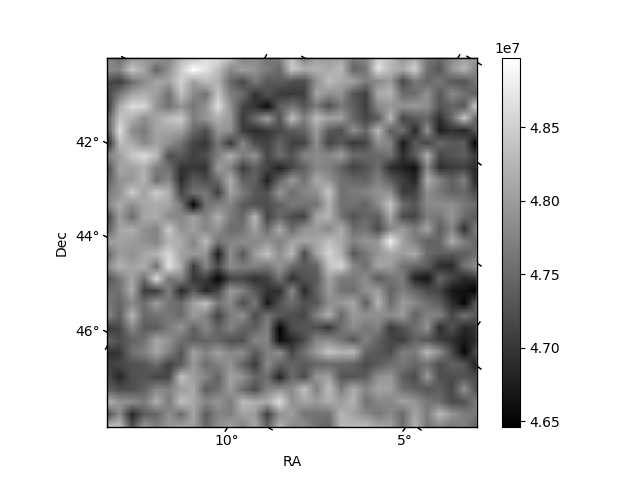
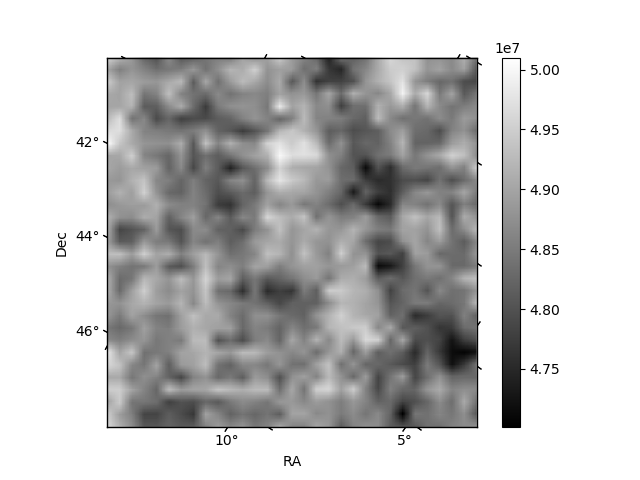
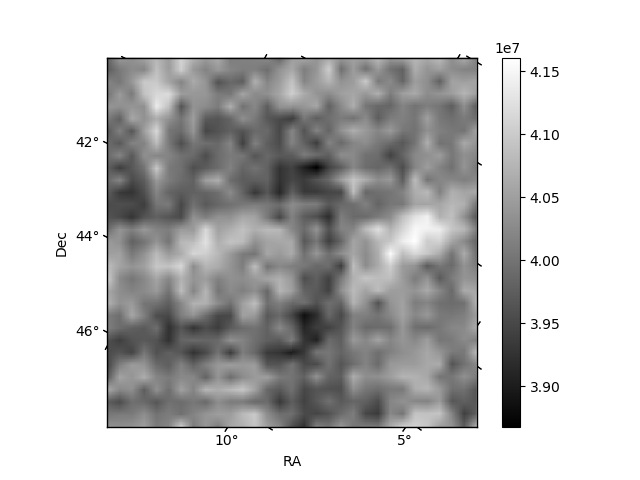
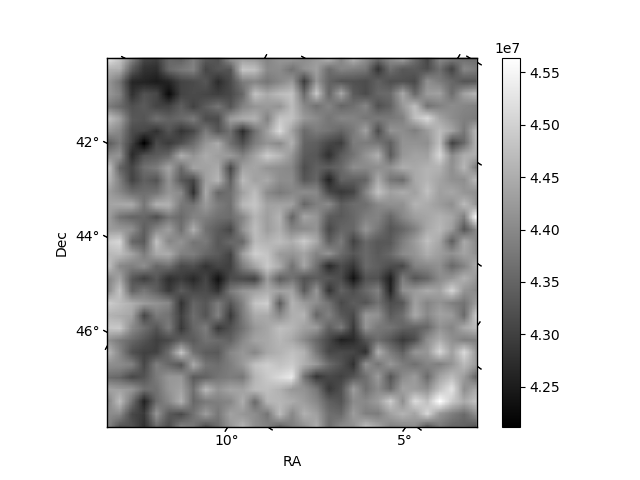
Histogram calculated using DETX and DETY for each event in the final _common_clean file
| Quadrant A | 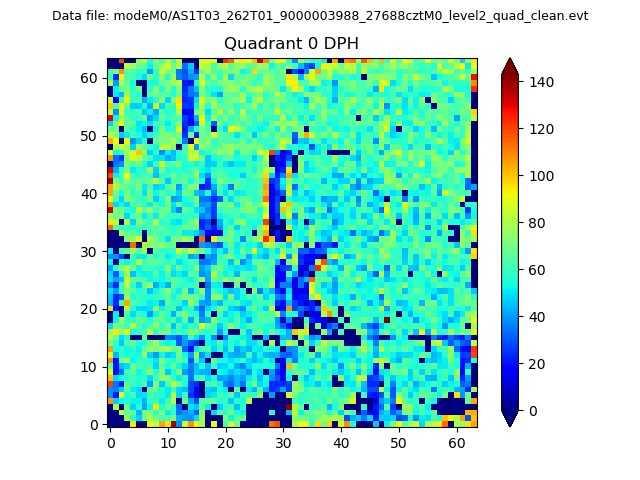 |
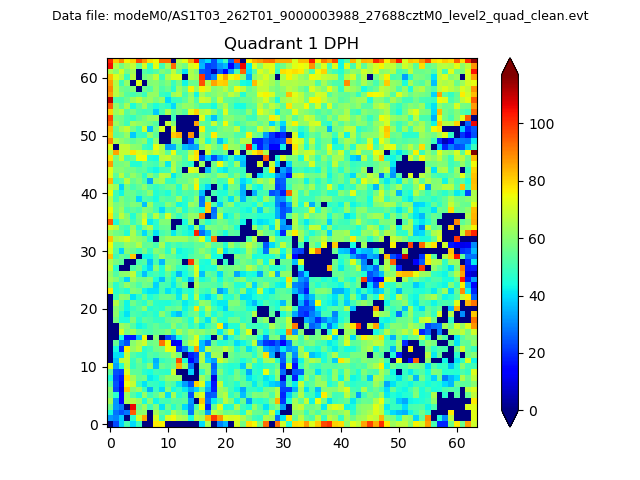 |
Quadrant B |
|---|---|---|---|
| Quadrant D | 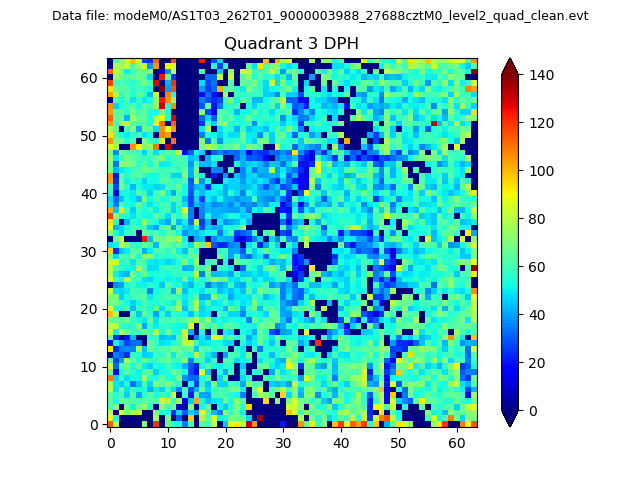 |
 |
Quadrant C |
| Plot type | Count rate plots | Images |
|---|---|---|
| Comparison with Poisson distribution Blue bars denote a histogram of data divided into 1 sec bins. Red curve is a Poisson curve with rate = median count rate of data. |
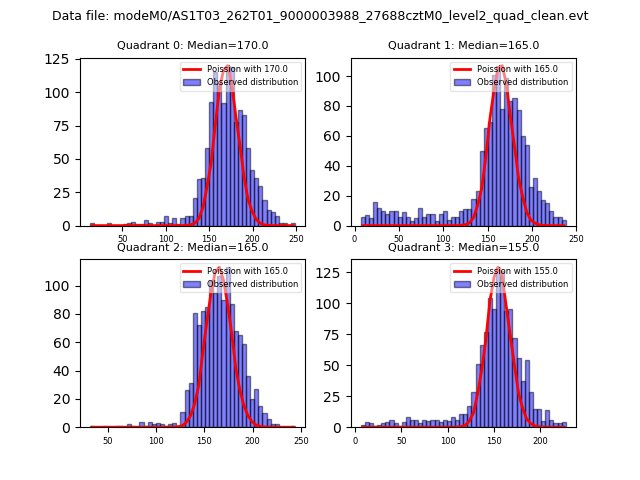 |
 |
| Quadrant-wise count rates Data is divided into 100 sec bins |
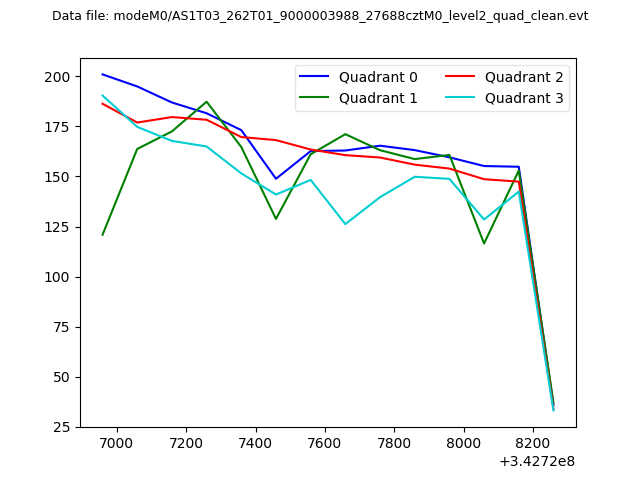 |
|
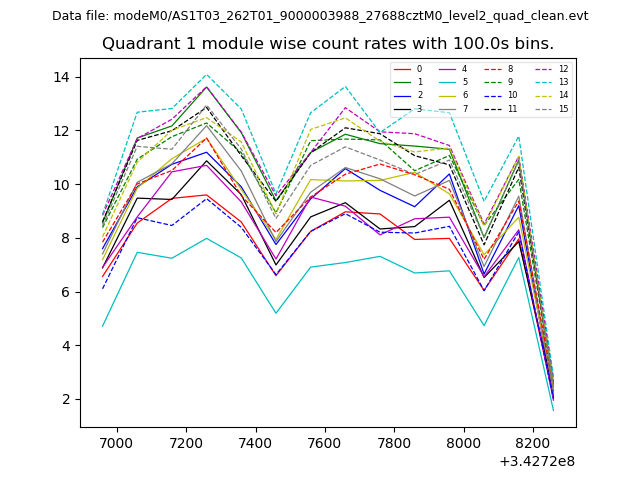
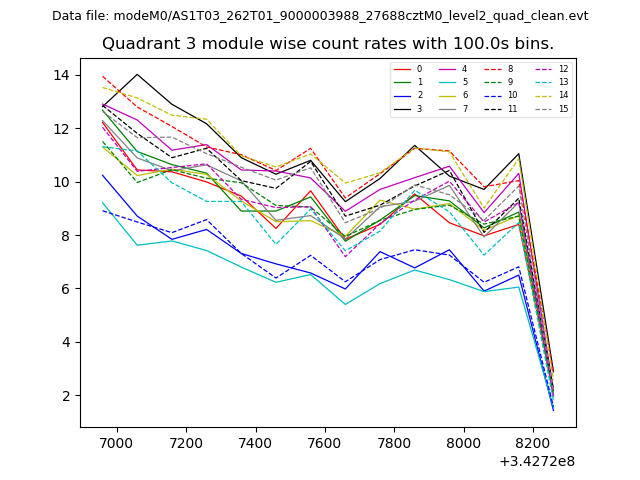
| Module-wise count rates for Quadrant A Data is divided into 100 sec bins |
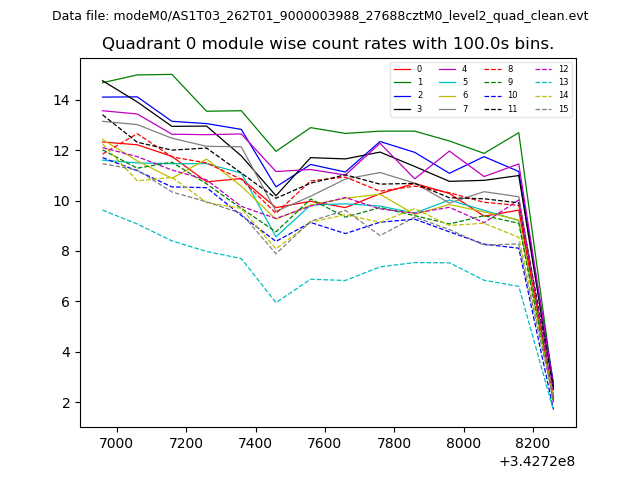 |
 |
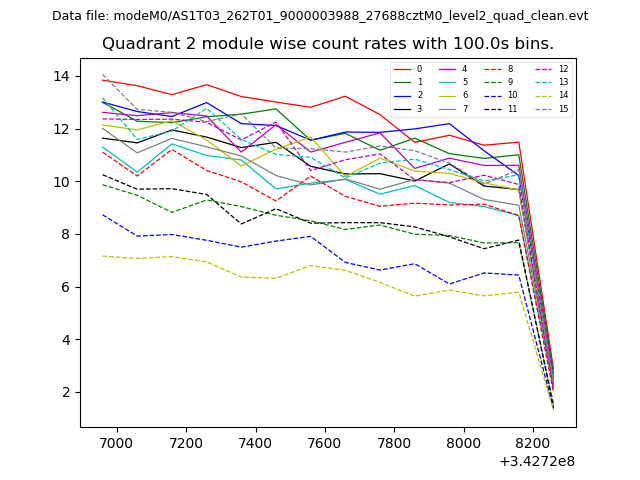
| Module-wise count rates for Quadrant B Data is divided into 100 sec bins |
 |
 |
| Module-wise count rates for Quadrant C Data is divided into 100 sec bins |
 |
 |
| Module-wise count rates for Quadrant D Data is divided into 100 sec bins |
 |
 |
| Parameter | Plot |
|---|---|
| CZT HV Monitor | 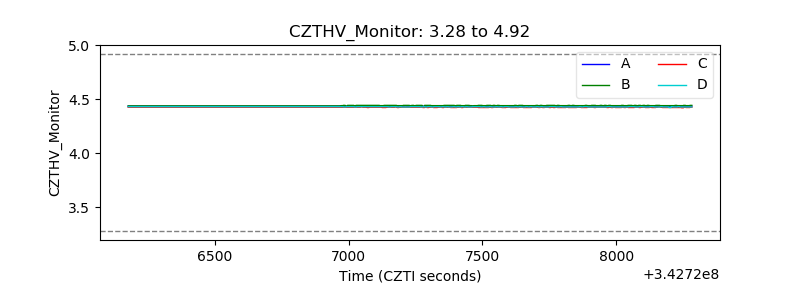 |
| D_VDD | 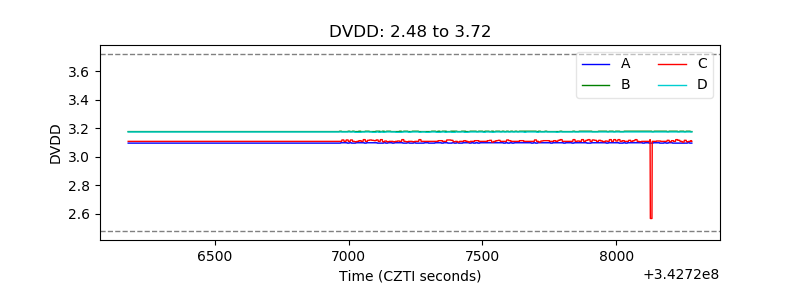 |
| Temperature 1 | 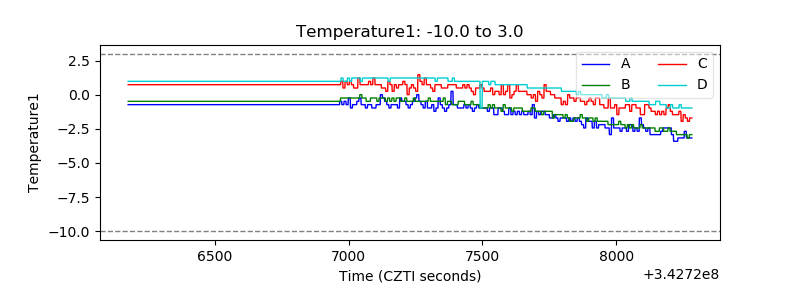 |
| Veto HV Monitor | 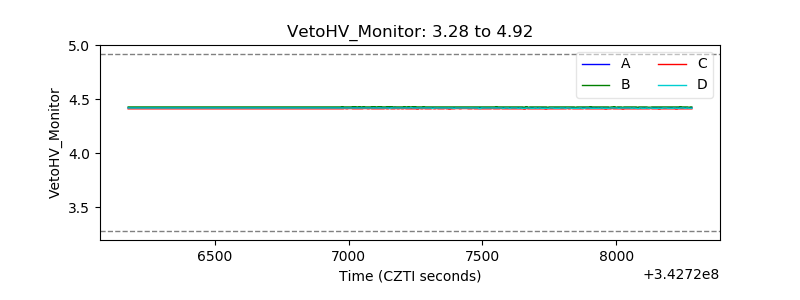 |
| Veto LLD | 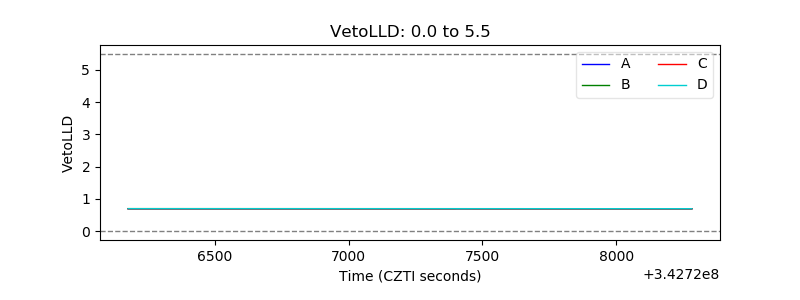 |
| Alpha Counter | 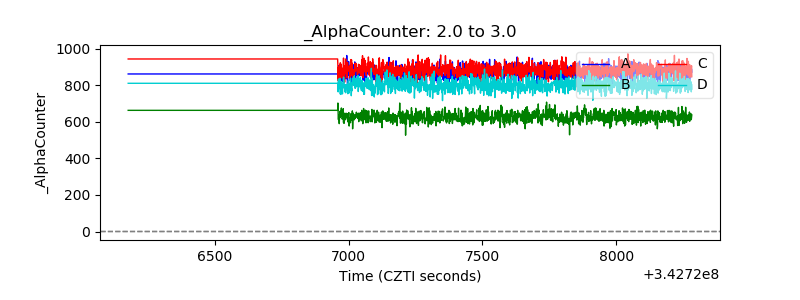 |
| _CPM_Rate | 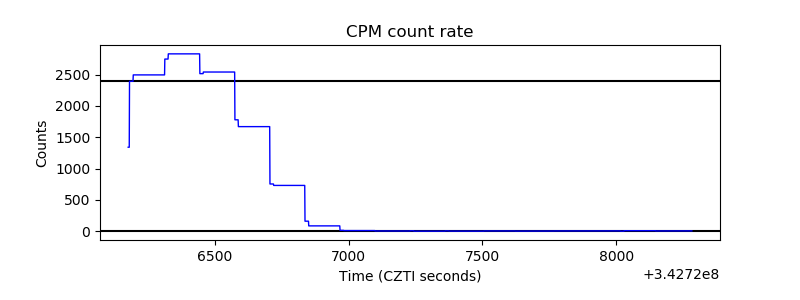 |
| CZT Counter | 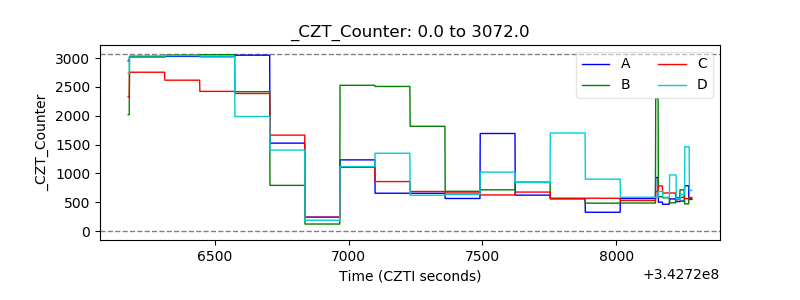 |
| +2.5 Volts monitor |  |
| +5 Volts monitor | 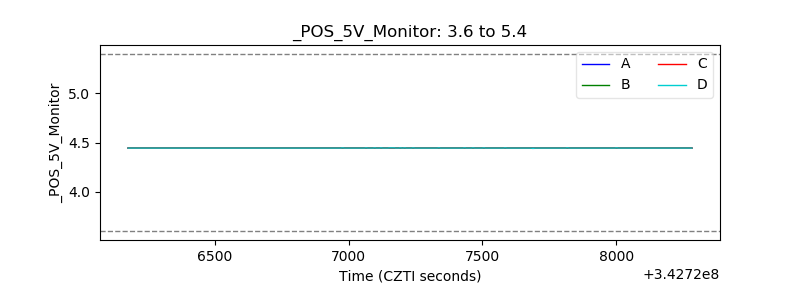 |
| _ROLL_ROT | 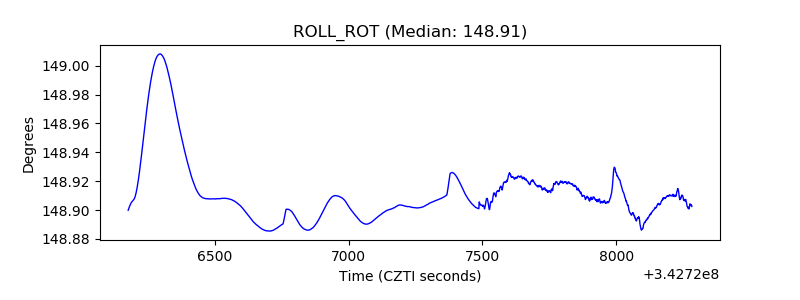 |
| _Roll_DEC | 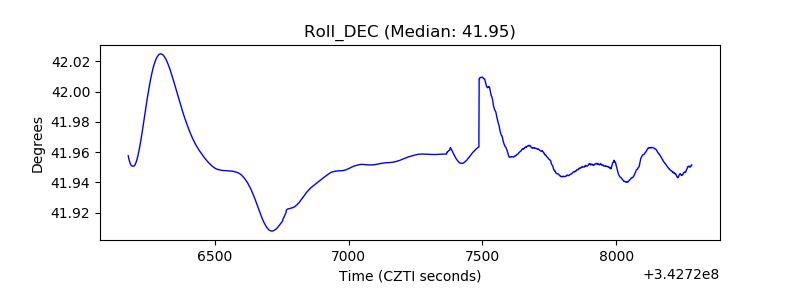 |
| _Roll_RA | 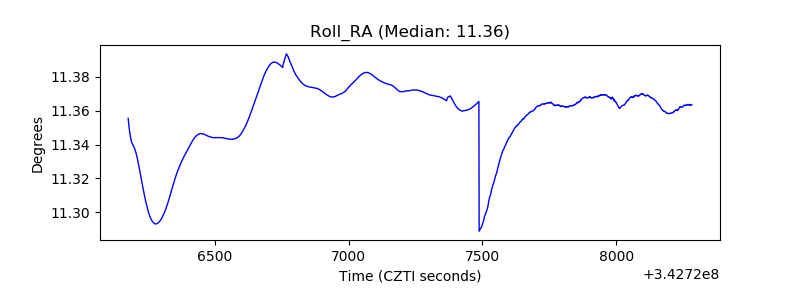 |
| Veto Counter | 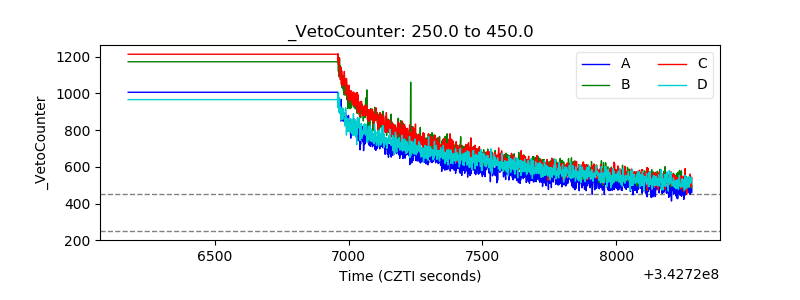 |