| Param | Original file | Final file |
|---|---|---|
| Filename | modeM0/AS1T03_262T01_9000003988_27689cztM0_level2.evt | modeM0/AS1T03_262T01_9000003988_27689cztM0_level2_quad_clean.evt |
| Size (bytes) | 606,617,280 | 105,477,120 |
| Size | 578.5 MB | 100.6 MB |
| Events in quadrant A | 3,537,049 | 721,275 |
| Events in quadrant B | 4,045,669 | 706,950 |
| Events in quadrant C | 3,803,313 | 697,992 |
| Events in quadrant D | 6,552,439 | 621,442 |
| Mode M0 | |||
|---|---|---|---|
| Quadrant | BADHDUFLAG | Total packets | Discarded packets |
| A | 0 | 14714 | 0 |
| B | 0 | 16177 | 0 |
| C | 0 | 15410 | 0 |
| D | 0 | 23979 | 0 |
| Mode M9 | |||
|---|---|---|---|
| Quadrant | BADHDUFLAG | Total packets | Discarded packets |
| A | 0 | 21 | 0 |
| B | 0 | 21 | 0 |
| C | 0 | 21 | 0 |
| D | 0 | 21 | 0 |
| Quadrant | Total seconds | Saturated seconds | Saturation percentage |
|---|---|---|---|
| A | 6397 | 101 | 1.578865% |
| B | 6397 | 304 | 4.752228% |
| C | 6397 | 193 | 3.017039% |
| D | 6397 | 778 | 12.161951% |
Noise dominated data is calculated using 1-second bins in cleaned event files. If a bin has >2000 counts, and if more than 50% of those come from <1% of pixels, then it is considered to be noise-dominated and hence unusable.
| Quadrant | # 1 sec bins | Bins with >0 counts | Bins with >2000 counts | High rate bins dominated by noise | Noise dominated (total time) | Noise dominated (detector-on time) | Marked lightcurve |
|---|---|---|---|---|---|---|---|
| A | 7702 | 6397 | 46 | 46 | 0.60% | 0.72% | 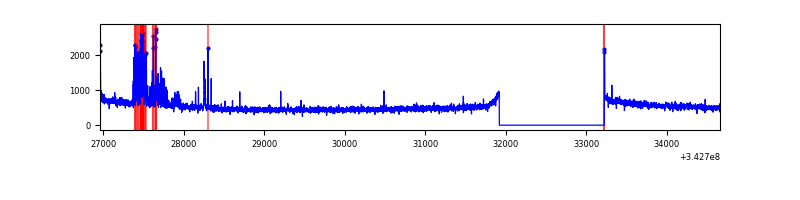 |
| B | 7702 | 6397 | 212 | 212 | 2.75% | 3.31% | 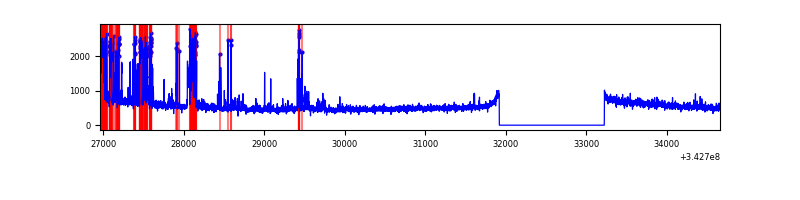 |
| C | 7702 | 6397 | 51 | 51 | 0.66% | 0.80% | 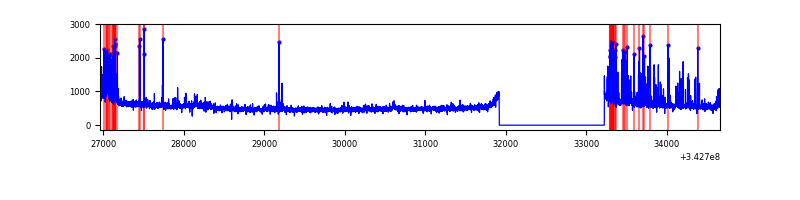 |
| D | 7702 | 6397 | 746 | 746 | 9.69% | 11.66% | 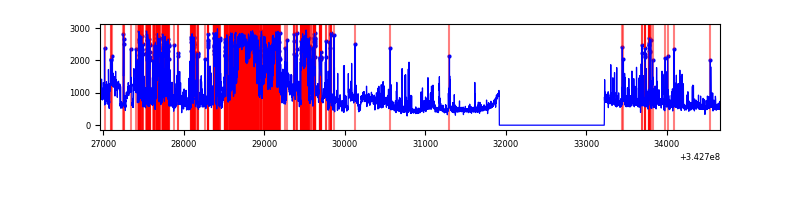 |
Top three noisy pixels from each quadrant. If the there are fewer than three noisy pixels in the level2.evt file, extra rows are filled as -1
| Pixel properties | Quadrant properties | ||||||
|---|---|---|---|---|---|---|---|
| Quadrant | DetID | PixID | Counts | Sigma | Mean | Median | Sigma |
| A | 0 | 13 | 227281 | 1350.73 | 849 | 833 | 167.6 |
| A | 13 | 248 | 19596 | 111.92 | 849 | 833 | 167.6 |
| A | 8 | 192 | 14409 | 80.98 | 849 | 833 | 167.6 |
| B | 5 | 172 | 634651 | 4157.48 | 827 | 808 | 152.5 |
| B | 0 | 230 | 75540 | 490.18 | 827 | 808 | 152.5 |
| B | 0 | 190 | 48613 | 313.56 | 827 | 808 | 152.5 |
| C | 8 | 208 | 335275 | 1768.85 | 822 | 829 | 189.1 |
| C | 14 | 238 | 130550 | 686.08 | 822 | 829 | 189.1 |
| C | 3 | 233 | 62706 | 327.26 | 822 | 829 | 189.1 |
| D | 1 | 52 | 895444 | 4764.74 | 795 | 778 | 187.8 |
| D | 12 | 2 | 870714 | 4633.04 | 795 | 778 | 187.8 |
| D | 11 | 176 | 772629 | 4110.66 | 795 | 778 | 187.8 |
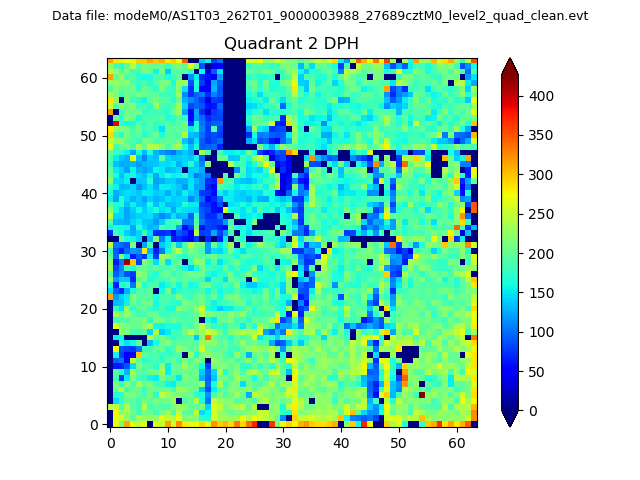
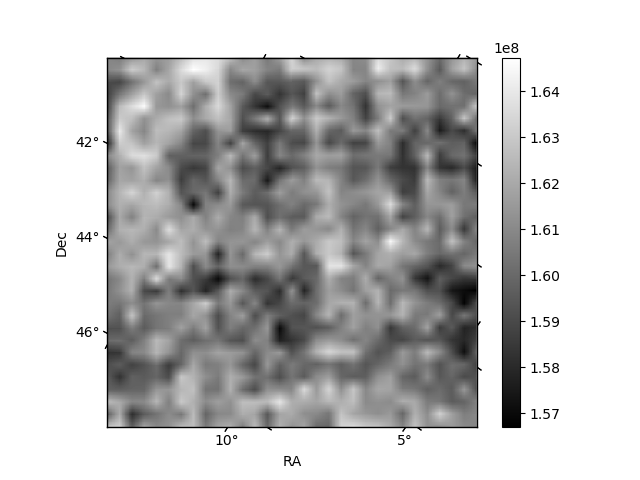
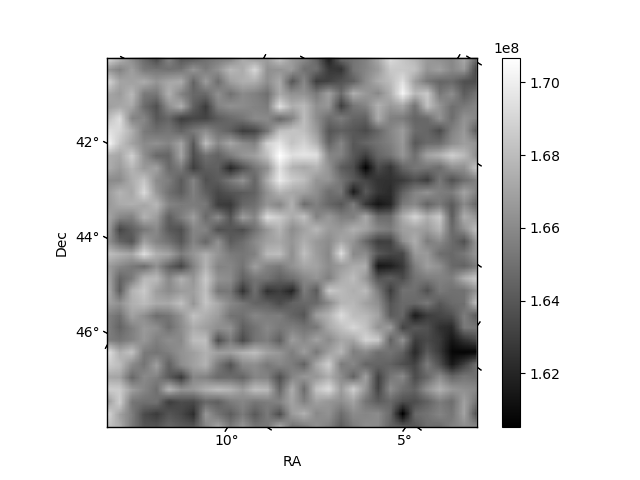
Histogram calculated using DETX and DETY for each event in the final _common_clean file
| Quadrant A | 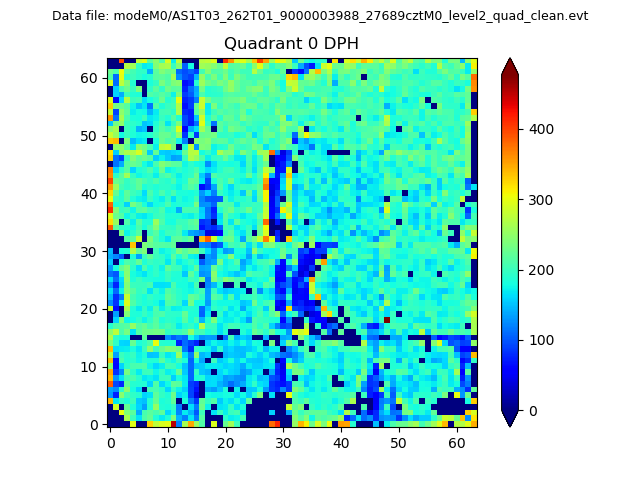 |
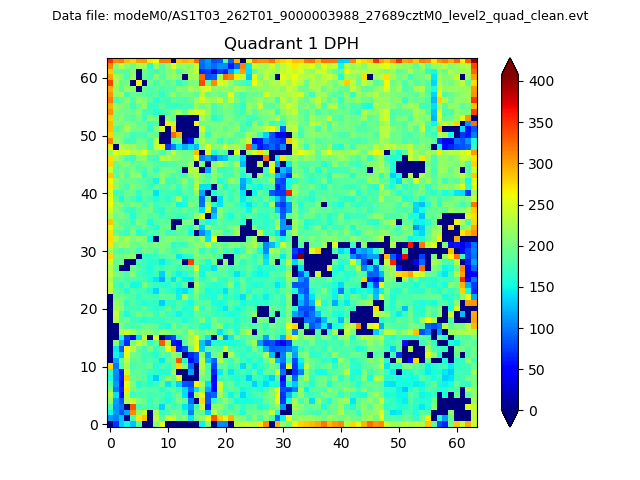 |
Quadrant B |
|---|---|---|---|
| Quadrant D | 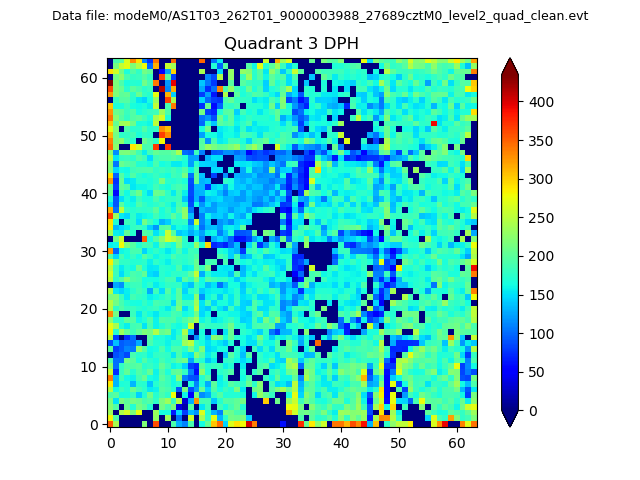 |
 |
Quadrant C |
| Plot type | Count rate plots | Images |
|---|---|---|
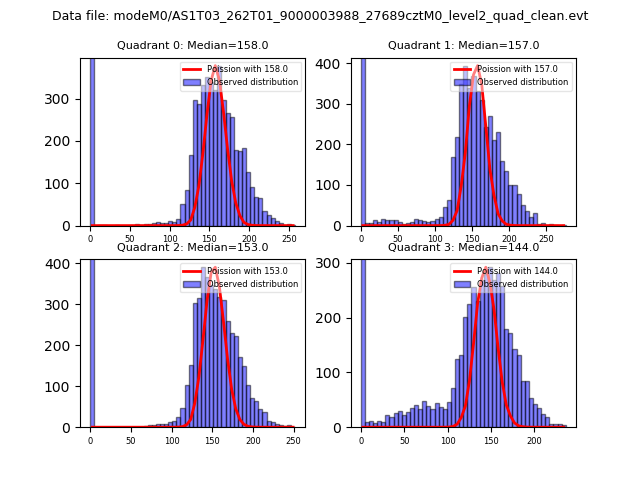
| Comparison with Poisson distribution Blue bars denote a histogram of data divided into 1 sec bins. Red curve is a Poisson curve with rate = median count rate of data. |
 |
 |
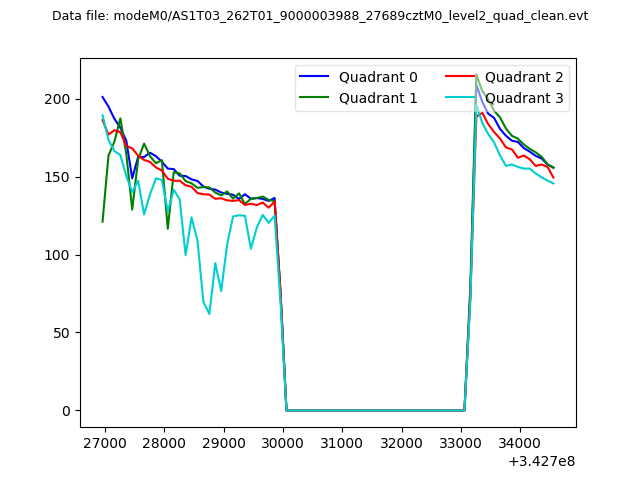
| Quadrant-wise count rates Data is divided into 100 sec bins |
 |
|
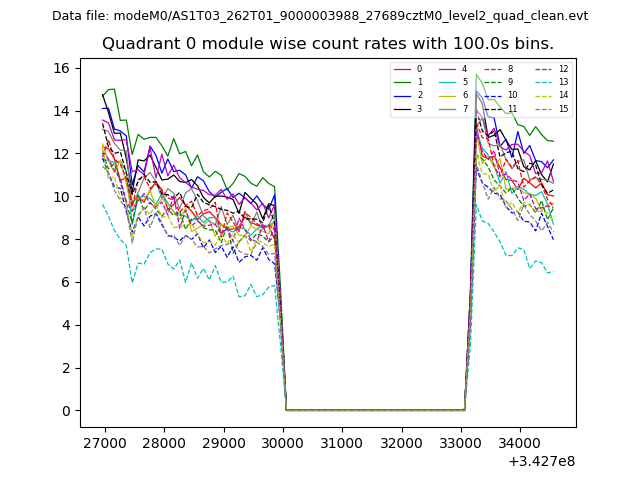
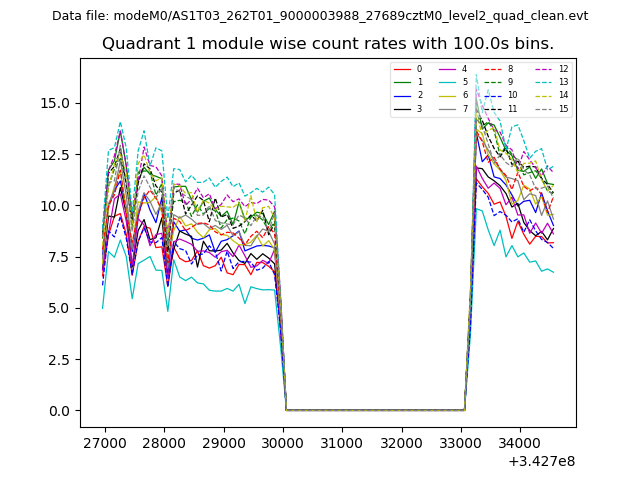
| Module-wise count rates for Quadrant A Data is divided into 100 sec bins |
 |
 |
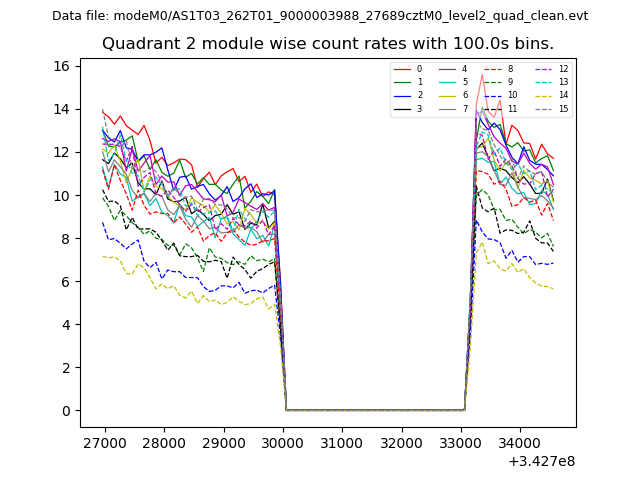
| Module-wise count rates for Quadrant B Data is divided into 100 sec bins |
 |
 |
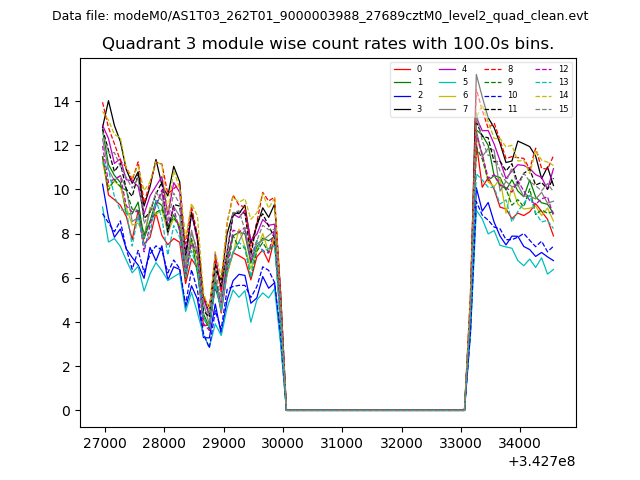
| Module-wise count rates for Quadrant C Data is divided into 100 sec bins |
 |
 |
| Module-wise count rates for Quadrant D Data is divided into 100 sec bins |
 |
 |
| Parameter | Plot |
|---|---|
| CZT HV Monitor | 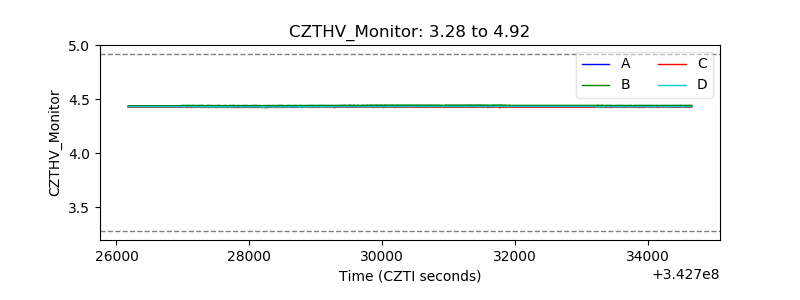 |
| D_VDD | 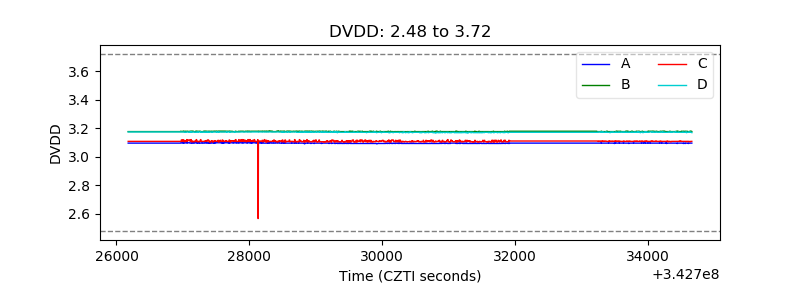 |
| Temperature 1 |  |
| Veto HV Monitor | 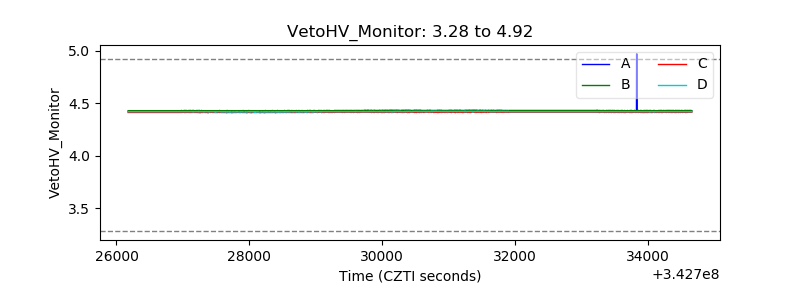 |
| Veto LLD | 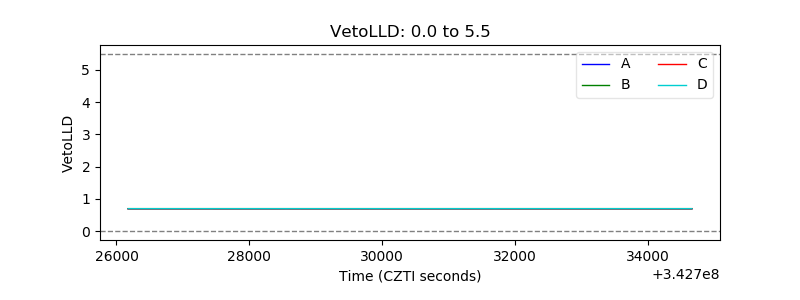 |
| Alpha Counter | 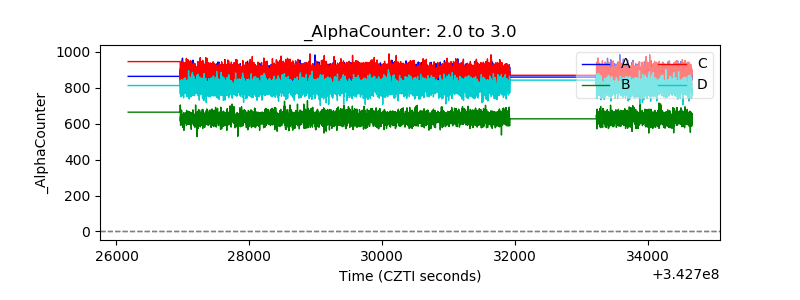 |
| _CPM_Rate | 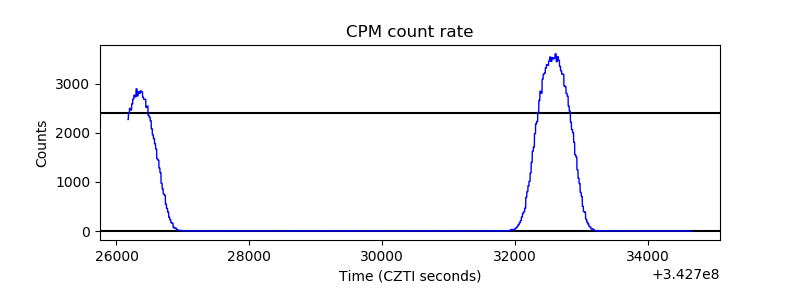 |
| CZT Counter | 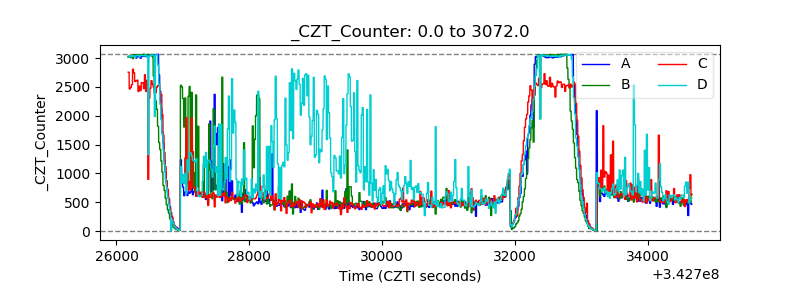 |
| +2.5 Volts monitor | 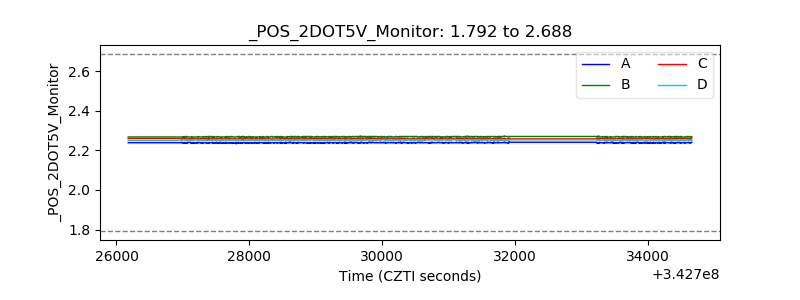 |
| +5 Volts monitor | 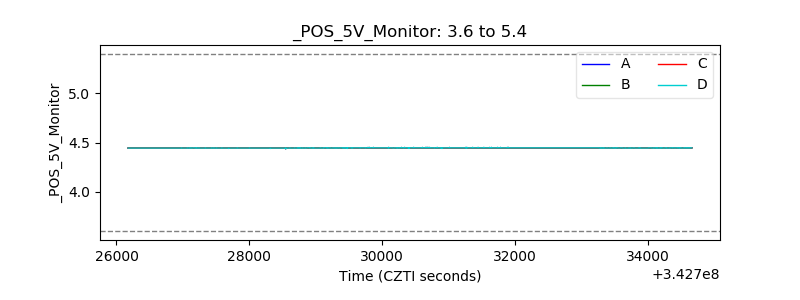 |
| _ROLL_ROT | 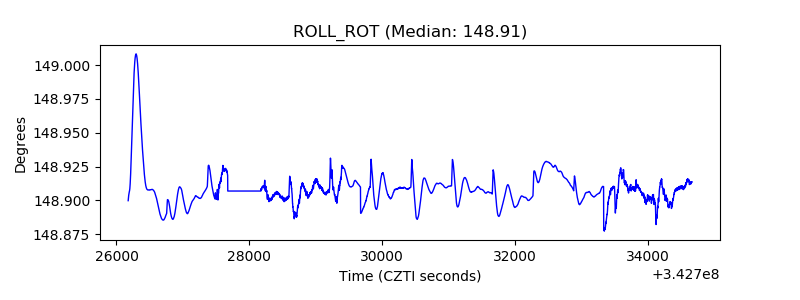 |
| _Roll_DEC | 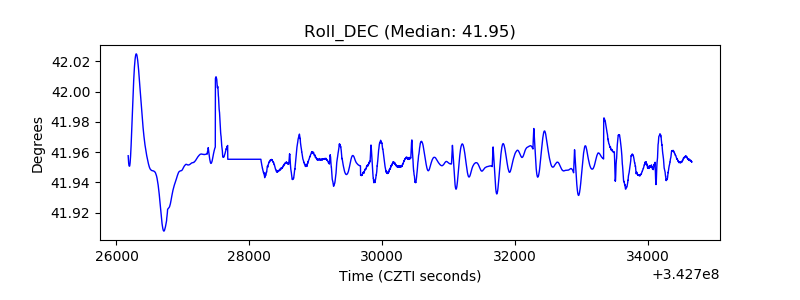 |
| _Roll_RA | 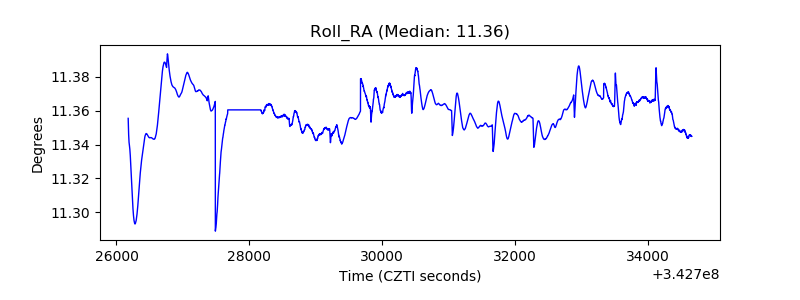 |
| Veto Counter | 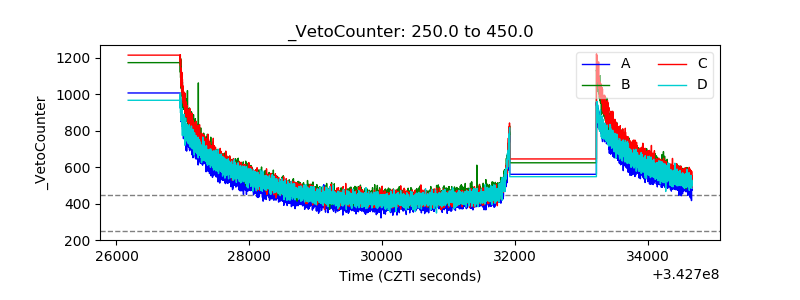 |