| Param | Original file | Final file |
|---|---|---|
| Filename | modeM0/AS1T03_262T01_9000003988_27690cztM0_level2.evt | modeM0/AS1T03_262T01_9000003988_27690cztM0_level2_quad_clean.evt |
| Size (bytes) | 540,144,000 | 100,108,800 |
| Size | 515.1 MB | 95.5 MB |
| Events in quadrant A | 3,196,750 | 677,370 |
| Events in quadrant B | 3,391,964 | 689,473 |
| Events in quadrant C | 3,556,651 | 658,288 |
| Events in quadrant D | 5,796,271 | 577,416 |
| Mode M0 | |||
|---|---|---|---|
| Quadrant | BADHDUFLAG | Total packets | Discarded packets |
| A | 0 | 13343 | 0 |
| B | 0 | 13949 | 0 |
| C | 0 | 14399 | 0 |
| D | 0 | 21416 | 0 |
| Mode M9 | |||
|---|---|---|---|
| Quadrant | BADHDUFLAG | Total packets | Discarded packets |
| A | 0 | 14 | 0 |
| B | 0 | 15 | 0 |
| C | 0 | 15 | 0 |
| D | 0 | 15 | 0 |
| Quadrant | Total seconds | Saturated seconds | Saturation percentage |
|---|---|---|---|
| A | 6140 | 40 | 0.651466% |
| B | 6140 | 57 | 0.928339% |
| C | 6140 | 152 | 2.475570% |
| D | 6140 | 941 | 15.325733% |
Noise dominated data is calculated using 1-second bins in cleaned event files. If a bin has >2000 counts, and if more than 50% of those come from <1% of pixels, then it is considered to be noise-dominated and hence unusable.
| Quadrant | # 1 sec bins | Bins with >0 counts | Bins with >2000 counts | High rate bins dominated by noise | Noise dominated (total time) | Noise dominated (detector-on time) | Marked lightcurve |
|---|---|---|---|---|---|---|---|
| A | 7515 | 6141 | 4 | 4 | 0.05% | 0.07% | 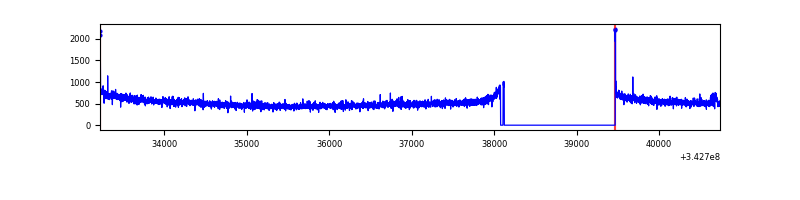 |
| B | 7515 | 6141 | 0 | 0 | 0.00% | 0.00% | 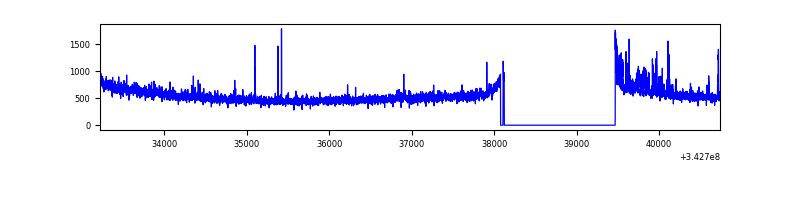 |
| C | 7515 | 6140 | 37 | 37 | 0.49% | 0.60% | 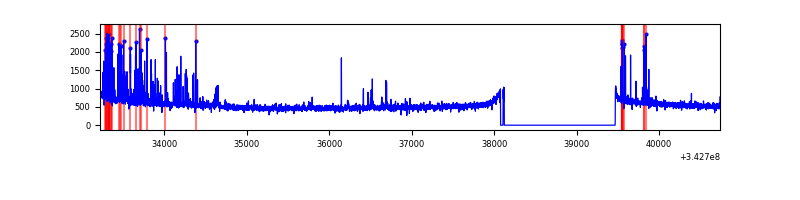 |
| D | 7515 | 6140 | 638 | 638 | 8.49% | 10.39% | 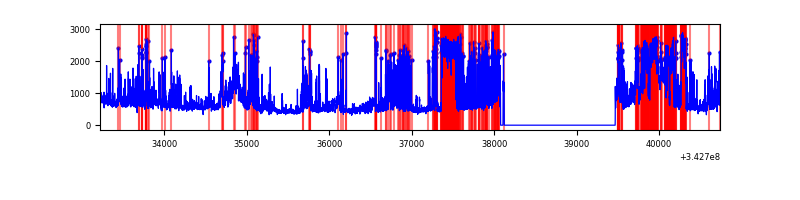 |
Top three noisy pixels from each quadrant. If the there are fewer than three noisy pixels in the level2.evt file, extra rows are filled as -1
| Pixel properties | Quadrant properties | ||||||
|---|---|---|---|---|---|---|---|
| Quadrant | DetID | PixID | Counts | Sigma | Mean | Median | Sigma |
| A | 8 | 192 | 13877 | 80.01 | 822 | 808 | 163.3 |
| A | 13 | 254 | 10815 | 61.27 | 822 | 808 | 163.3 |
| A | 5 | 203 | 9088 | 50.69 | 822 | 808 | 163.3 |
| B | 0 | 230 | 111007 | 731.42 | 820 | 801 | 150.7 |
| B | 0 | 190 | 49639 | 324.13 | 820 | 801 | 150.7 |
| B | 0 | 229 | 17408 | 110.22 | 820 | 801 | 150.7 |
| C | 8 | 208 | 282577 | 1520.06 | 797 | 807 | 185.4 |
| C | 14 | 238 | 128073 | 686.56 | 797 | 807 | 185.4 |
| C | 15 | 208 | 23839 | 124.25 | 797 | 807 | 185.4 |
| D | 1 | 52 | 1957674 | 11256.02 | 737 | 720 | 173.9 |
| D | 2 | 250 | 375631 | 2156.42 | 737 | 720 | 173.9 |
| D | 6 | 112 | 358365 | 2057.11 | 737 | 720 | 173.9 |
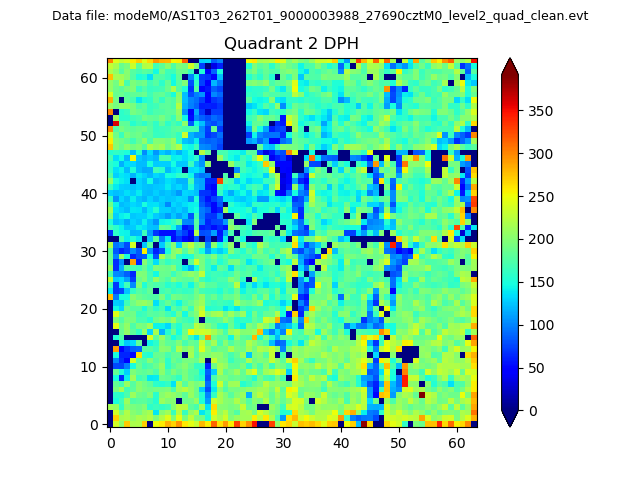
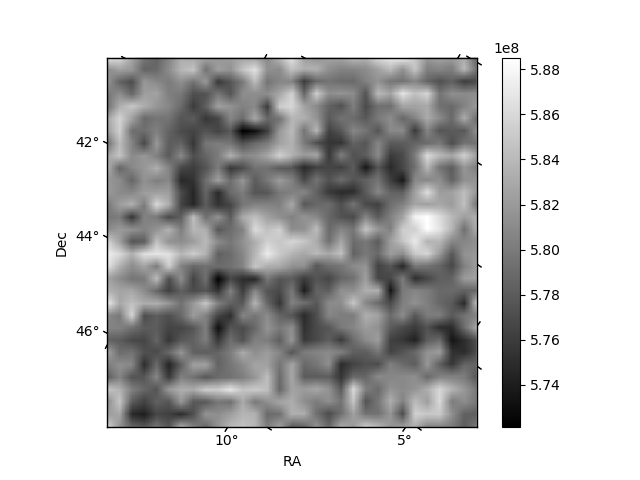
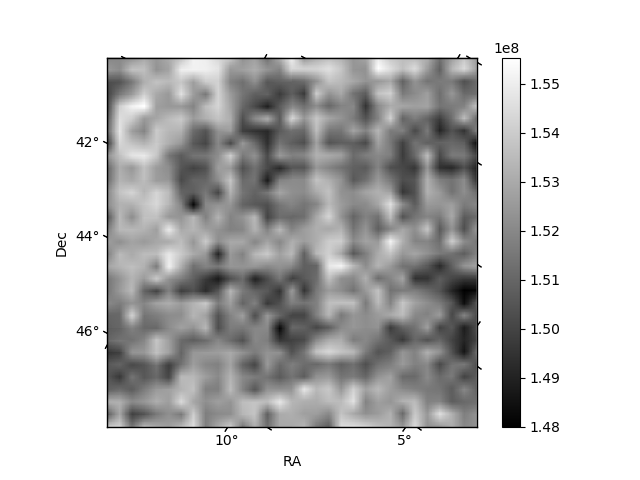
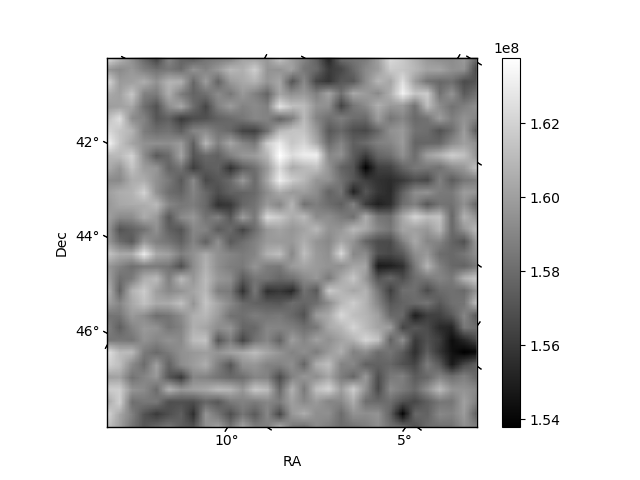
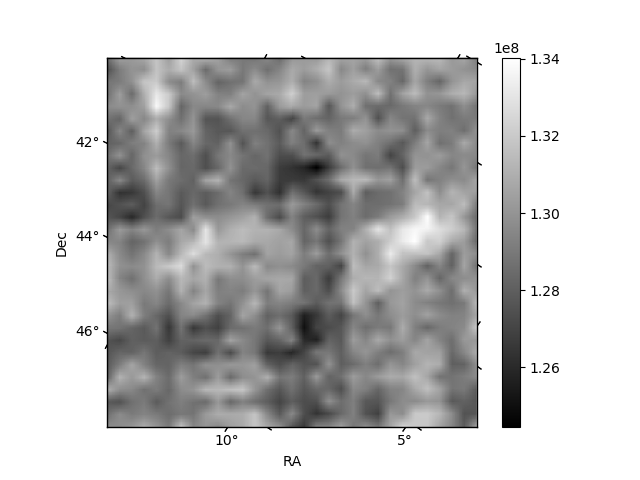
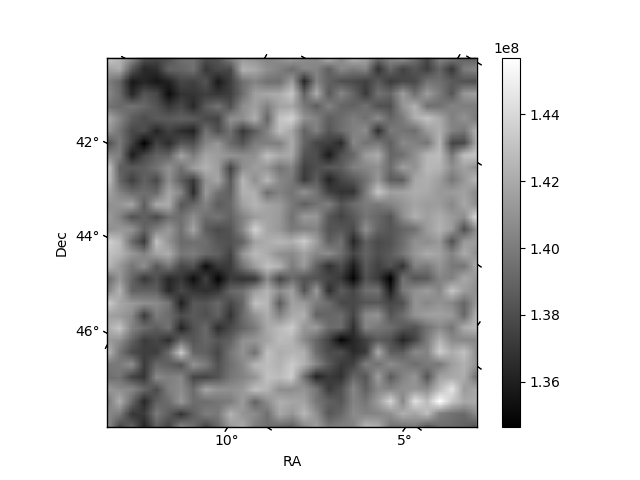
Histogram calculated using DETX and DETY for each event in the final _common_clean file
| Quadrant A | 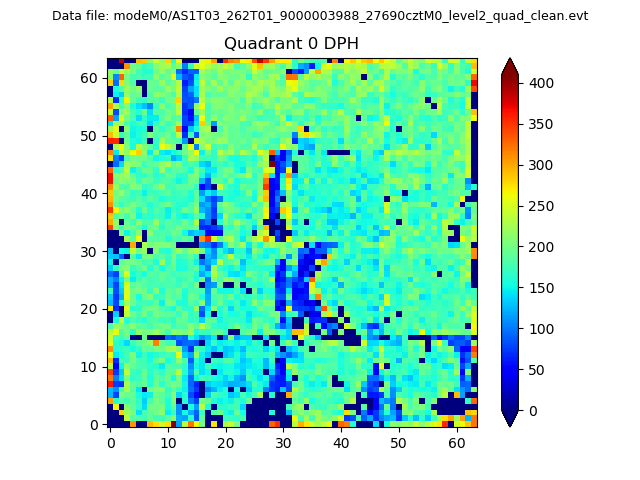 |
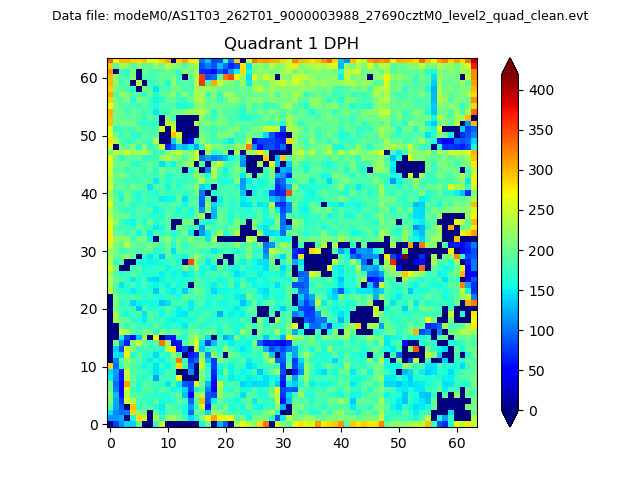 |
Quadrant B |
|---|---|---|---|
| Quadrant D | 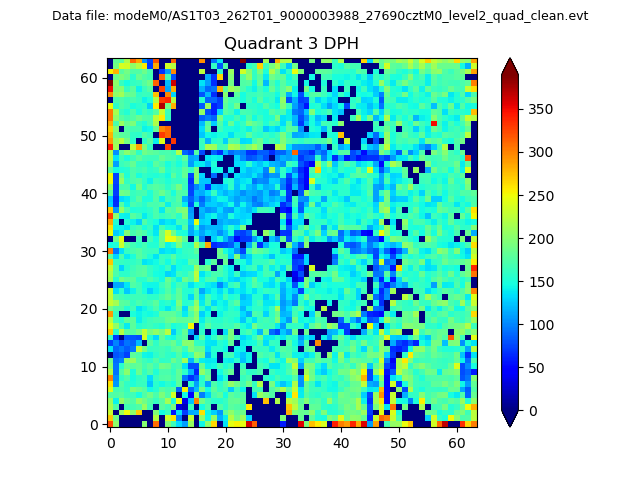 |
 |
Quadrant C |
| Plot type | Count rate plots | Images |
|---|---|---|
| Comparison with Poisson distribution Blue bars denote a histogram of data divided into 1 sec bins. Red curve is a Poisson curve with rate = median count rate of data. |
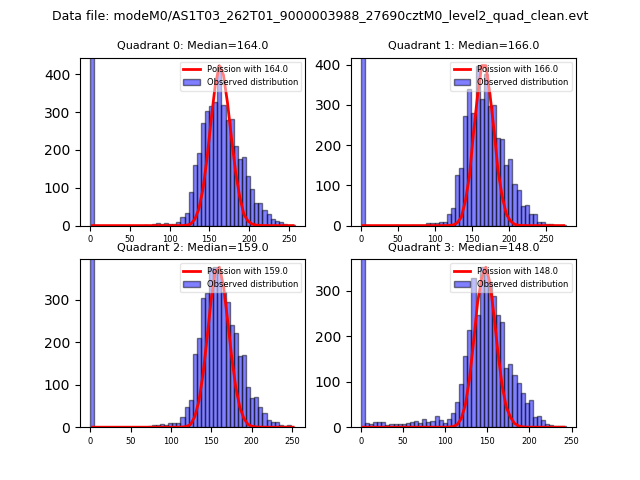 |
 |
| Quadrant-wise count rates Data is divided into 100 sec bins |
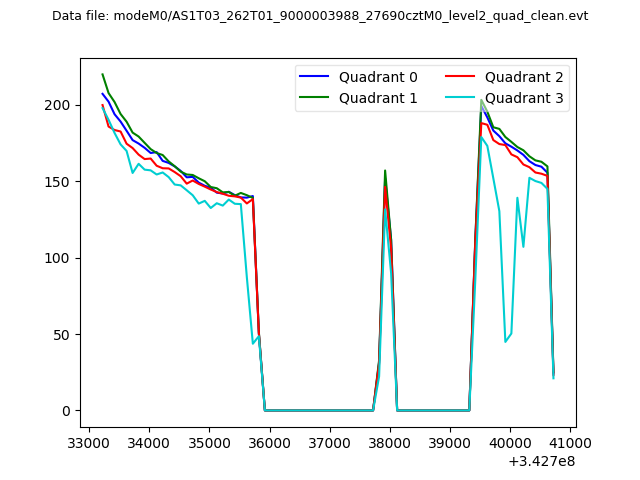 |
|
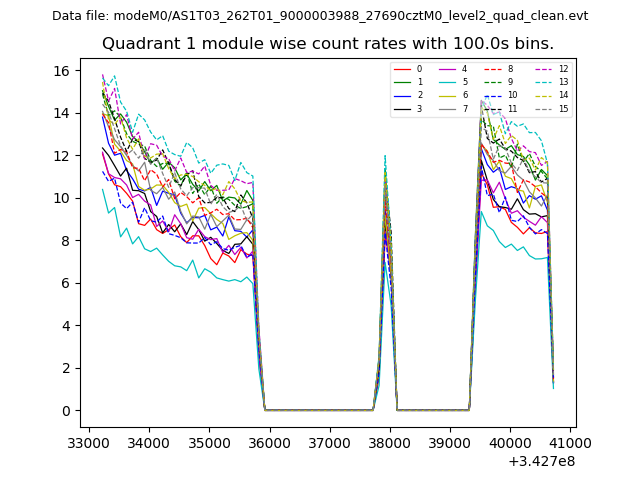
| Module-wise count rates for Quadrant A Data is divided into 100 sec bins |
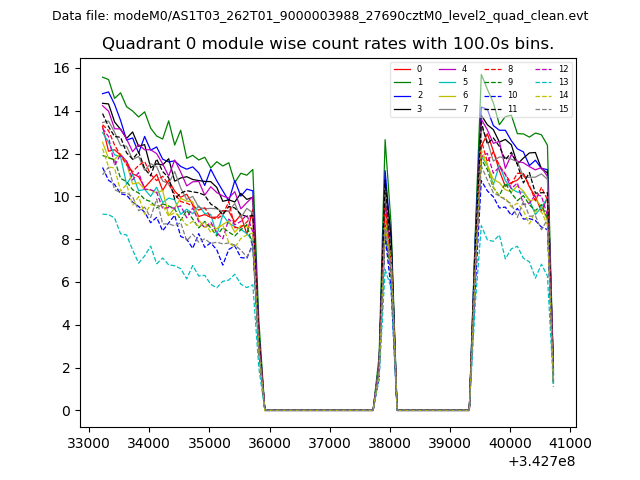 |
 |
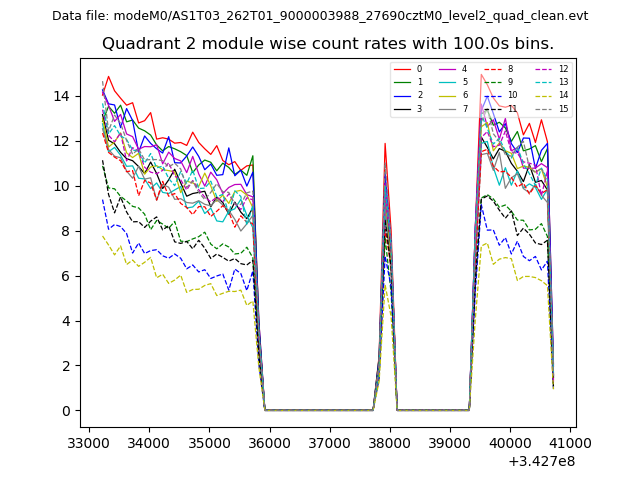
| Module-wise count rates for Quadrant B Data is divided into 100 sec bins |
 |
 |
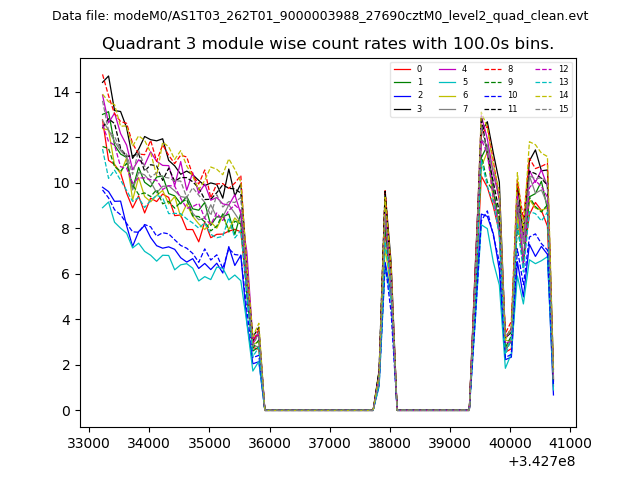
| Module-wise count rates for Quadrant C Data is divided into 100 sec bins |
 |
 |
| Module-wise count rates for Quadrant D Data is divided into 100 sec bins |
 |
 |
| Parameter | Plot |
|---|---|
| CZT HV Monitor | 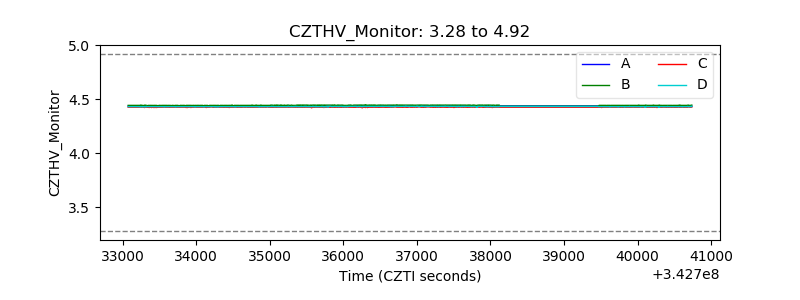 |
| D_VDD | 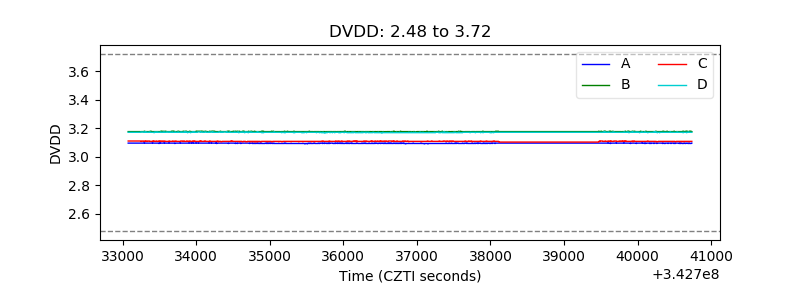 |
| Temperature 1 | 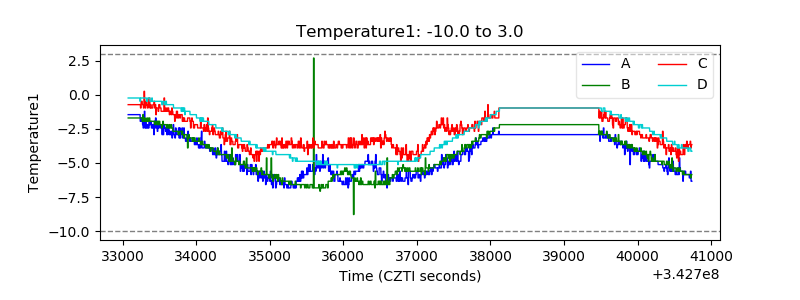 |
| Veto HV Monitor | 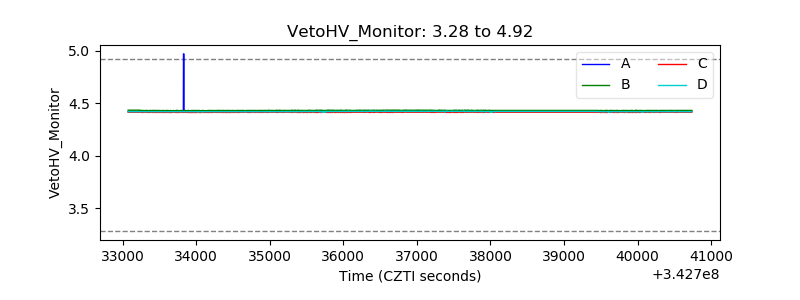 |
| Veto LLD | 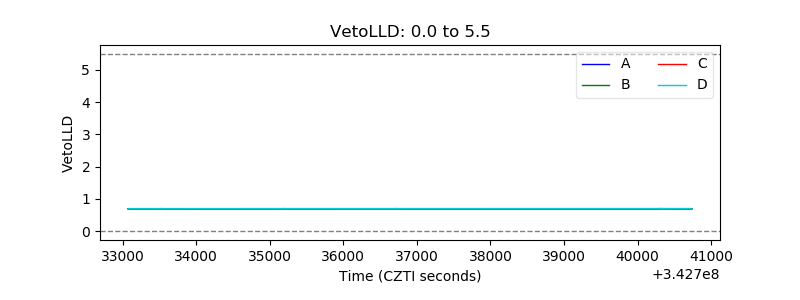 |
| Alpha Counter | 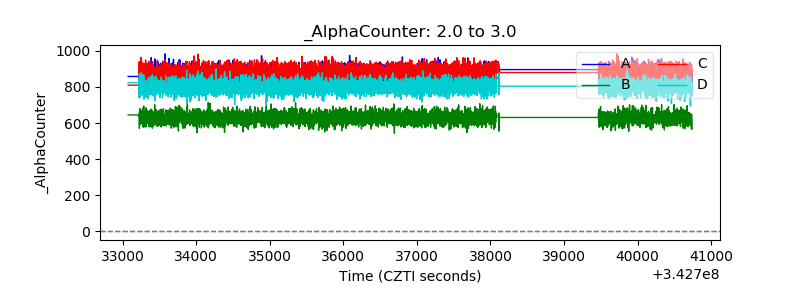 |
| _CPM_Rate | 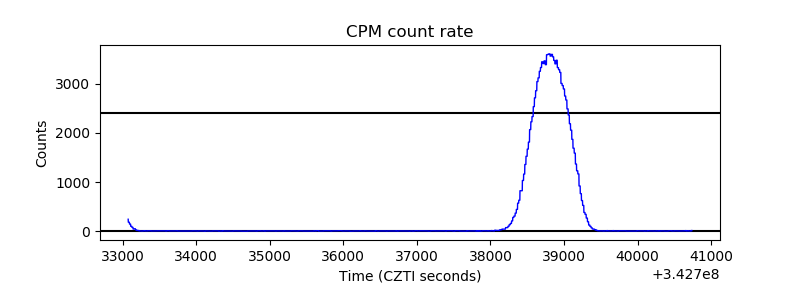 |
| CZT Counter | 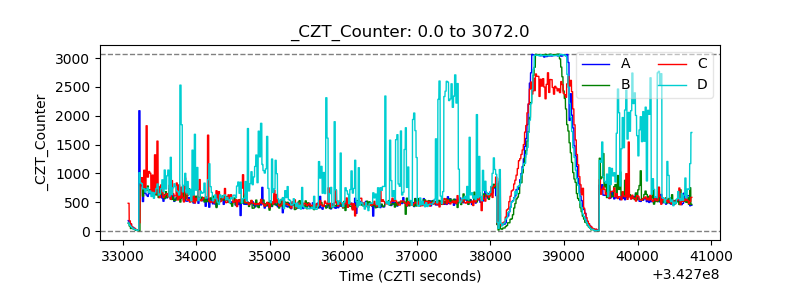 |
| +2.5 Volts monitor |  |
| +5 Volts monitor |  |
| _ROLL_ROT | 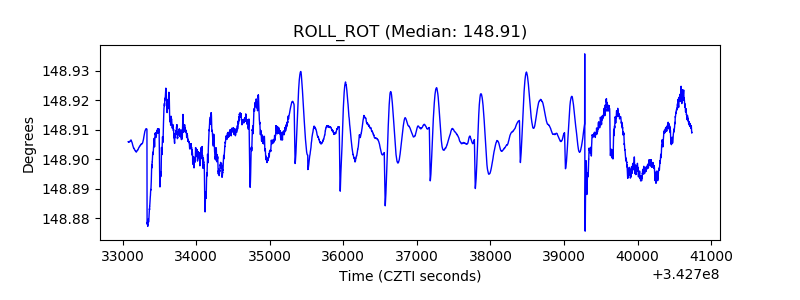 |
| _Roll_DEC | 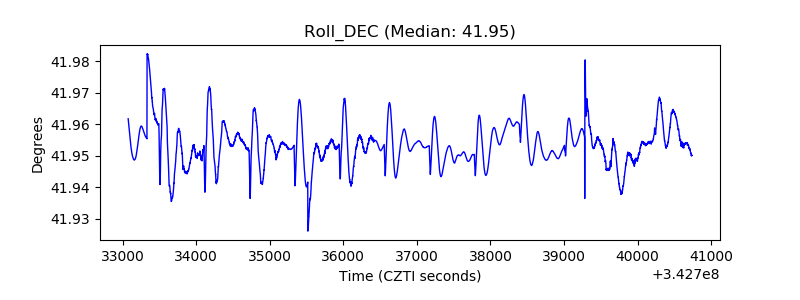 |
| _Roll_RA | 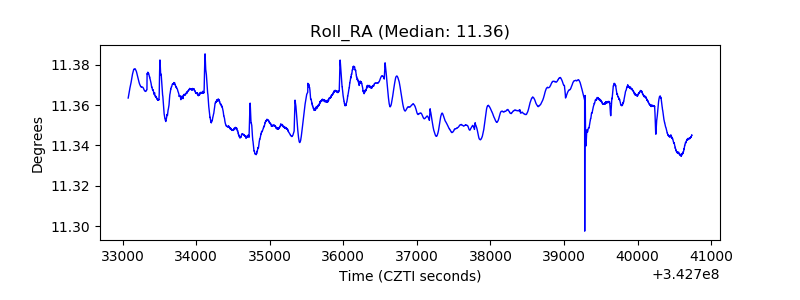 |
| Veto Counter | 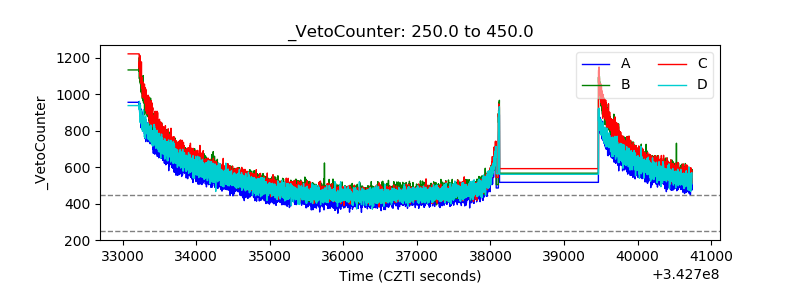 |