| Param | Original file | Final file |
|---|---|---|
| Filename | modeM0/AS1T03_262T01_9000003988_27691cztM0_level2.evt | modeM0/AS1T03_262T01_9000003988_27691cztM0_level2_quad_clean.evt |
| Size (bytes) | 522,264,960 | 98,112,960 |
| Size | 498.1 MB | 93.6 MB |
| Events in quadrant A | 3,150,132 | 658,786 |
| Events in quadrant B | 3,417,824 | 671,823 |
| Events in quadrant C | 3,337,854 | 641,906 |
| Events in quadrant D | 5,492,509 | 567,770 |
| Mode M0 | |||
|---|---|---|---|
| Quadrant | BADHDUFLAG | Total packets | Discarded packets |
| A | 0 | 13142 | 0 |
| B | 0 | 13966 | 0 |
| C | 0 | 13665 | 0 |
| D | 0 | 20500 | 0 |
| Mode M9 | |||
|---|---|---|---|
| Quadrant | BADHDUFLAG | Total packets | Discarded packets |
| A | 0 | 24 | 0 |
| B | 0 | 25 | 0 |
| C | 0 | 25 | 0 |
| D | 0 | 25 | 0 |
| Quadrant | Total seconds | Saturated seconds | Saturation percentage |
|---|---|---|---|
| A | 6171 | 41 | 0.664398% |
| B | 6171 | 77 | 1.247772% |
| C | 6171 | 122 | 1.976989% |
| D | 6171 | 603 | 9.771512% |
Noise dominated data is calculated using 1-second bins in cleaned event files. If a bin has >2000 counts, and if more than 50% of those come from <1% of pixels, then it is considered to be noise-dominated and hence unusable.
| Quadrant | # 1 sec bins | Bins with >0 counts | Bins with >2000 counts | High rate bins dominated by noise | Noise dominated (total time) | Noise dominated (detector-on time) | Marked lightcurve |
|---|---|---|---|---|---|---|---|
| A | 7531 | 6172 | 5 | 5 | 0.07% | 0.08% | 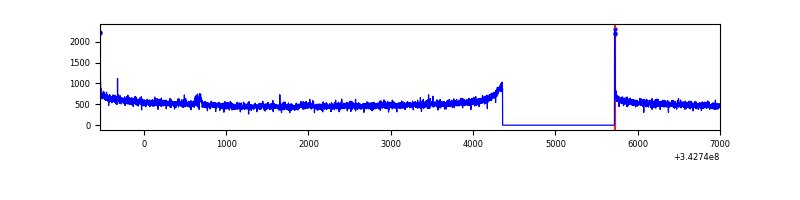 |
| B | 7531 | 6171 | 0 | 0 | 0.00% | 0.00% | 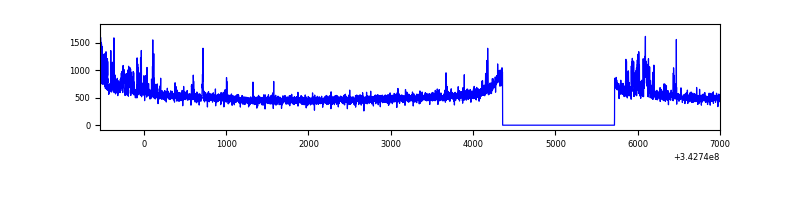 |
| C | 7531 | 6171 | 16 | 16 | 0.21% | 0.26% | 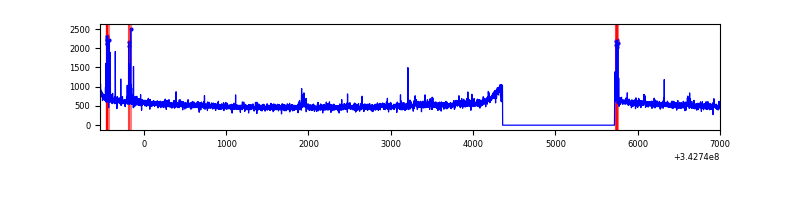 |
| D | 7531 | 6172 | 395 | 395 | 5.24% | 6.40% | 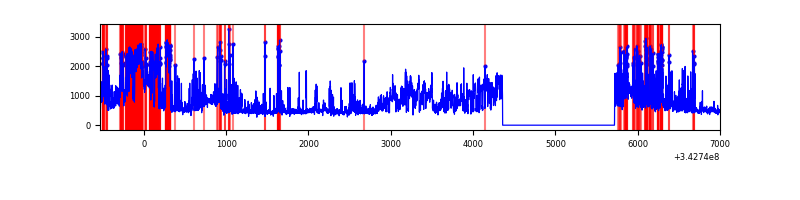 |
Top three noisy pixels from each quadrant. If the there are fewer than three noisy pixels in the level2.evt file, extra rows are filled as -1
| Pixel properties | Quadrant properties | ||||||
|---|---|---|---|---|---|---|---|
| Quadrant | DetID | PixID | Counts | Sigma | Mean | Median | Sigma |
| A | 8 | 192 | 14890 | 87.73 | 807 | 791 | 160.7 |
| A | 15 | 174 | 14691 | 86.49 | 807 | 791 | 160.7 |
| A | 13 | 254 | 10715 | 61.75 | 807 | 791 | 160.7 |
| B | 0 | 230 | 201272 | 1336.28 | 811 | 791 | 150.0 |
| B | 0 | 190 | 26179 | 169.22 | 811 | 791 | 150.0 |
| B | 12 | 111 | 17554 | 111.73 | 811 | 791 | 150.0 |
| C | 14 | 238 | 127278 | 694.53 | 788 | 794 | 182.1 |
| C | 8 | 208 | 76842 | 417.58 | 788 | 794 | 182.1 |
| C | 3 | 233 | 46707 | 252.11 | 788 | 794 | 182.1 |
| D | 1 | 52 | 1838362 | 10554.84 | 745 | 727 | 174.1 |
| D | 6 | 112 | 350669 | 2009.96 | 745 | 727 | 174.1 |
| D | 2 | 250 | 232773 | 1332.8 | 745 | 727 | 174.1 |
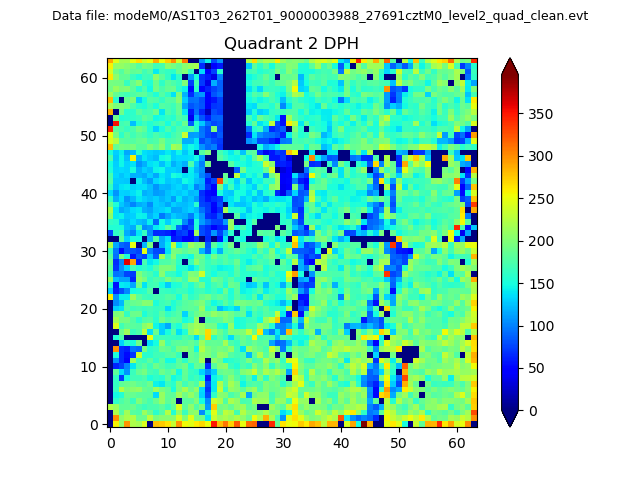
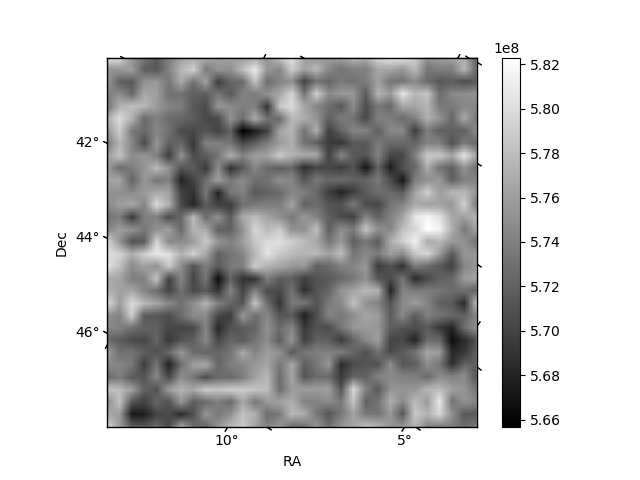
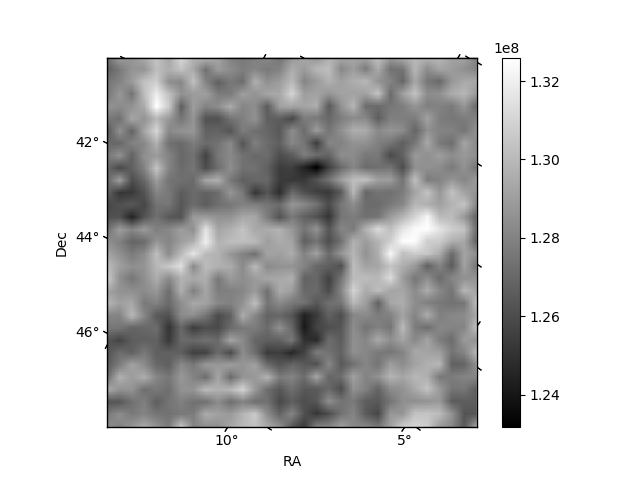
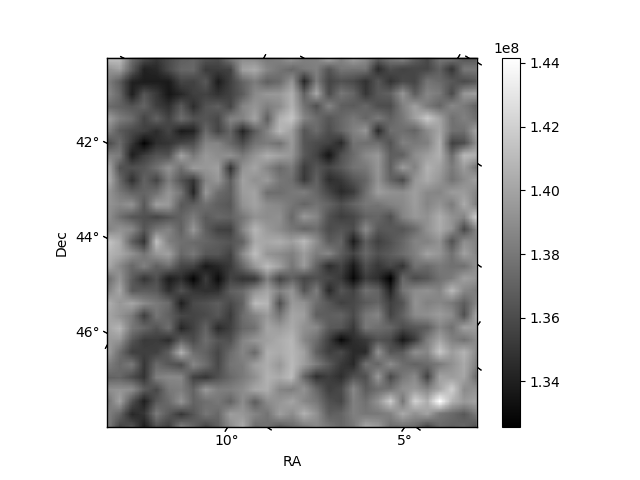
Histogram calculated using DETX and DETY for each event in the final _common_clean file
| Quadrant A | 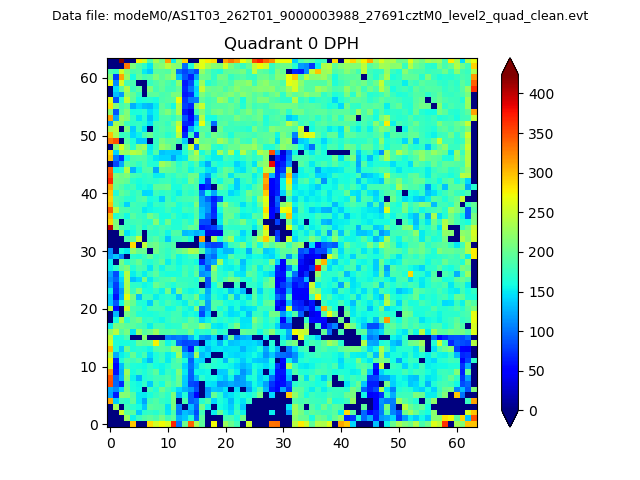 |
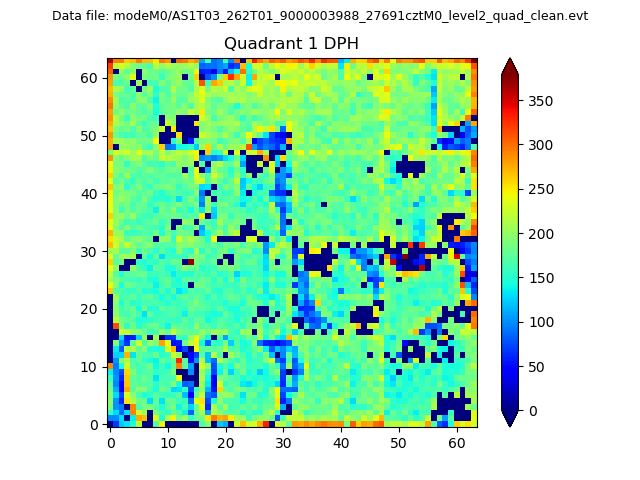 |
Quadrant B |
|---|---|---|---|
| Quadrant D | 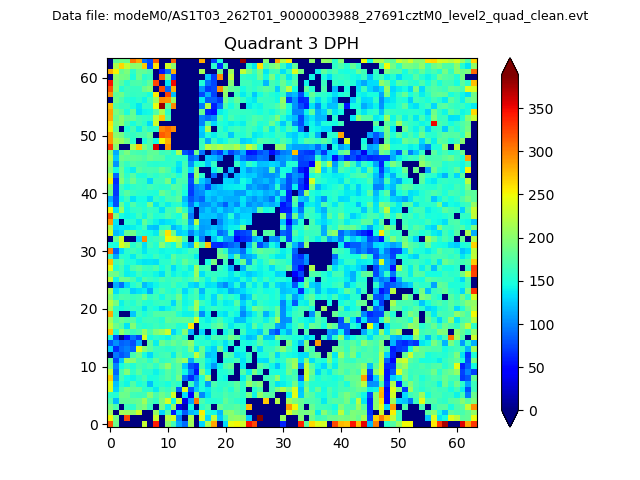 |
 |
Quadrant C |
| Plot type | Count rate plots | Images |
|---|---|---|
| Comparison with Poisson distribution Blue bars denote a histogram of data divided into 1 sec bins. Red curve is a Poisson curve with rate = median count rate of data. |
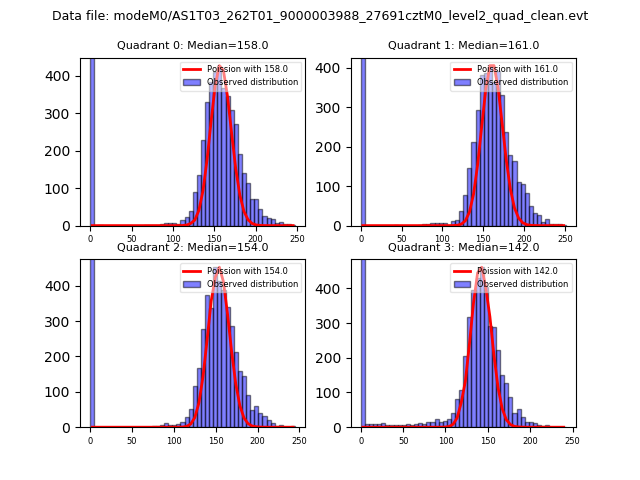 |
 |
| Quadrant-wise count rates Data is divided into 100 sec bins |
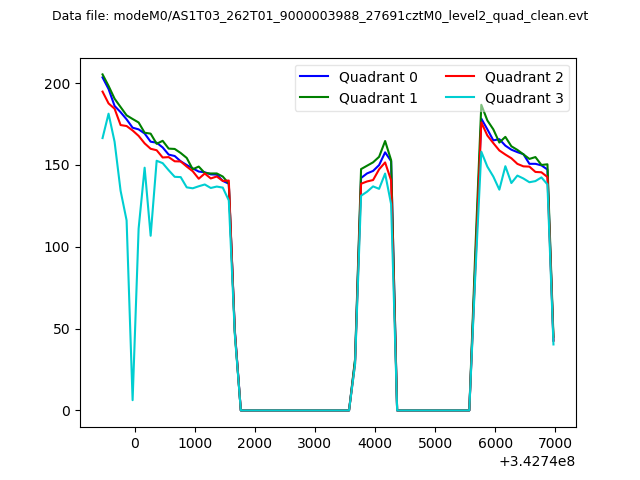 |
|
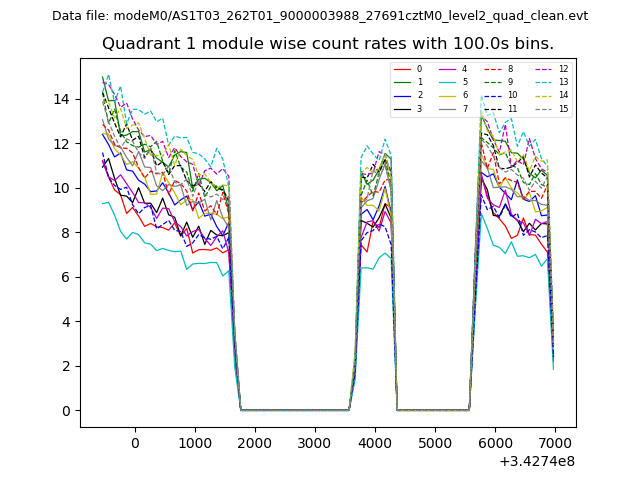
| Module-wise count rates for Quadrant A Data is divided into 100 sec bins |
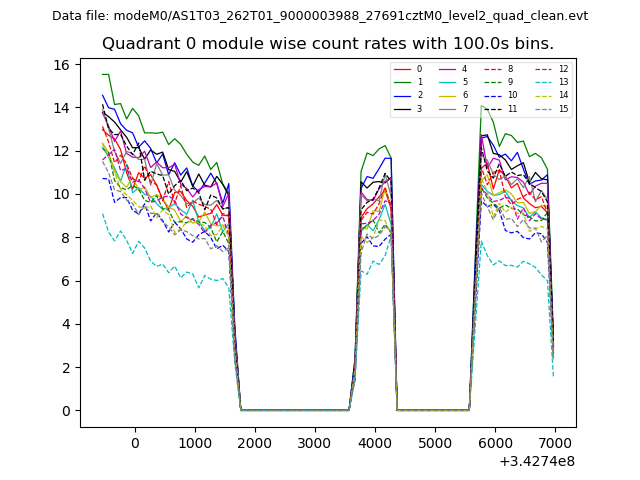 |
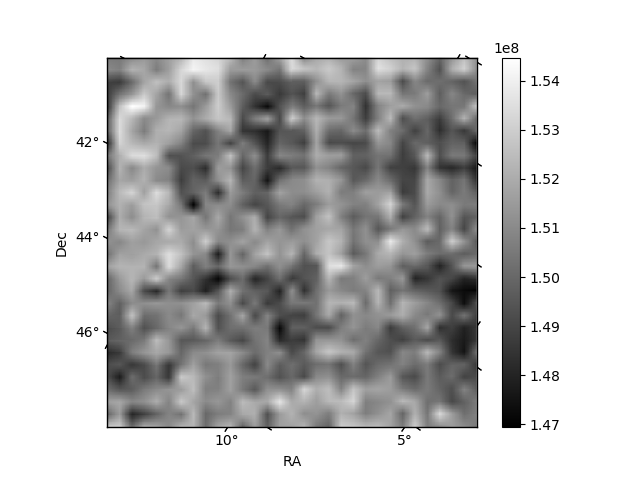 |
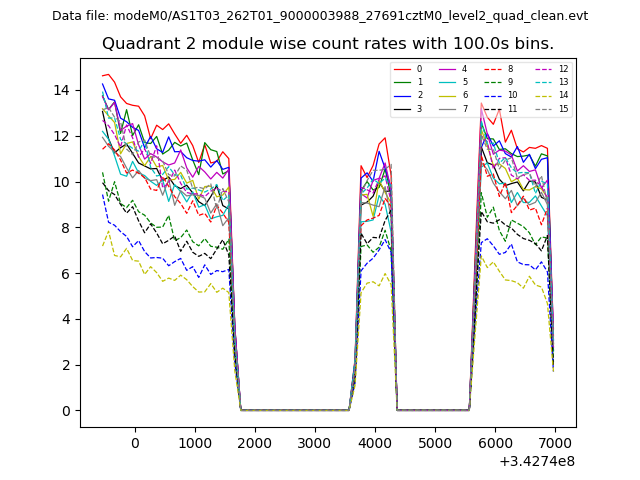
| Module-wise count rates for Quadrant B Data is divided into 100 sec bins |
 |
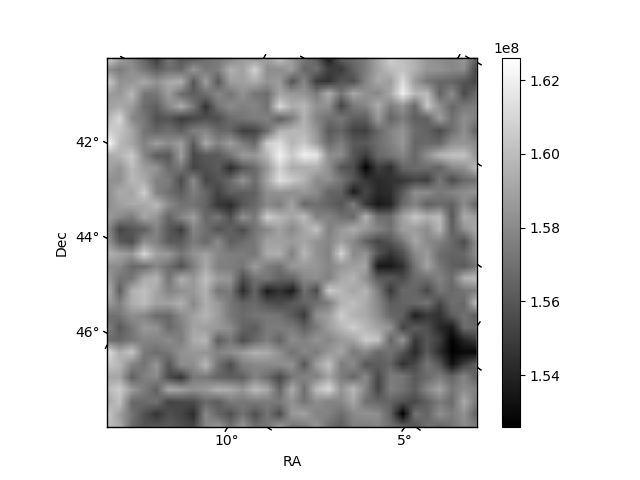 |
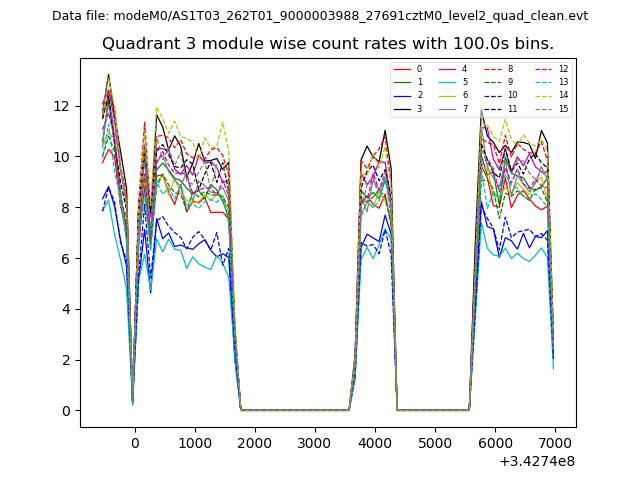
| Module-wise count rates for Quadrant C Data is divided into 100 sec bins |
 |
 |
| Module-wise count rates for Quadrant D Data is divided into 100 sec bins |
 |
 |
| Parameter | Plot |
|---|---|
| CZT HV Monitor | 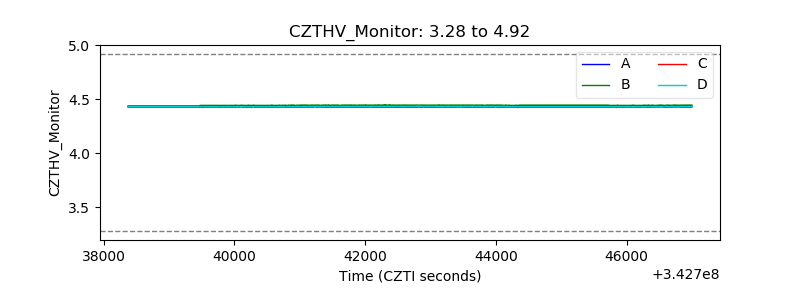 |
| D_VDD | 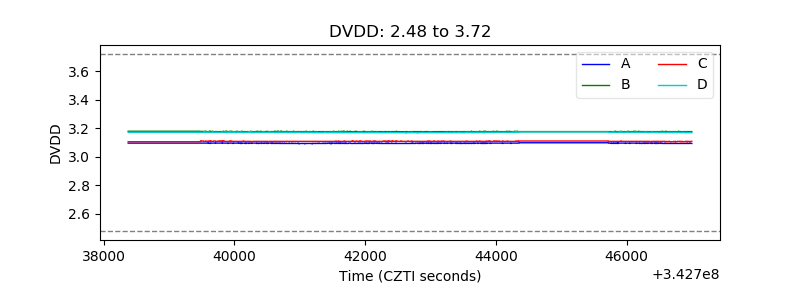 |
| Temperature 1 | 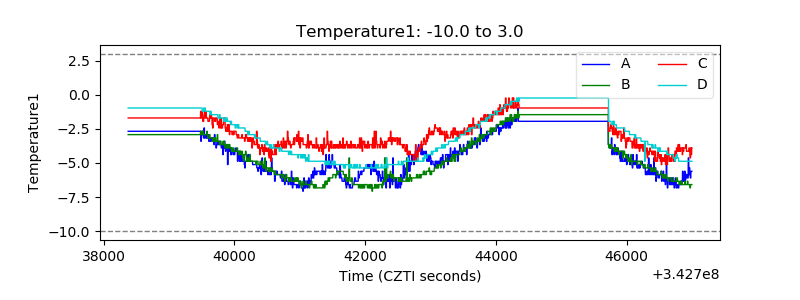 |
| Veto HV Monitor | 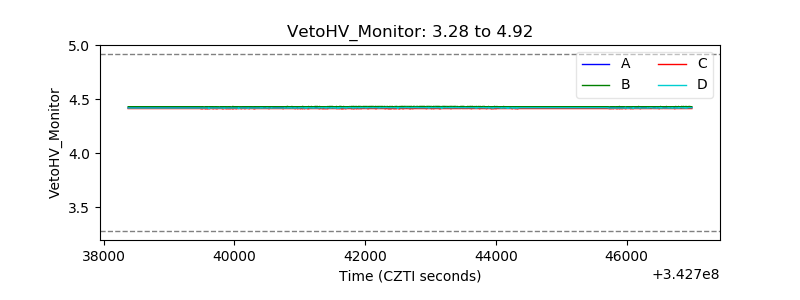 |
| Veto LLD | 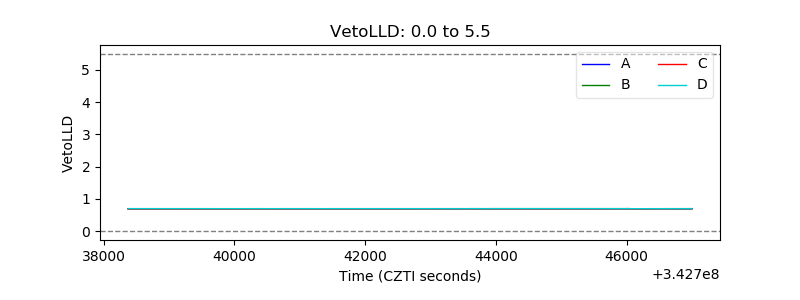 |
| Alpha Counter | 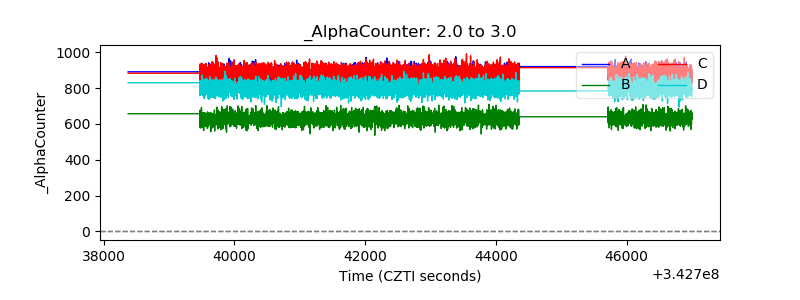 |
| _CPM_Rate | 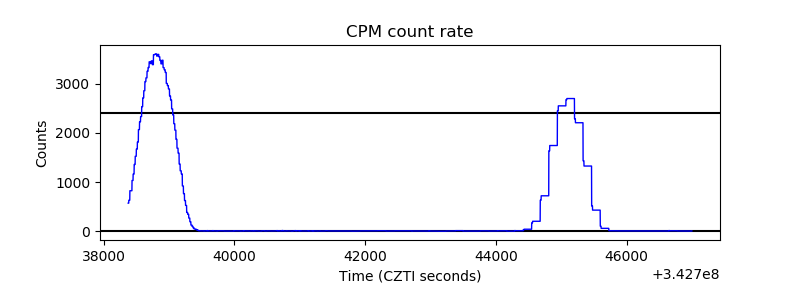 |
| CZT Counter | 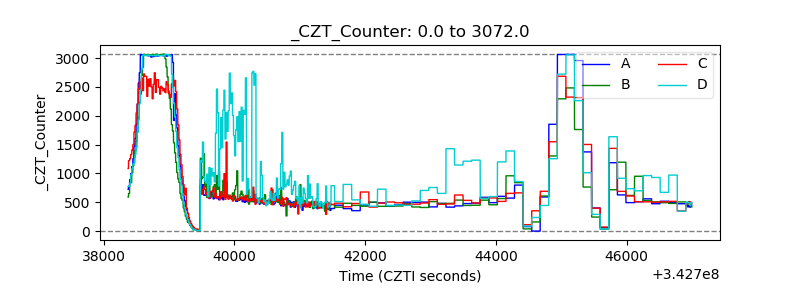 |
| +2.5 Volts monitor | 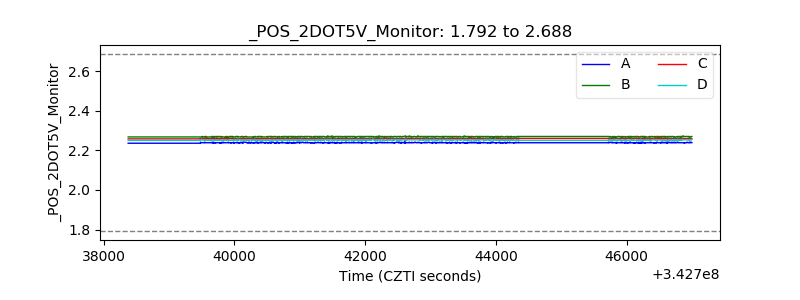 |
| +5 Volts monitor | 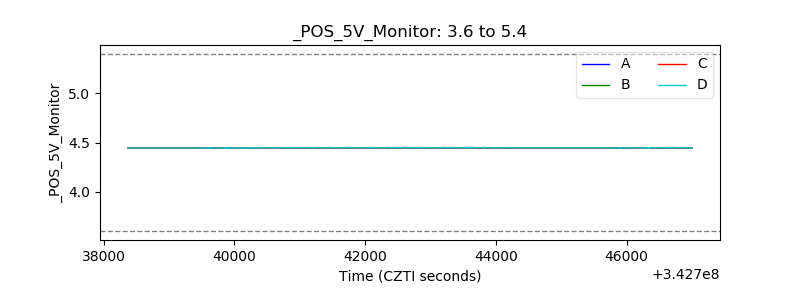 |
| _ROLL_ROT | 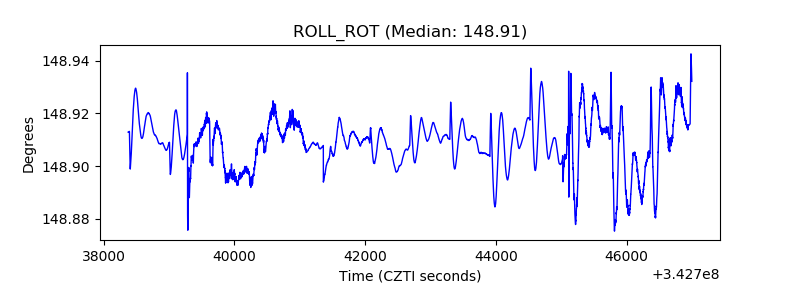 |
| _Roll_DEC | 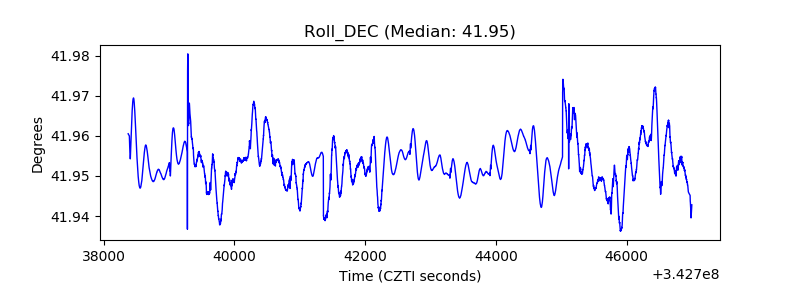 |
| _Roll_RA | 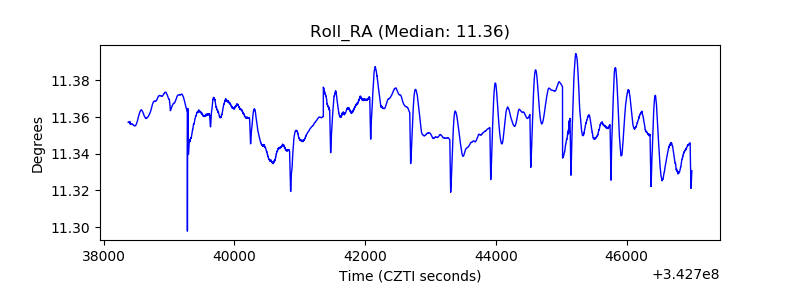 |
| Veto Counter | 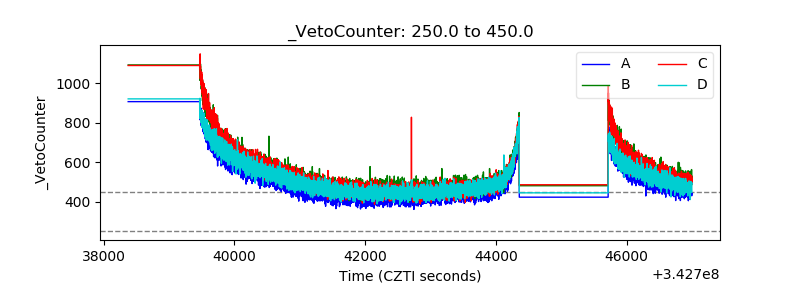 |