| Param | Original file | Final file |
|---|---|---|
| Filename | modeM0/AS1T03_262T01_9000003988_27692cztM0_level2.evt | modeM0/AS1T03_262T01_9000003988_27692cztM0_level2_quad_clean.evt |
| Size (bytes) | 473,091,840 | 96,433,920 |
| Size | 451.2 MB | 92.0 MB |
| Events in quadrant A | 3,111,921 | 634,578 |
| Events in quadrant B | 3,336,520 | 645,285 |
| Events in quadrant C | 3,280,633 | 616,657 |
| Events in quadrant D | 4,169,804 | 583,274 |
| Mode M0 | |||
|---|---|---|---|
| Quadrant | BADHDUFLAG | Total packets | Discarded packets |
| A | 0 | 13242 | 0 |
| B | 0 | 13855 | 0 |
| C | 0 | 13578 | 0 |
| D | 0 | 16755 | 0 |
| Mode M9 | |||
|---|---|---|---|
| Quadrant | BADHDUFLAG | Total packets | Discarded packets |
| A | 0 | 13 | 0 |
| B | 0 | 14 | 0 |
| C | 0 | 14 | 0 |
| D | 0 | 14 | 0 |
| Quadrant | Total seconds | Saturated seconds | Saturation percentage |
|---|---|---|---|
| A | 6314 | 27 | 0.427621% |
| B | 6314 | 70 | 1.108647% |
| C | 6314 | 82 | 1.298701% |
| D | 6314 | 187 | 2.961672% |
Noise dominated data is calculated using 1-second bins in cleaned event files. If a bin has >2000 counts, and if more than 50% of those come from <1% of pixels, then it is considered to be noise-dominated and hence unusable.
| Quadrant | # 1 sec bins | Bins with >0 counts | Bins with >2000 counts | High rate bins dominated by noise | Noise dominated (total time) | Noise dominated (detector-on time) | Marked lightcurve |
|---|---|---|---|---|---|---|---|
| A | 7544 | 6314 | 4 | 4 | 0.05% | 0.06% | 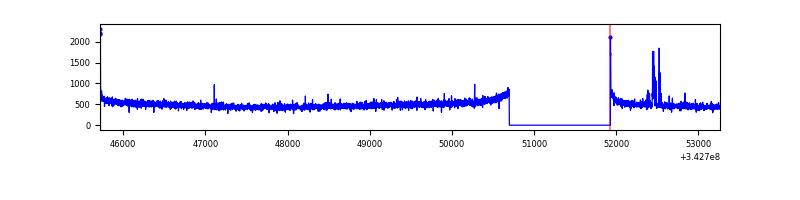 |
| B | 7544 | 6314 | 7 | 7 | 0.09% | 0.11% | 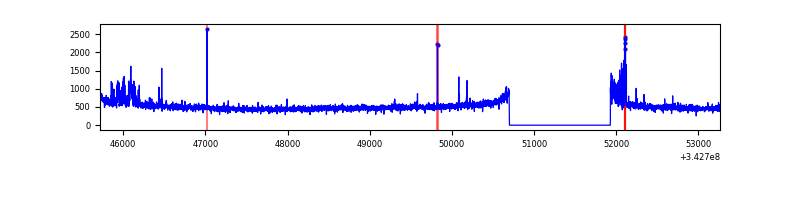 |
| C | 7544 | 6314 | 6 | 6 | 0.08% | 0.10% | 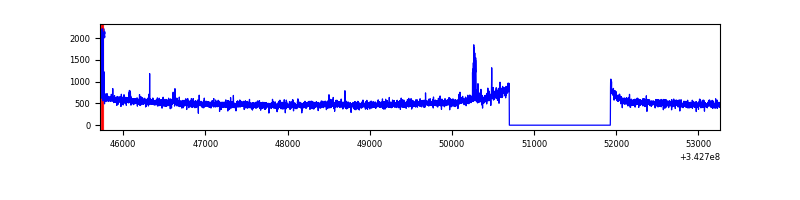 |
| D | 7544 | 6314 | 166 | 166 | 2.20% | 2.63% | 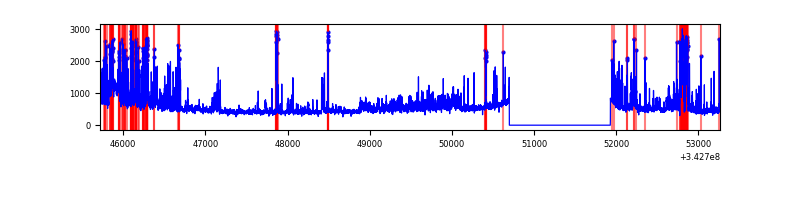 |
Top three noisy pixels from each quadrant. If the there are fewer than three noisy pixels in the level2.evt file, extra rows are filled as -1
| Pixel properties | Quadrant properties | ||||||
|---|---|---|---|---|---|---|---|
| Quadrant | DetID | PixID | Counts | Sigma | Mean | Median | Sigma |
| A | 6 | 16 | 34368 | 213.7 | 794 | 782 | 157.2 |
| A | 8 | 192 | 13304 | 79.67 | 794 | 782 | 157.2 |
| A | 13 | 254 | 10647 | 62.77 | 794 | 782 | 157.2 |
| B | 0 | 230 | 177312 | 1195.55 | 797 | 779 | 147.7 |
| B | 12 | 111 | 17702 | 114.61 | 797 | 779 | 147.7 |
| B | 11 | 111 | 15910 | 102.47 | 797 | 779 | 147.7 |
| C | 14 | 238 | 124887 | 689.84 | 772 | 778 | 179.9 |
| C | 3 | 233 | 96275 | 530.8 | 772 | 778 | 179.9 |
| C | 8 | 208 | 42486 | 231.83 | 772 | 778 | 179.9 |
| D | 1 | 52 | 1119524 | 6192.86 | 759 | 737 | 180.7 |
| D | 2 | 250 | 75580 | 414.28 | 759 | 737 | 180.7 |
| D | 11 | 176 | 75322 | 412.85 | 759 | 737 | 180.7 |
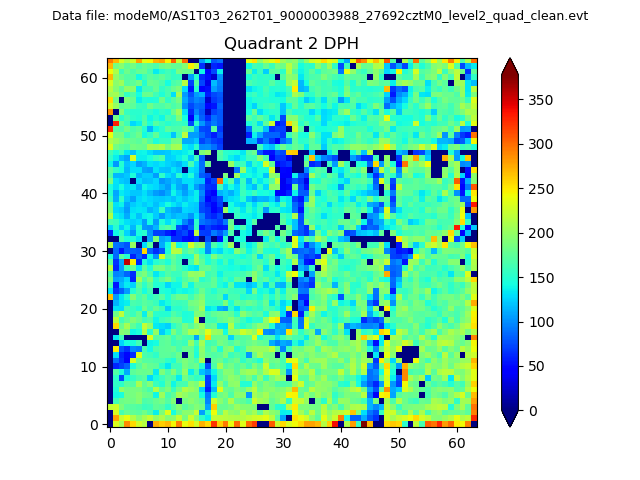
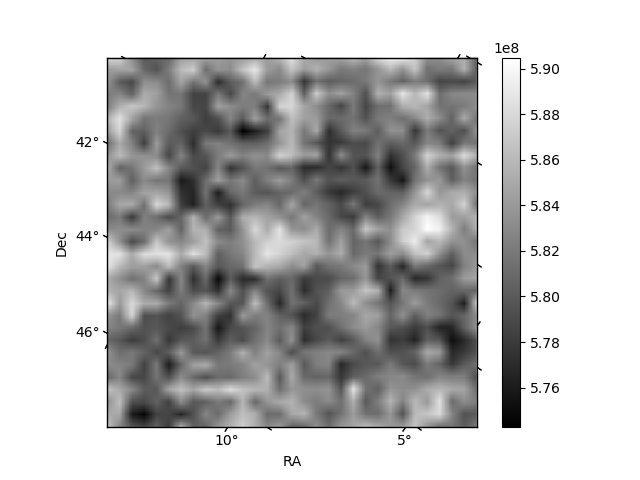
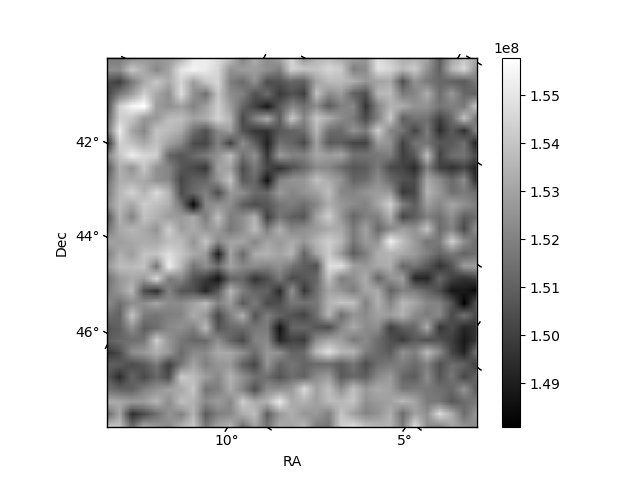
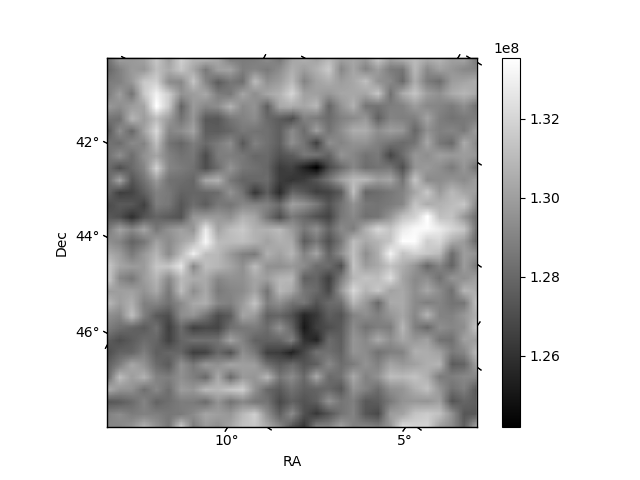
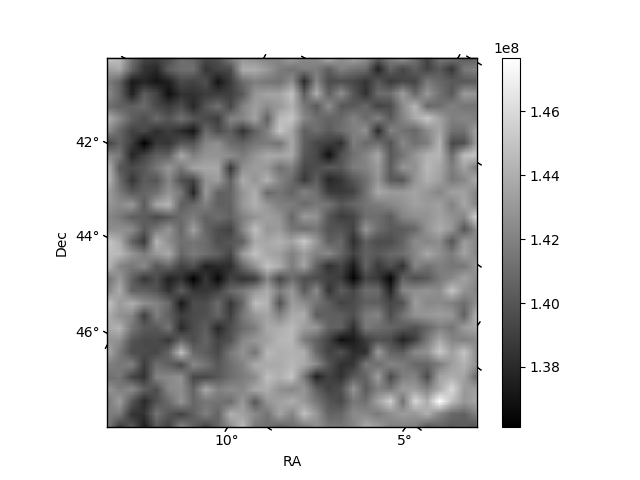
Histogram calculated using DETX and DETY for each event in the final _common_clean file
| Quadrant A | 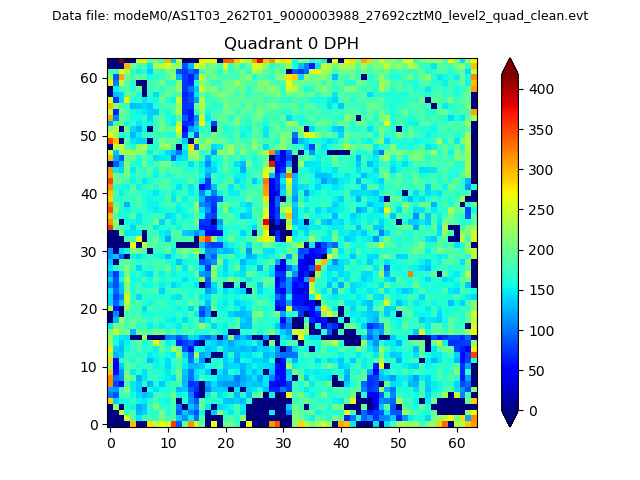 |
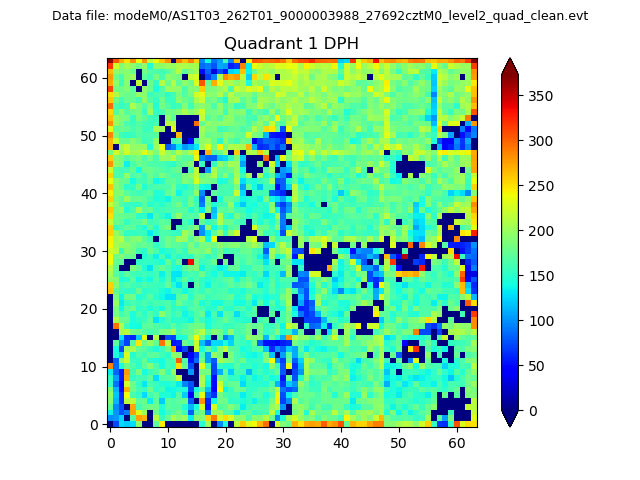 |
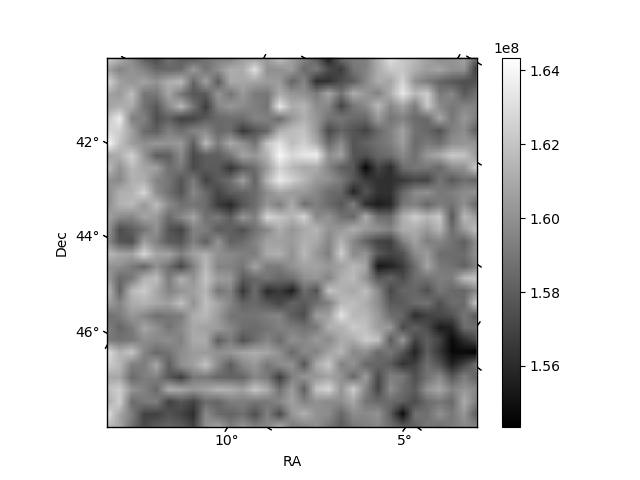
Quadrant B |
|---|---|---|---|
| Quadrant D | 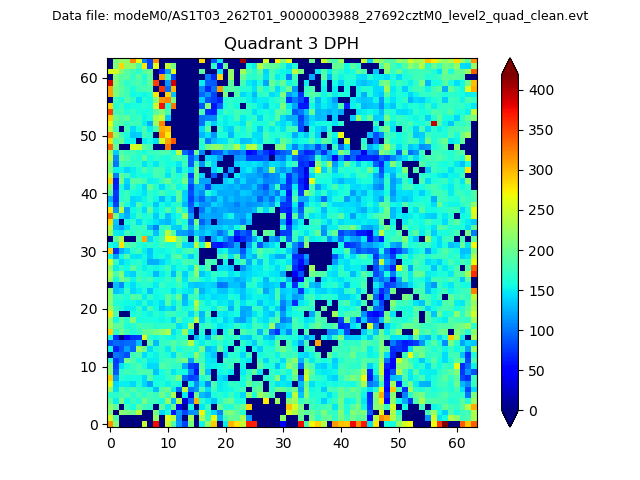 |
 |
Quadrant C |
| Plot type | Count rate plots | Images |
|---|---|---|
| Comparison with Poisson distribution Blue bars denote a histogram of data divided into 1 sec bins. Red curve is a Poisson curve with rate = median count rate of data. |
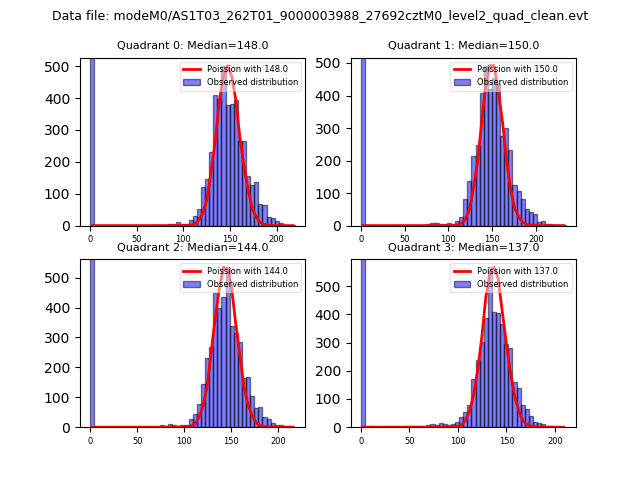 |
 |
| Quadrant-wise count rates Data is divided into 100 sec bins |
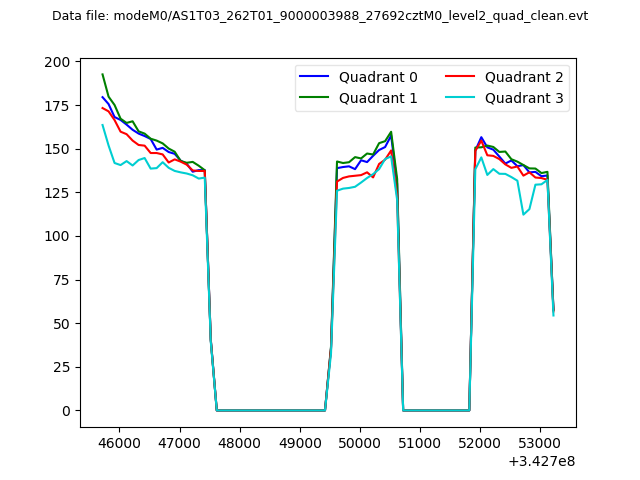 |
|
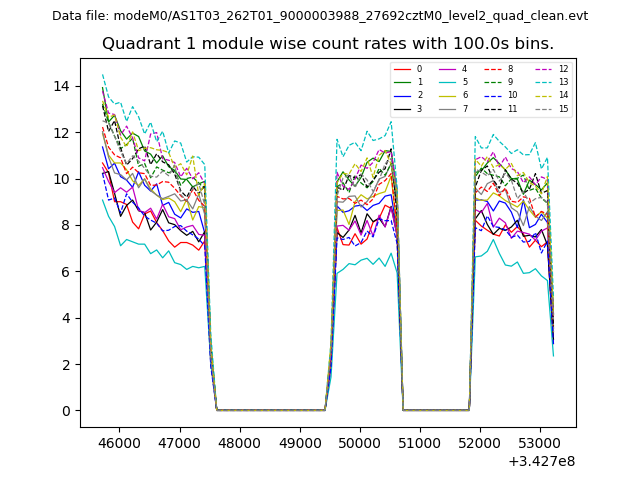
| Module-wise count rates for Quadrant A Data is divided into 100 sec bins |
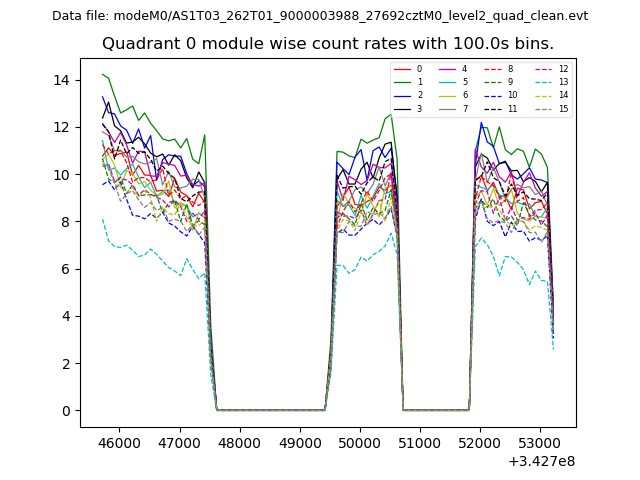 |
 |
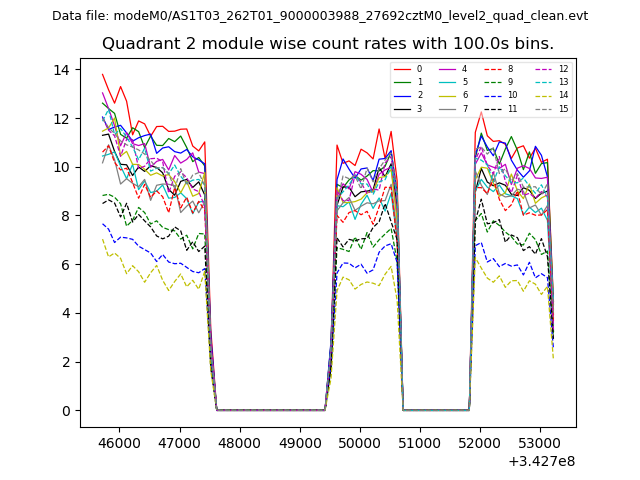
| Module-wise count rates for Quadrant B Data is divided into 100 sec bins |
 |
 |
| Module-wise count rates for Quadrant C Data is divided into 100 sec bins |
 |
 |
| Module-wise count rates for Quadrant D Data is divided into 100 sec bins |
 |
 |
| Parameter | Plot |
|---|---|
| CZT HV Monitor | 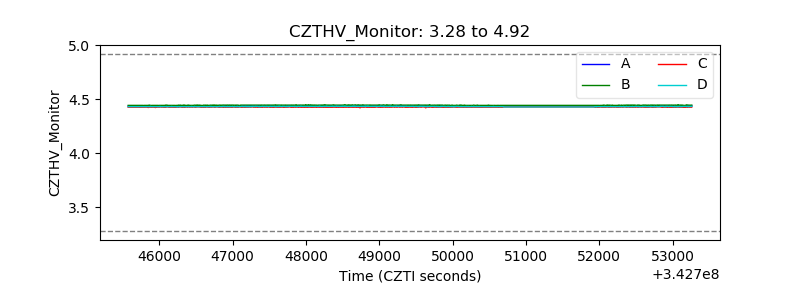 |
| D_VDD | 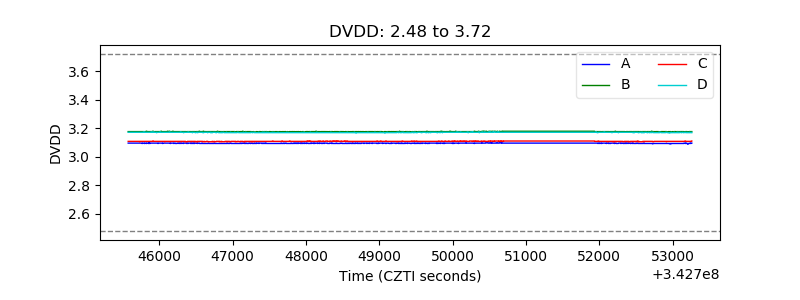 |
| Temperature 1 | 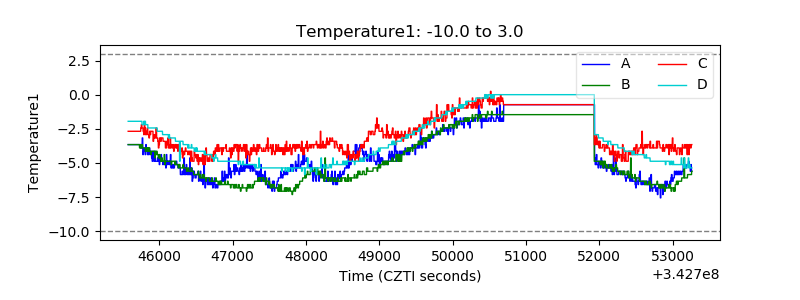 |
| Veto HV Monitor | 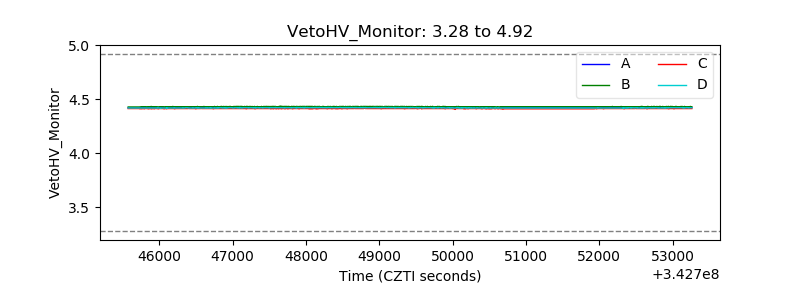 |
| Veto LLD | 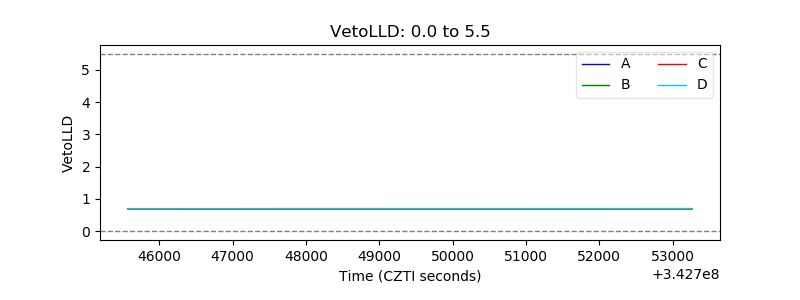 |
| Alpha Counter | 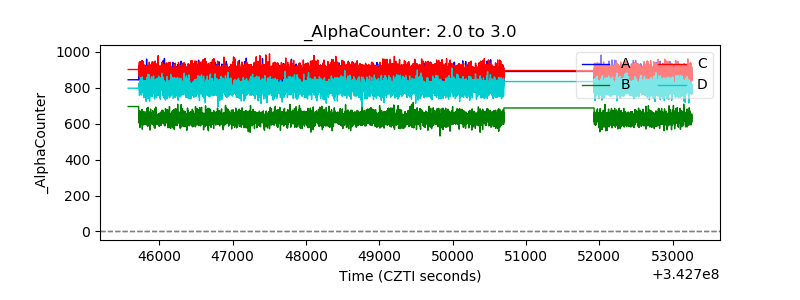 |
| _CPM_Rate | 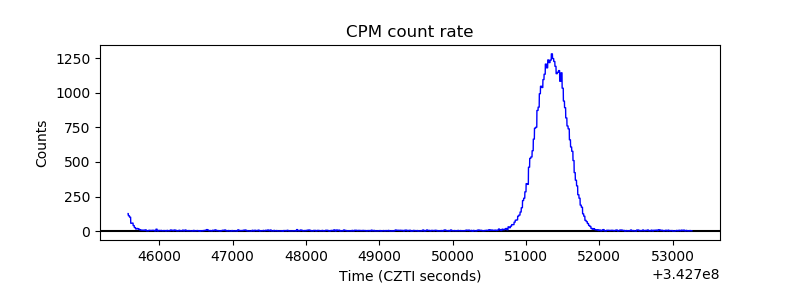 |
| CZT Counter | 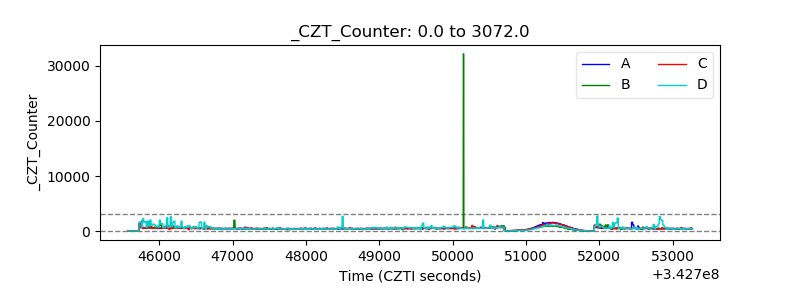 |
| +2.5 Volts monitor |  |
| +5 Volts monitor |  |
| _ROLL_ROT | 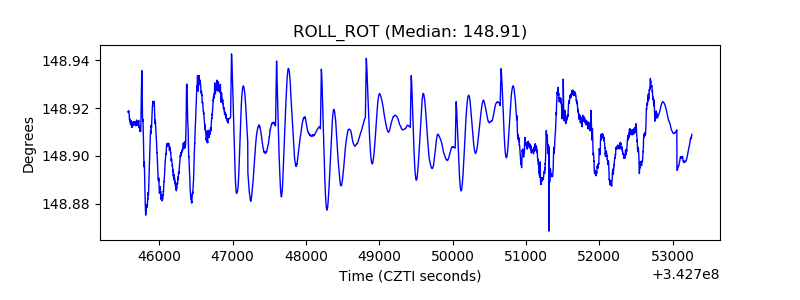 |
| _Roll_DEC | 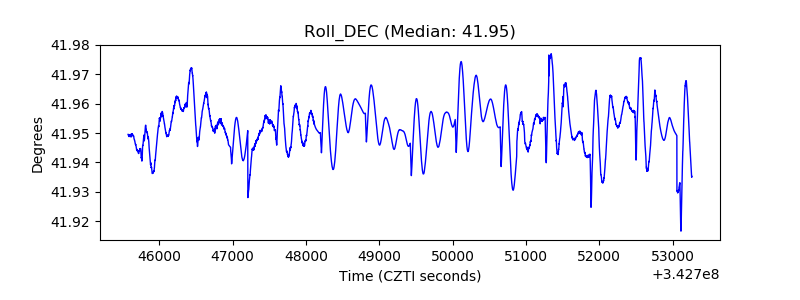 |
| _Roll_RA | 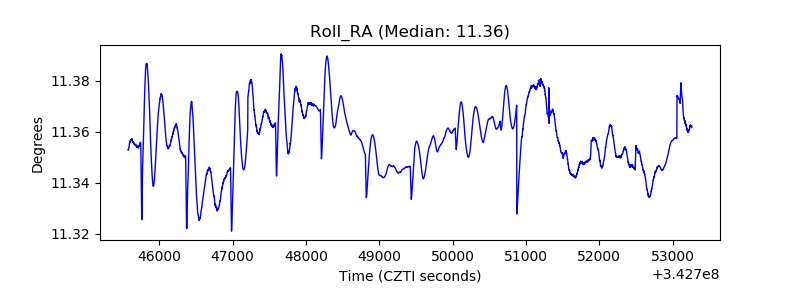 |
| Veto Counter |  |