| Param | Original file | Final file |
|---|---|---|
| Filename | modeM0/AS1T03_262T01_9000003988_27693cztM0_level2.evt | modeM0/AS1T03_262T01_9000003988_27693cztM0_level2_quad_clean.evt |
| Size (bytes) | 479,093,760 | 92,926,080 |
| Size | 456.9 MB | 88.6 MB |
| Events in quadrant A | 3,183,463 | 600,522 |
| Events in quadrant B | 3,313,162 | 611,444 |
| Events in quadrant C | 3,410,131 | 584,930 |
| Events in quadrant D | 4,148,573 | 551,210 |
| Mode M0 | |||
|---|---|---|---|
| Quadrant | BADHDUFLAG | Total packets | Discarded packets |
| A | 0 | 13795 | 0 |
| B | 0 | 14106 | 0 |
| C | 0 | 14345 | 0 |
| D | 0 | 16988 | 0 |
| Mode M9 | |||
|---|---|---|---|
| Quadrant | BADHDUFLAG | Total packets | Discarded packets |
| A | 0 | 14 | 0 |
| B | 0 | 15 | 0 |
| C | 0 | 15 | 0 |
| D | 0 | 15 | 0 |
| Quadrant | Total seconds | Saturated seconds | Saturation percentage |
|---|---|---|---|
| A | 6684 | 29 | 0.433872% |
| B | 6684 | 61 | 0.912627% |
| C | 6683 | 84 | 1.256921% |
| D | 6683 | 269 | 4.025138% |
Noise dominated data is calculated using 1-second bins in cleaned event files. If a bin has >2000 counts, and if more than 50% of those come from <1% of pixels, then it is considered to be noise-dominated and hence unusable.
| Quadrant | # 1 sec bins | Bins with >0 counts | Bins with >2000 counts | High rate bins dominated by noise | Noise dominated (total time) | Noise dominated (detector-on time) | Marked lightcurve |
|---|---|---|---|---|---|---|---|
| A | 7624 | 6685 | 1 | 1 | 0.01% | 0.01% | 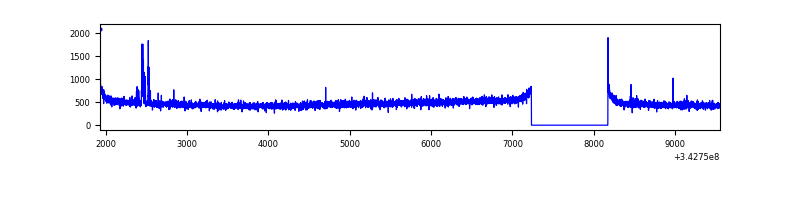 |
| B | 7624 | 6685 | 4 | 4 | 0.05% | 0.06% | 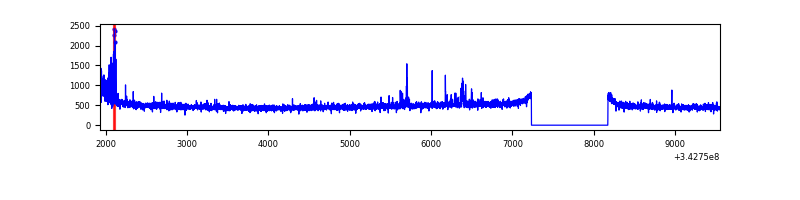 |
| C | 7623 | 6684 | 21 | 21 | 0.28% | 0.31% | 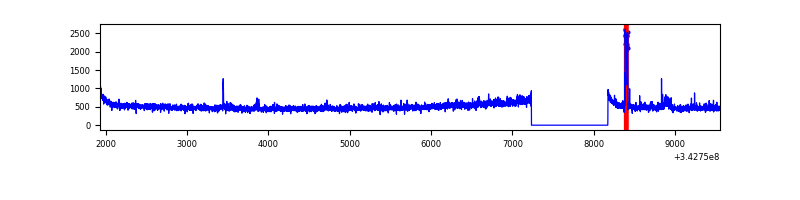 |
| D | 7623 | 6683 | 212 | 212 | 2.78% | 3.17% | 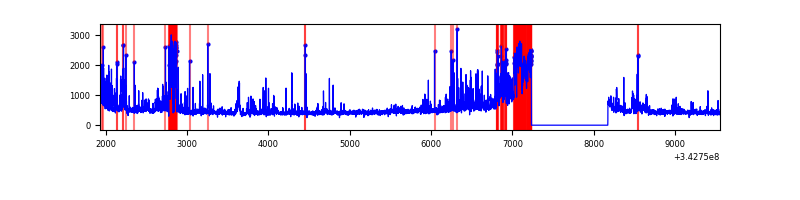 |
Top three noisy pixels from each quadrant. If the there are fewer than three noisy pixels in the level2.evt file, extra rows are filled as -1
| Pixel properties | Quadrant properties | ||||||
|---|---|---|---|---|---|---|---|
| Quadrant | DetID | PixID | Counts | Sigma | Mean | Median | Sigma |
| A | 6 | 16 | 35164 | 210.65 | 813 | 796 | 163.2 |
| A | 8 | 192 | 11838 | 67.68 | 813 | 796 | 163.2 |
| A | 13 | 254 | 11080 | 63.03 | 813 | 796 | 163.2 |
| B | 0 | 230 | 96706 | 622.41 | 813 | 792 | 154.1 |
| B | 12 | 111 | 19073 | 118.63 | 813 | 792 | 154.1 |
| B | 15 | 32 | 16930 | 104.72 | 813 | 792 | 154.1 |
| C | 3 | 233 | 189755 | 1031.61 | 789 | 795 | 183.2 |
| C | 14 | 238 | 126578 | 686.7 | 789 | 795 | 183.2 |
| C | 8 | 208 | 14483 | 74.73 | 789 | 795 | 183.2 |
| D | 1 | 52 | 665014 | 3650.78 | 770 | 750 | 182.0 |
| D | 12 | 2 | 401393 | 2201.93 | 770 | 750 | 182.0 |
| D | 2 | 250 | 76665 | 417.23 | 770 | 750 | 182.0 |
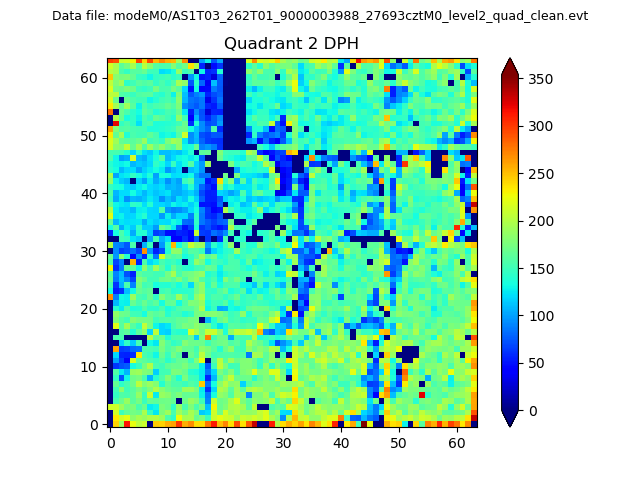
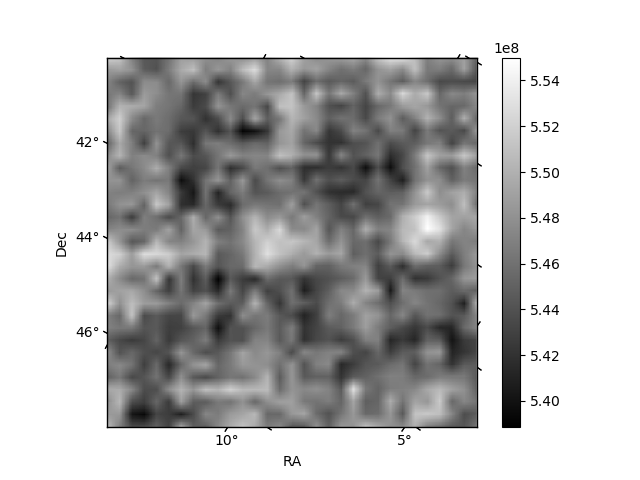
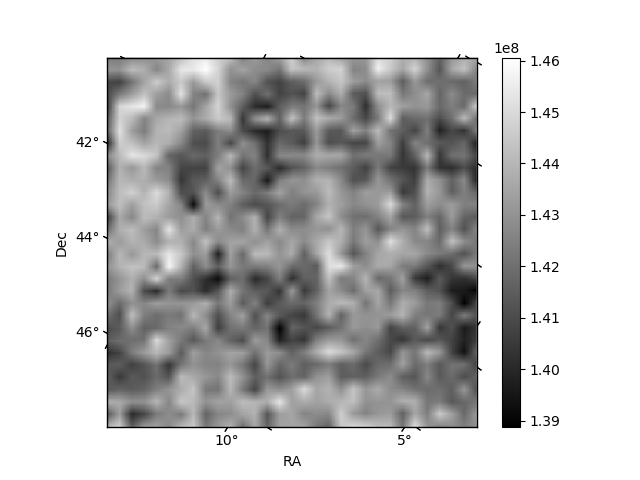
Histogram calculated using DETX and DETY for each event in the final _common_clean file
| Quadrant A | 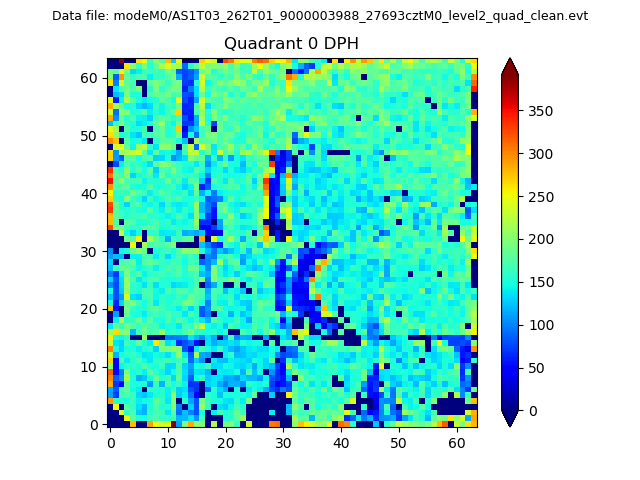 |
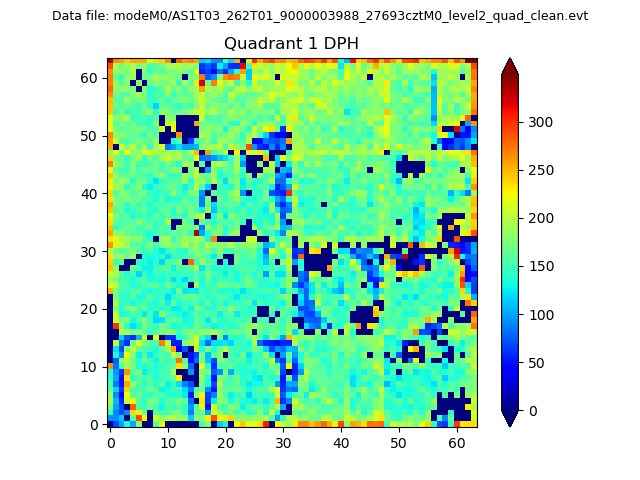 |
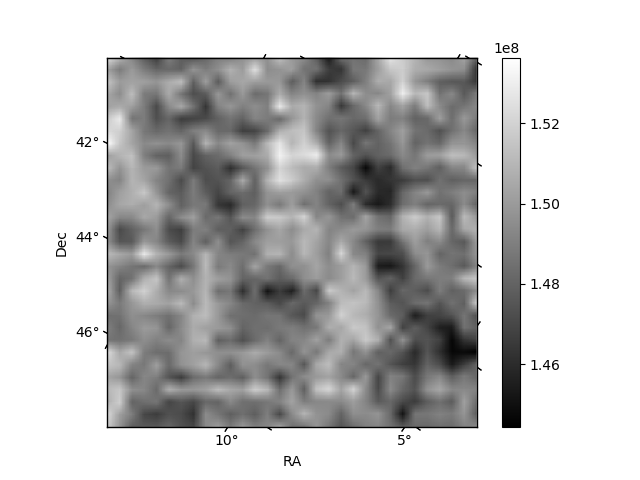
Quadrant B |
|---|---|---|---|
| Quadrant D | 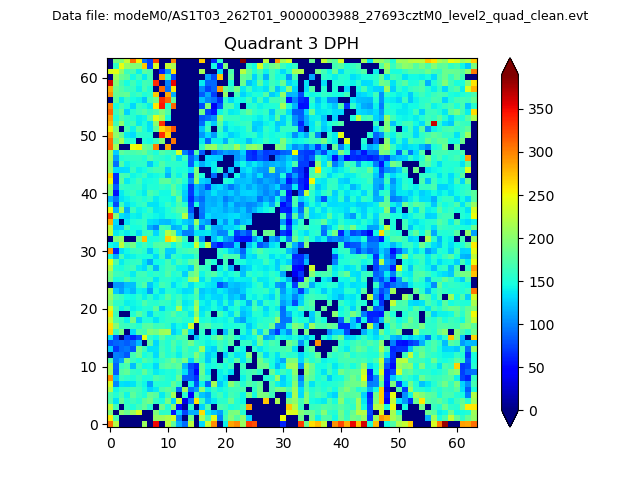 |
 |
Quadrant C |
| Plot type | Count rate plots | Images |
|---|---|---|
| Comparison with Poisson distribution Blue bars denote a histogram of data divided into 1 sec bins. Red curve is a Poisson curve with rate = median count rate of data. |
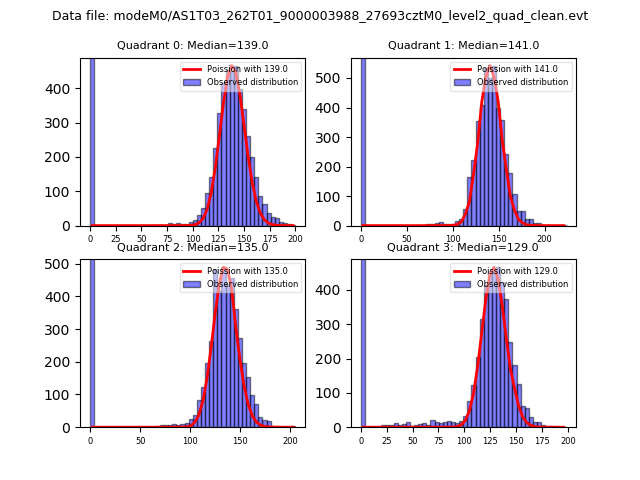 |
 |
| Quadrant-wise count rates Data is divided into 100 sec bins |
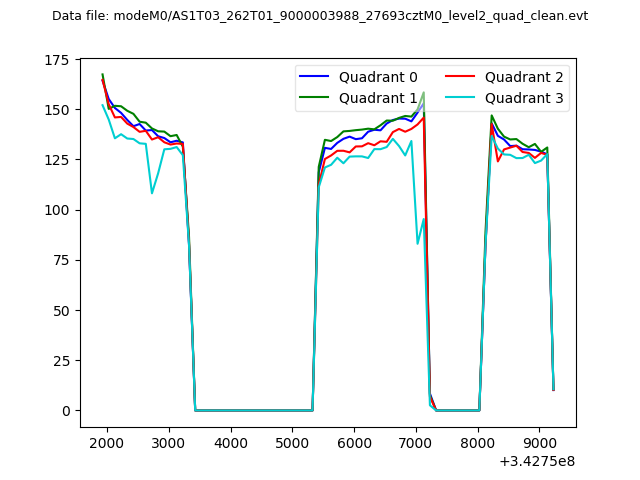 |
|
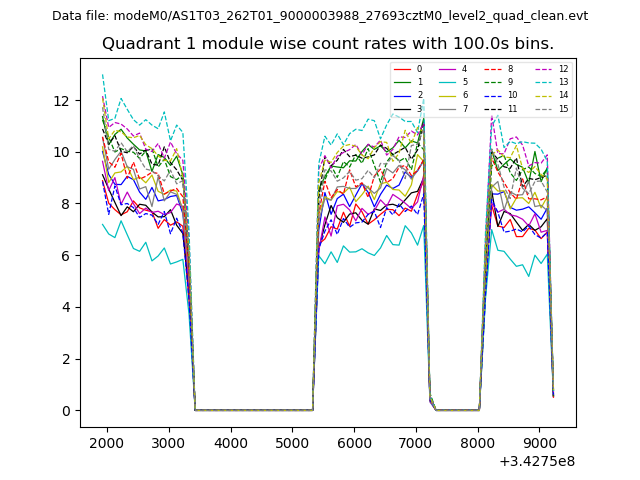
| Module-wise count rates for Quadrant A Data is divided into 100 sec bins |
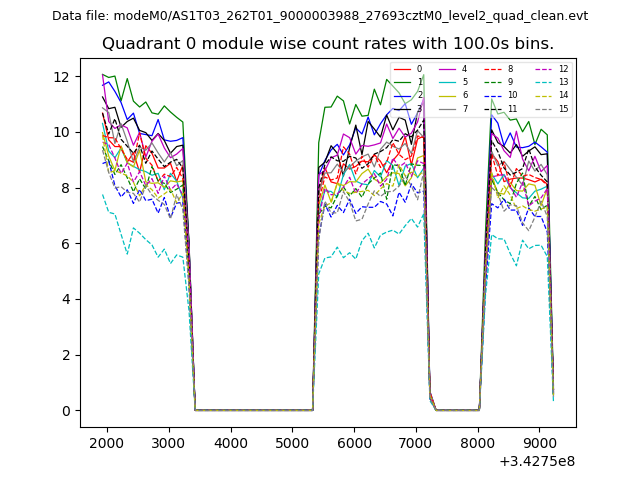 |
 |
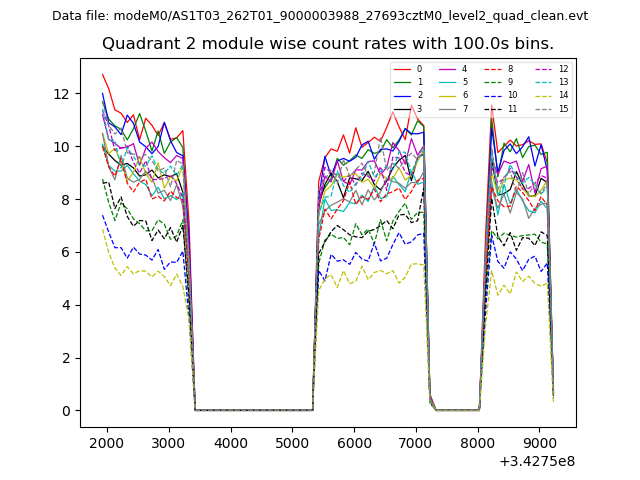
| Module-wise count rates for Quadrant B Data is divided into 100 sec bins |
 |
 |
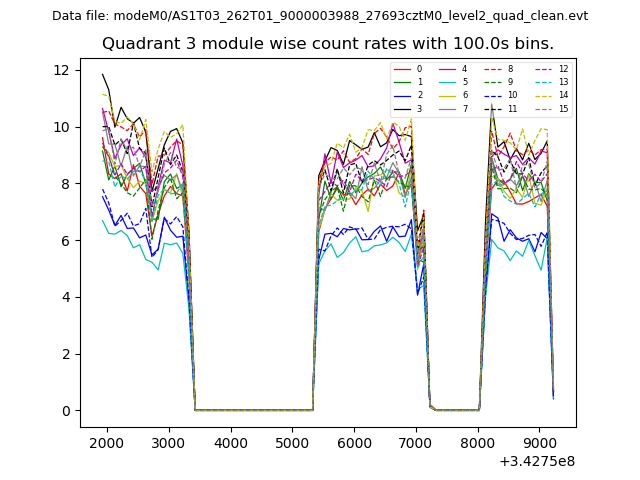
| Module-wise count rates for Quadrant C Data is divided into 100 sec bins |
 |
 |
| Module-wise count rates for Quadrant D Data is divided into 100 sec bins |
 |
 |
| Parameter | Plot |
|---|---|
| CZT HV Monitor | 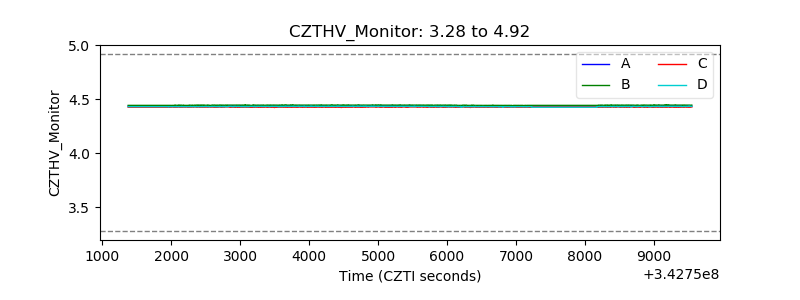 |
| D_VDD | 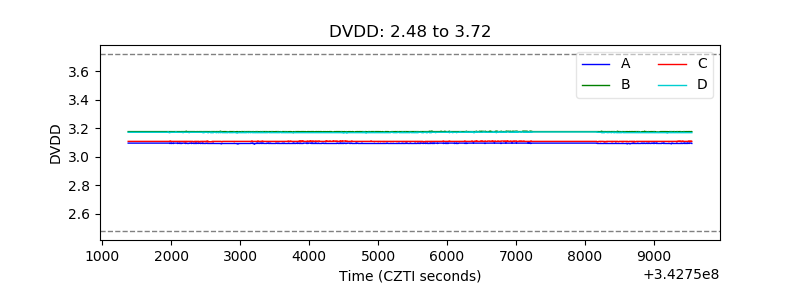 |
| Temperature 1 | 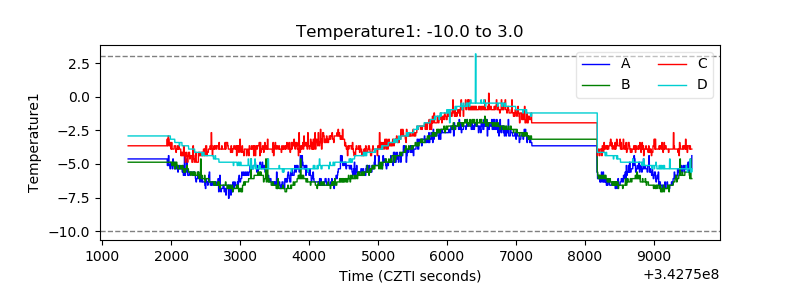 |
| Veto HV Monitor | 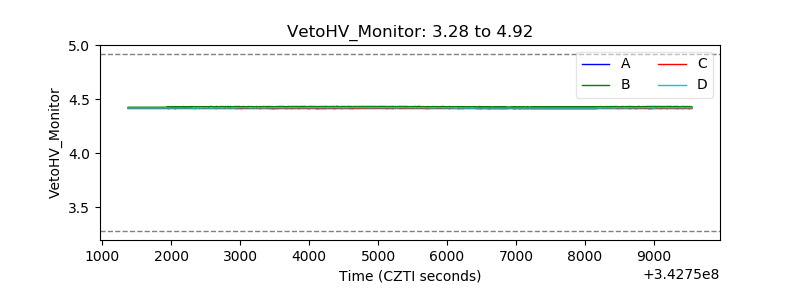 |
| Veto LLD | 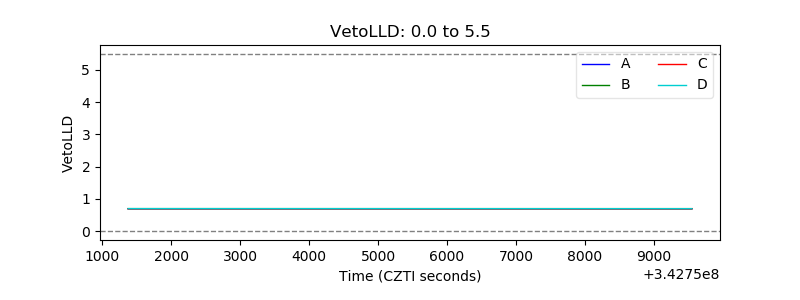 |
| Alpha Counter | 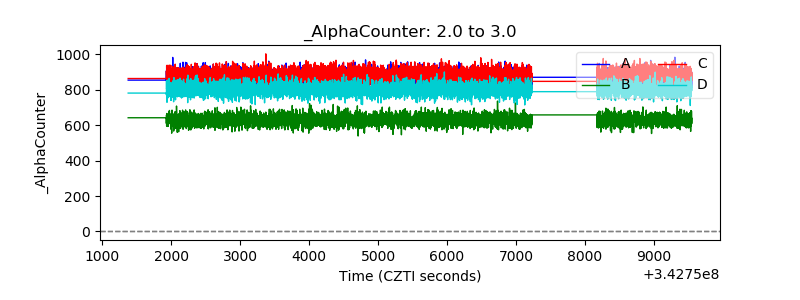 |
| _CPM_Rate | 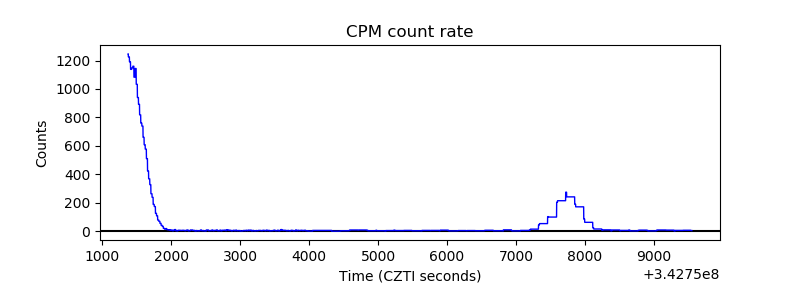 |
| CZT Counter | 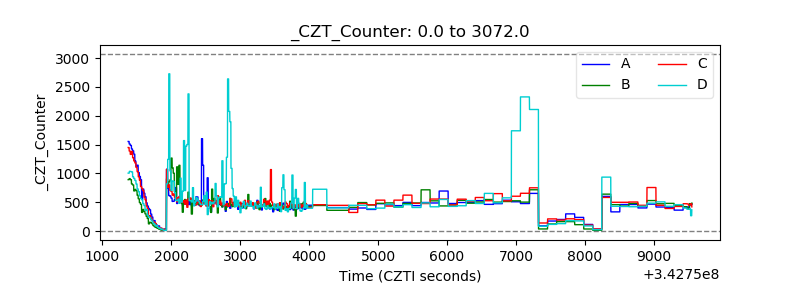 |
| +2.5 Volts monitor |  |
| +5 Volts monitor |  |
| _ROLL_ROT | 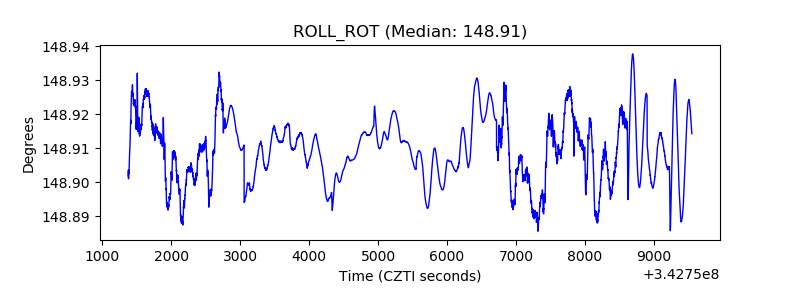 |
| _Roll_DEC | 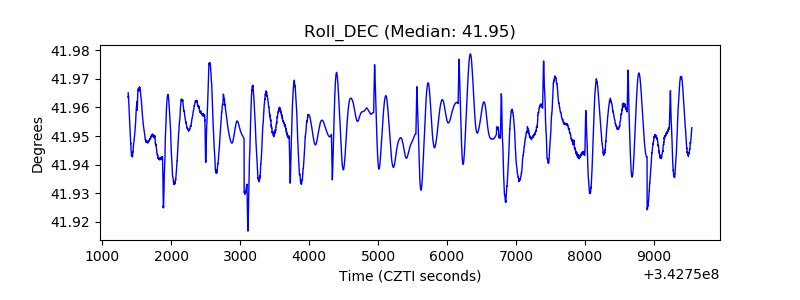 |
| _Roll_RA | 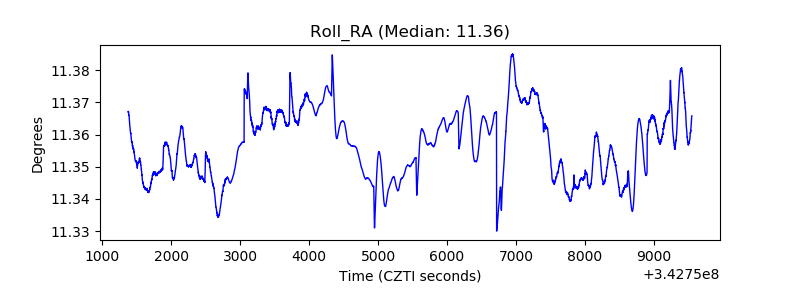 |
| Veto Counter | 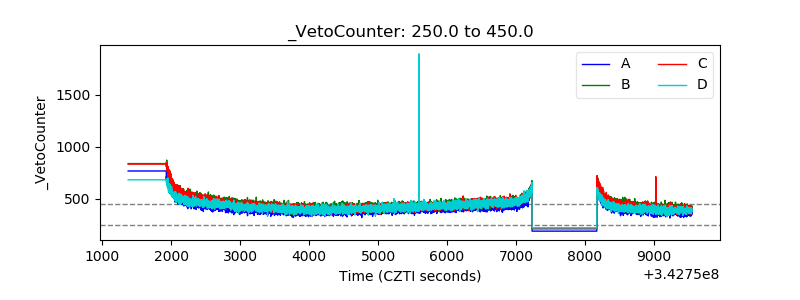 |