| Param | Original file | Final file |
|---|---|---|
| Filename | modeM0/AS1T03_262T01_9000003988_27694cztM0_level2.evt | modeM0/AS1T03_262T01_9000003988_27694cztM0_level2_quad_clean.evt |
| Size (bytes) | 527,011,200 | 93,412,800 |
| Size | 502.6 MB | 89.1 MB |
| Events in quadrant A | 3,395,878 | 591,564 |
| Events in quadrant B | 3,469,900 | 603,896 |
| Events in quadrant C | 3,610,038 | 579,296 |
| Events in quadrant D | 4,995,359 | 552,091 |
| Mode M0 | |||
|---|---|---|---|
| Quadrant | BADHDUFLAG | Total packets | Discarded packets |
| A | 0 | 14843 | 0 |
| B | 0 | 14934 | 0 |
| C | 0 | 15250 | 0 |
| D | 0 | 19884 | 0 |
| Mode M9 | |||
|---|---|---|---|
| Quadrant | BADHDUFLAG | Total packets | Discarded packets |
| A | 0 | 10 | 0 |
| B | 0 | 11 | 0 |
| C | 0 | 11 | 0 |
| D | 0 | 11 | 0 |
| Quadrant | Total seconds | Saturated seconds | Saturation percentage |
|---|---|---|---|
| A | 7200 | 92 | 1.277778% |
| B | 7199 | 130 | 1.805806% |
| C | 7199 | 155 | 2.153077% |
| D | 7199 | 411 | 5.709126% |
Noise dominated data is calculated using 1-second bins in cleaned event files. If a bin has >2000 counts, and if more than 50% of those come from <1% of pixels, then it is considered to be noise-dominated and hence unusable.
| Quadrant | # 1 sec bins | Bins with >0 counts | Bins with >2000 counts | High rate bins dominated by noise | Noise dominated (total time) | Noise dominated (detector-on time) | Marked lightcurve |
|---|---|---|---|---|---|---|---|
| A | 7625 | 7200 | 0 | 0 | 0.00% | 0.00% | 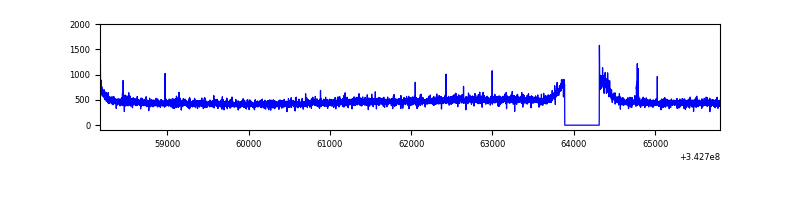 |
| B | 7624 | 7199 | 1 | 1 | 0.01% | 0.01% | 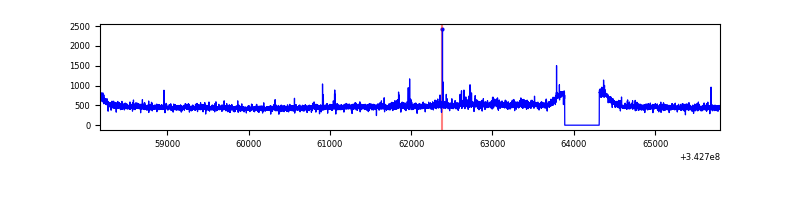 |
| C | 7624 | 7199 | 22 | 22 | 0.29% | 0.31% | 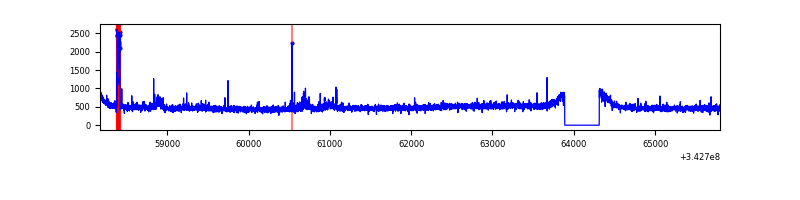 |
| D | 7624 | 7199 | 276 | 276 | 3.62% | 3.83% | 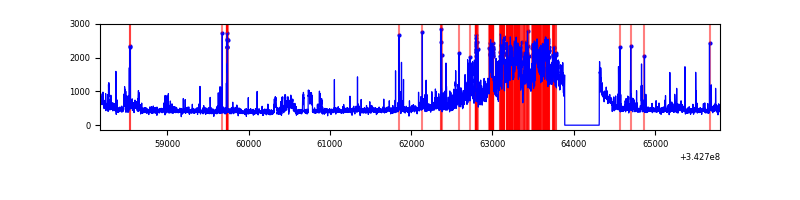 |
Top three noisy pixels from each quadrant. If the there are fewer than three noisy pixels in the level2.evt file, extra rows are filled as -1
| Pixel properties | Quadrant properties | ||||||
|---|---|---|---|---|---|---|---|
| Quadrant | DetID | PixID | Counts | Sigma | Mean | Median | Sigma |
| A | 6 | 16 | 15066 | 80.41 | 874 | 854 | 176.7 |
| A | 13 | 254 | 11837 | 62.14 | 874 | 854 | 176.7 |
| A | 8 | 192 | 10659 | 55.48 | 874 | 854 | 176.7 |
| B | 12 | 111 | 21096 | 120.03 | 872 | 848 | 168.7 |
| B | 0 | 190 | 20552 | 116.81 | 872 | 848 | 168.7 |
| B | 11 | 111 | 18593 | 105.2 | 872 | 848 | 168.7 |
| C | 3 | 233 | 151098 | 755.61 | 847 | 852 | 198.8 |
| C | 14 | 238 | 135458 | 676.96 | 847 | 852 | 198.8 |
| C | 8 | 208 | 22067 | 106.69 | 847 | 852 | 198.8 |
| D | 12 | 2 | 785702 | 3921.46 | 838 | 813 | 200.2 |
| D | 1 | 52 | 741184 | 3699.04 | 838 | 813 | 200.2 |
| D | 11 | 176 | 128006 | 635.48 | 838 | 813 | 200.2 |
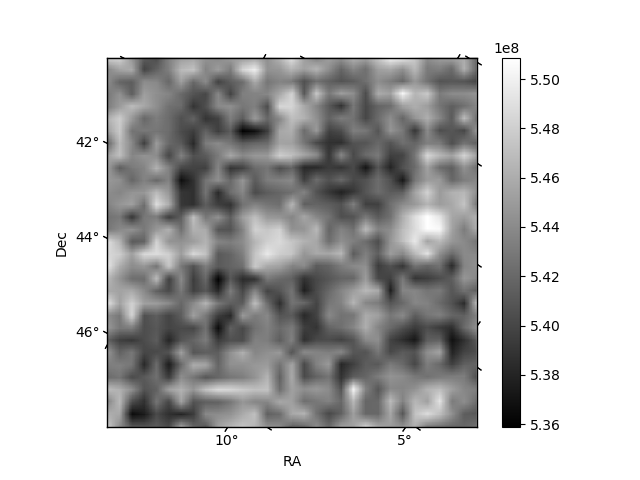
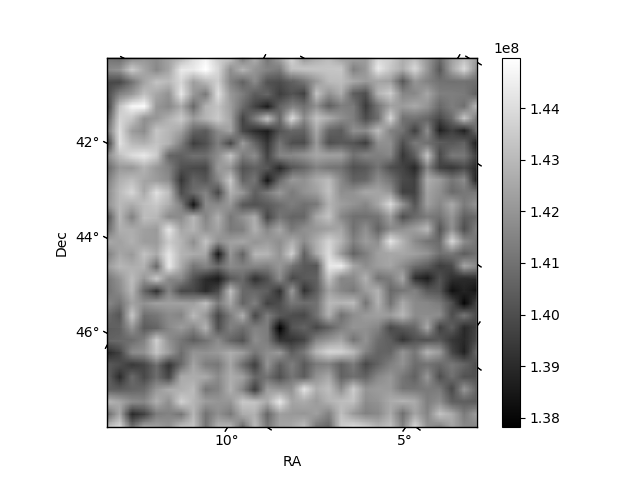
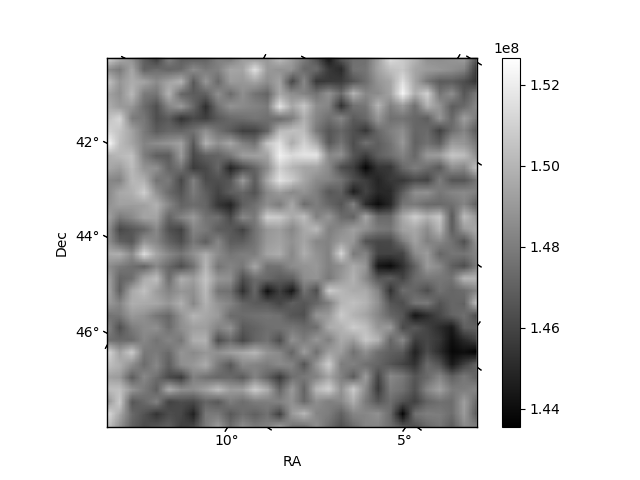
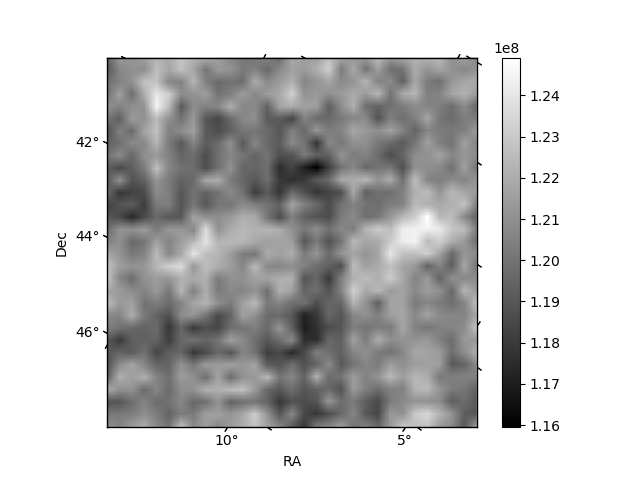
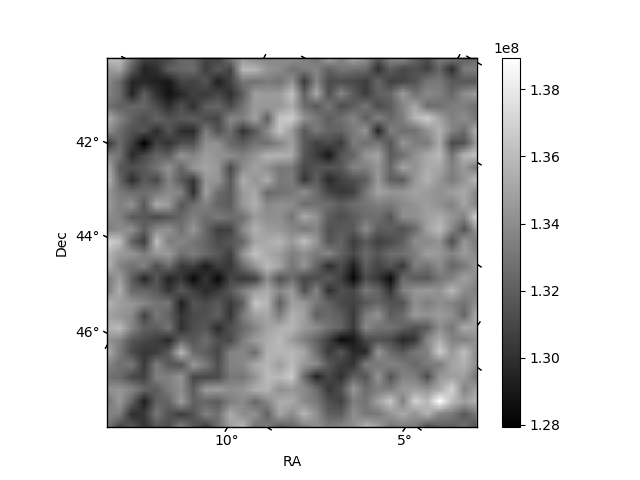
Histogram calculated using DETX and DETY for each event in the final _common_clean file
| Quadrant A | 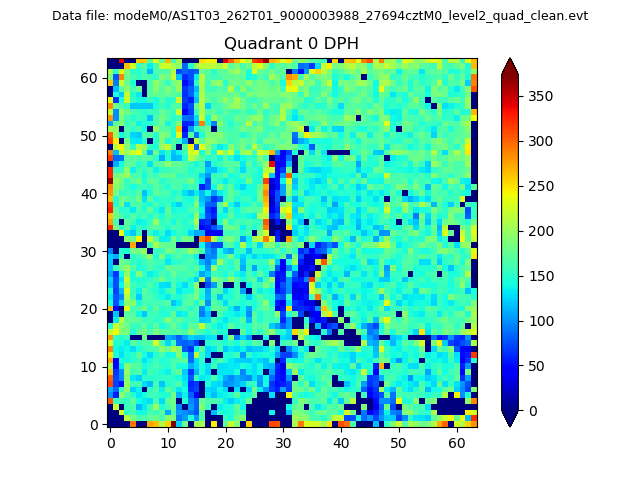 |
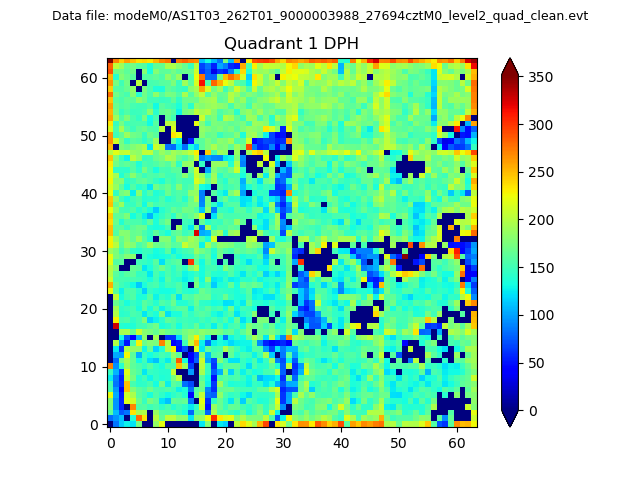 |
Quadrant B |
|---|---|---|---|
| Quadrant D | 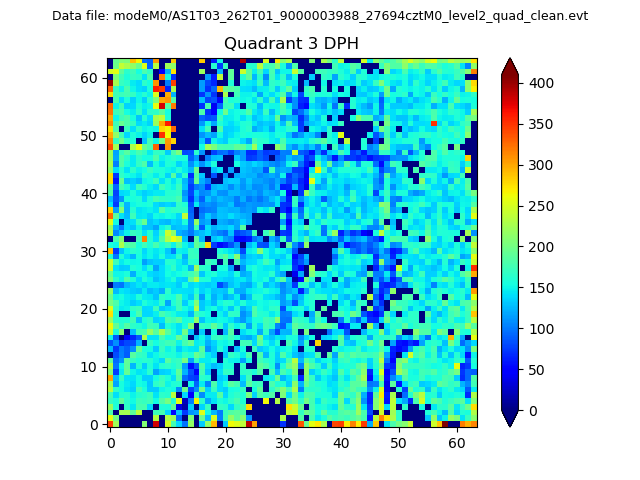 |
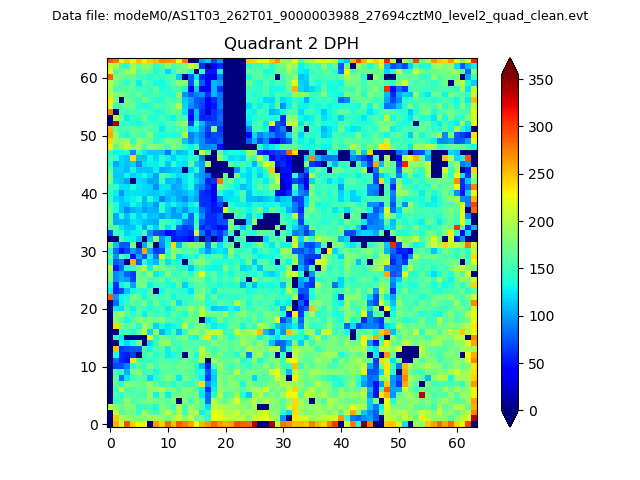 |
Quadrant C |
| Plot type | Count rate plots | Images |
|---|---|---|
| Comparison with Poisson distribution Blue bars denote a histogram of data divided into 1 sec bins. Red curve is a Poisson curve with rate = median count rate of data. |
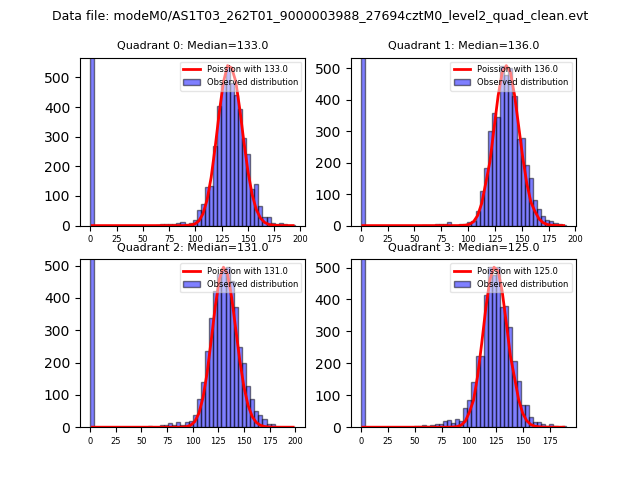 |
 |
| Quadrant-wise count rates Data is divided into 100 sec bins |
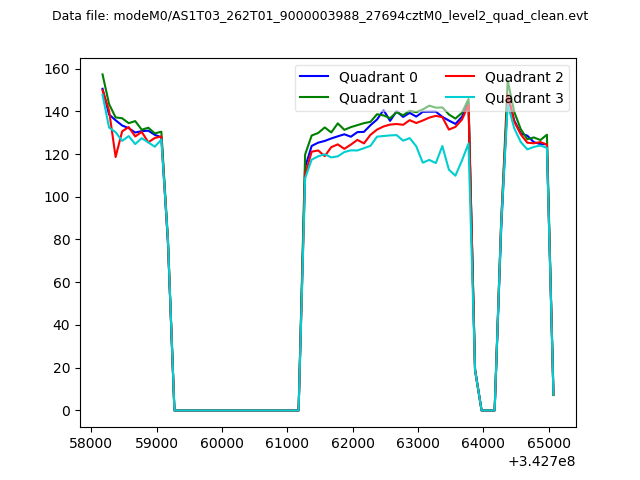 |
|
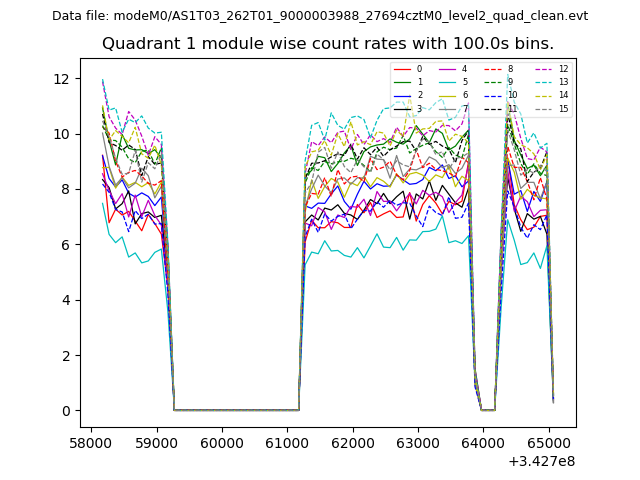
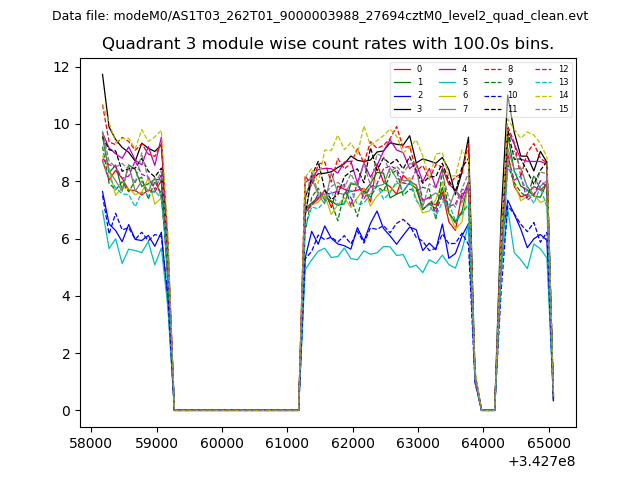
| Module-wise count rates for Quadrant A Data is divided into 100 sec bins |
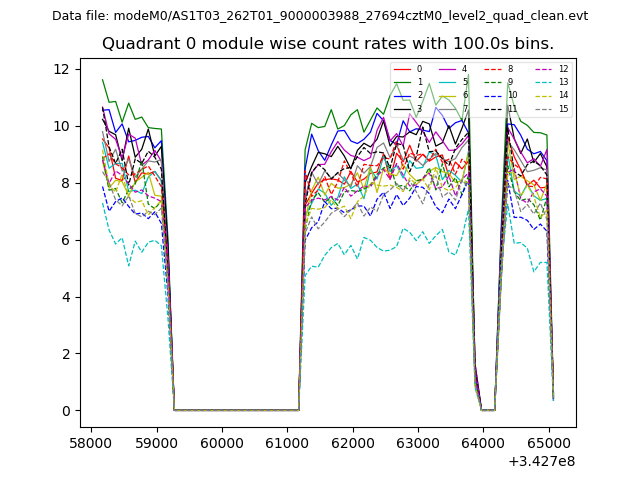 |
 |
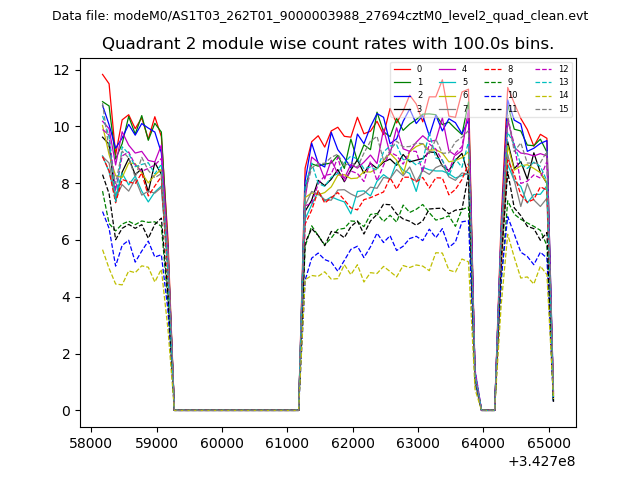
| Module-wise count rates for Quadrant B Data is divided into 100 sec bins |
 |
 |
| Module-wise count rates for Quadrant C Data is divided into 100 sec bins |
 |
 |
| Module-wise count rates for Quadrant D Data is divided into 100 sec bins |
 |
 |
| Parameter | Plot |
|---|---|
| CZT HV Monitor | 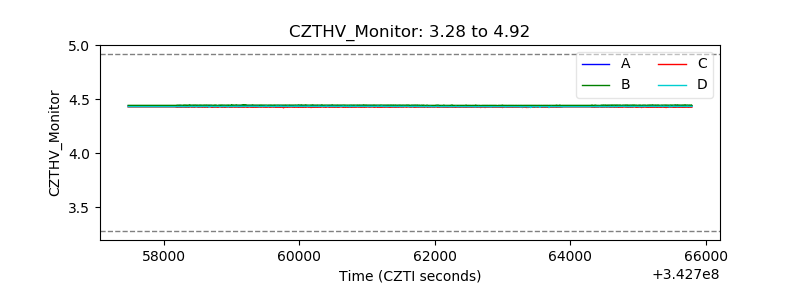 |
| D_VDD | 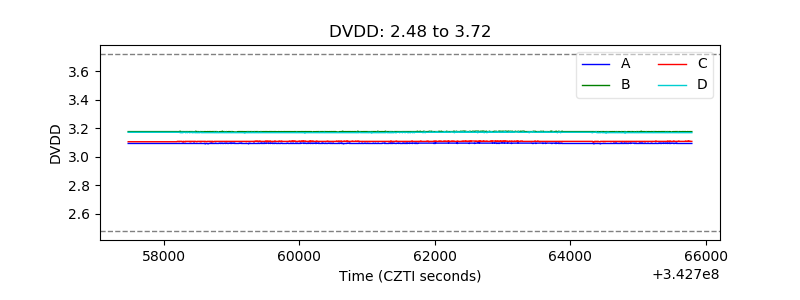 |
| Temperature 1 | 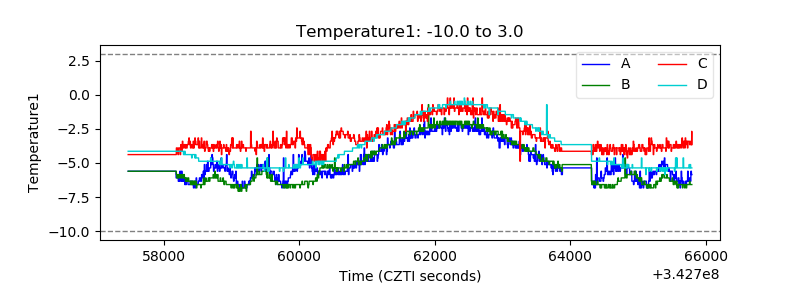 |
| Veto HV Monitor | 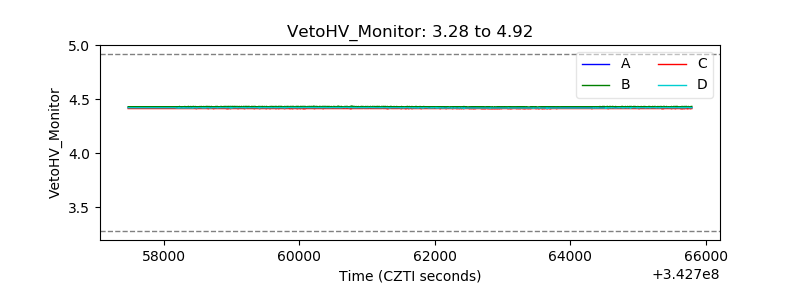 |
| Veto LLD | 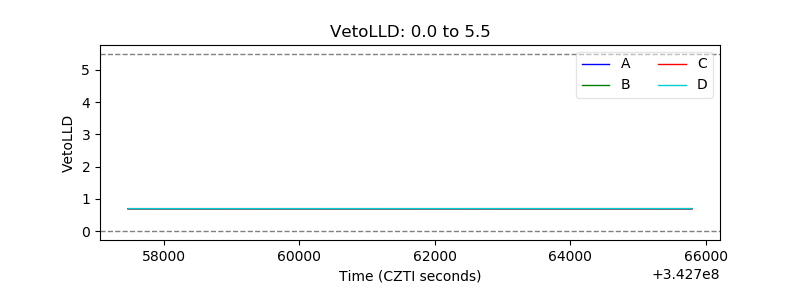 |
| Alpha Counter | 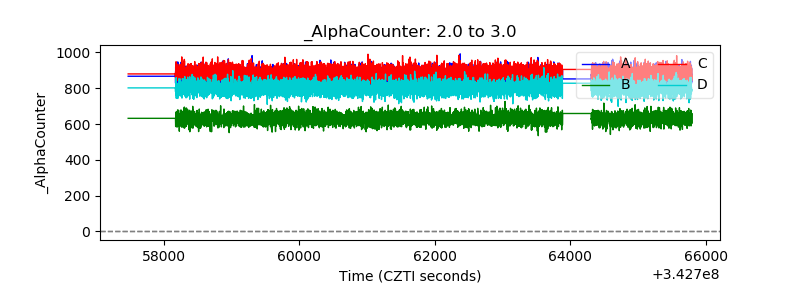 |
| _CPM_Rate | 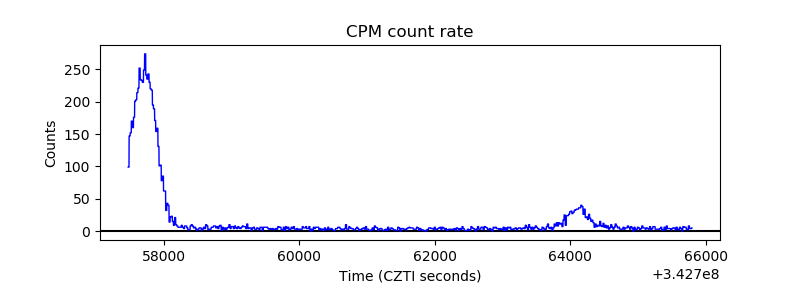 |
| CZT Counter | 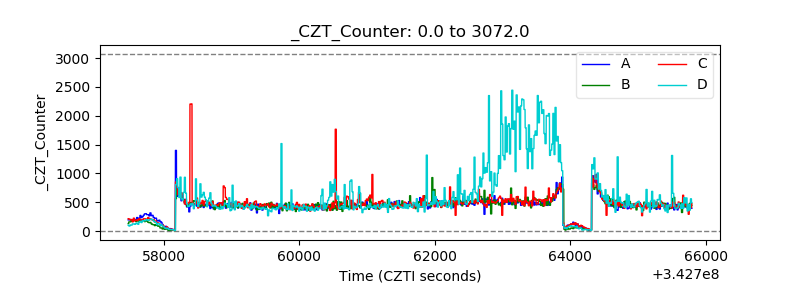 |
| +2.5 Volts monitor |  |
| +5 Volts monitor |  |
| _ROLL_ROT | 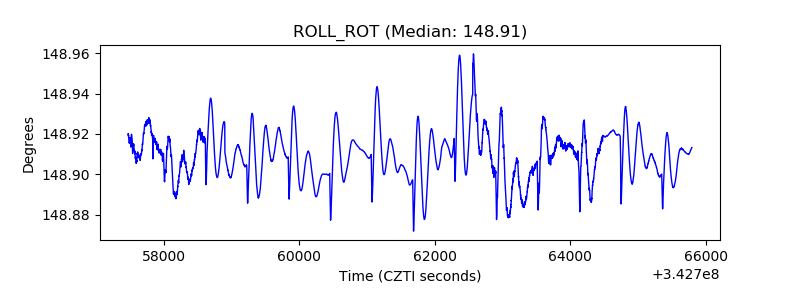 |
| _Roll_DEC | 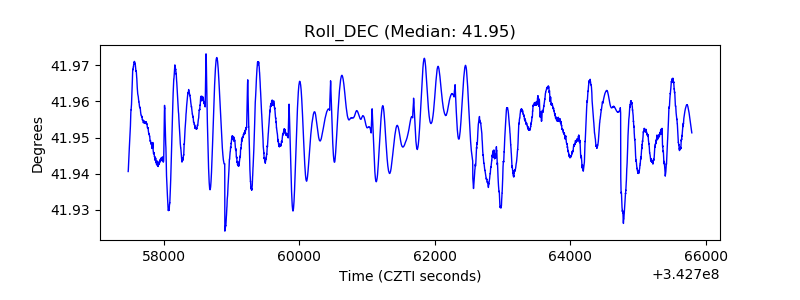 |
| _Roll_RA | 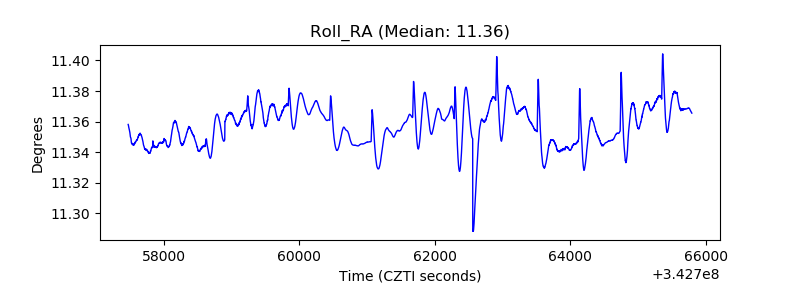 |
| Veto Counter | 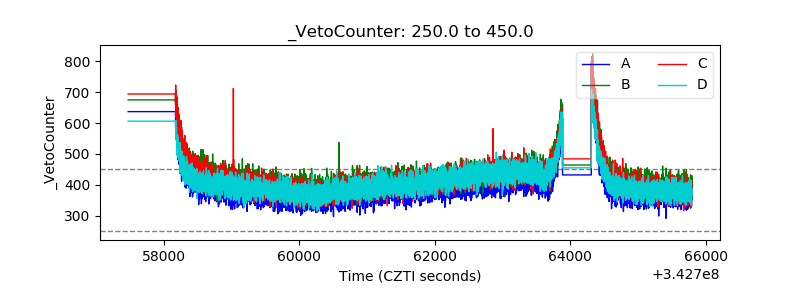 |