| Param | Original file | Final file |
|---|---|---|
| Filename | modeM0/AS1T03_262T01_9000003988_27695cztM0_level2.evt | modeM0/AS1T03_262T01_9000003988_27695cztM0_level2_quad_clean.evt |
| Size (bytes) | 593,913,600 | 105,868,800 |
| Size | 566.4 MB | 101.0 MB |
| Events in quadrant A | 3,993,720 | 668,719 |
| Events in quadrant B | 4,132,576 | 675,805 |
| Events in quadrant C | 4,220,529 | 653,940 |
| Events in quadrant D | 5,078,472 | 632,483 |
| Mode M0 | |||
|---|---|---|---|
| Quadrant | BADHDUFLAG | Total packets | Discarded packets |
| A | 0 | 17279 | 0 |
| B | 0 | 17524 | 0 |
| C | 0 | 17713 | 0 |
| D | 0 | 20594 | 0 |
| Mode M9 | |||
|---|---|---|---|
| Quadrant | BADHDUFLAG | Total packets | Discarded packets |
| A | 0 | 5 | 0 |
| B | 0 | 5 | 0 |
| C | 0 | 5 | 0 |
| D | 0 | 5 | 0 |
| Quadrant | Total seconds | Saturated seconds | Saturation percentage |
|---|---|---|---|
| A | 8268 | 241 | 2.914852% |
| B | 8269 | 335 | 4.051276% |
| C | 8269 | 295 | 3.567541% |
| D | 8269 | 382 | 4.619664% |
Noise dominated data is calculated using 1-second bins in cleaned event files. If a bin has >2000 counts, and if more than 50% of those come from <1% of pixels, then it is considered to be noise-dominated and hence unusable.
| Quadrant | # 1 sec bins | Bins with >0 counts | Bins with >2000 counts | High rate bins dominated by noise | Noise dominated (total time) | Noise dominated (detector-on time) | Marked lightcurve |
|---|---|---|---|---|---|---|---|
| A | 8813 | 8268 | 0 | 0 | 0.00% | 0.00% | 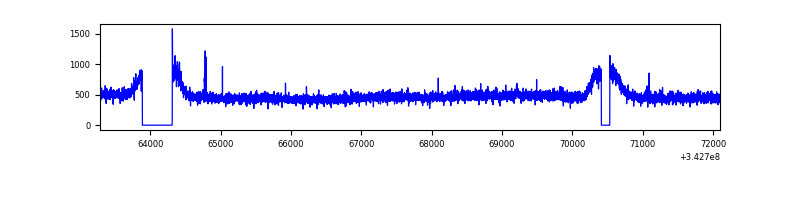 |
| B | 8814 | 8269 | 0 | 0 | 0.00% | 0.00% | 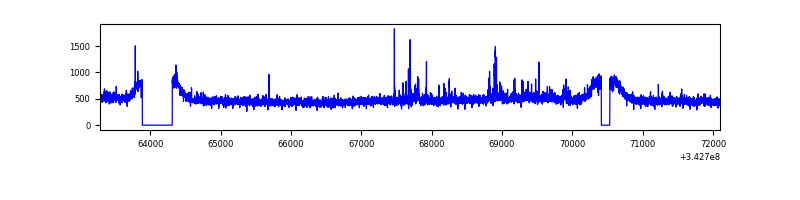 |
| C | 8814 | 8269 | 2 | 2 | 0.02% | 0.02% | 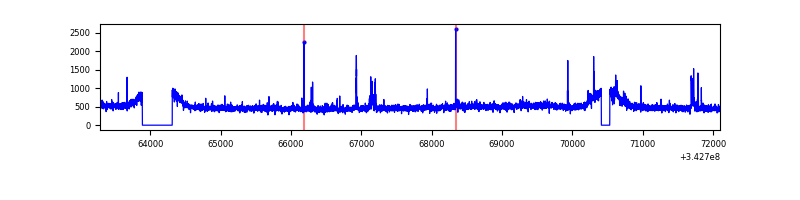 |
| D | 8814 | 8270 | 167 | 167 | 1.89% | 2.02% | 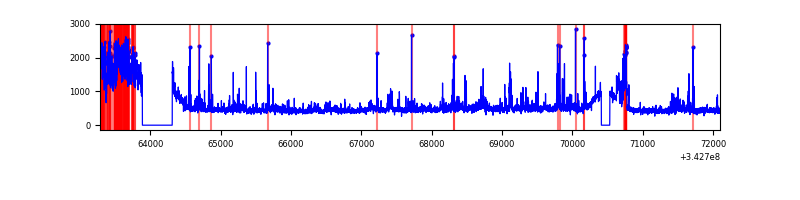 |
Top three noisy pixels from each quadrant. If the there are fewer than three noisy pixels in the level2.evt file, extra rows are filled as -1
| Pixel properties | Quadrant properties | ||||||
|---|---|---|---|---|---|---|---|
| Quadrant | DetID | PixID | Counts | Sigma | Mean | Median | Sigma |
| A | 6 | 16 | 13816 | 61.35 | 1029 | 1004 | 208.8 |
| A | 13 | 254 | 13422 | 59.46 | 1029 | 1004 | 208.8 |
| A | 3 | 137 | 10429 | 45.13 | 1029 | 1004 | 208.8 |
| B | 0 | 190 | 51158 | 250.19 | 1026 | 998 | 200.5 |
| B | 0 | 230 | 25282 | 121.13 | 1026 | 998 | 200.5 |
| B | 12 | 111 | 25213 | 120.78 | 1026 | 998 | 200.5 |
| C | 14 | 238 | 156946 | 661.82 | 996 | 998 | 235.6 |
| C | 3 | 233 | 119051 | 501.0 | 996 | 998 | 235.6 |
| C | 2 | 16 | 45253 | 187.81 | 996 | 998 | 235.6 |
| D | 1 | 52 | 528640 | 2203.11 | 996 | 965 | 239.5 |
| D | 12 | 2 | 501403 | 2089.39 | 996 | 965 | 239.5 |
| D | 6 | 112 | 95322 | 393.95 | 996 | 965 | 239.5 |
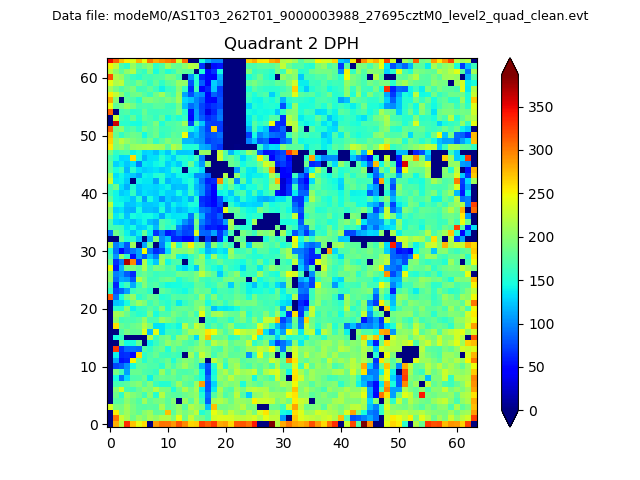
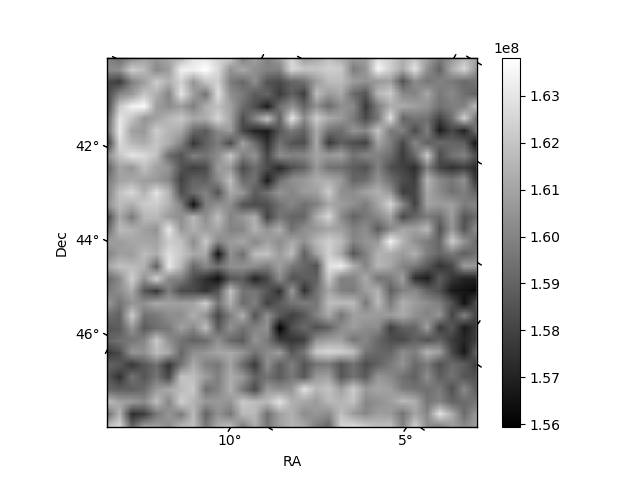
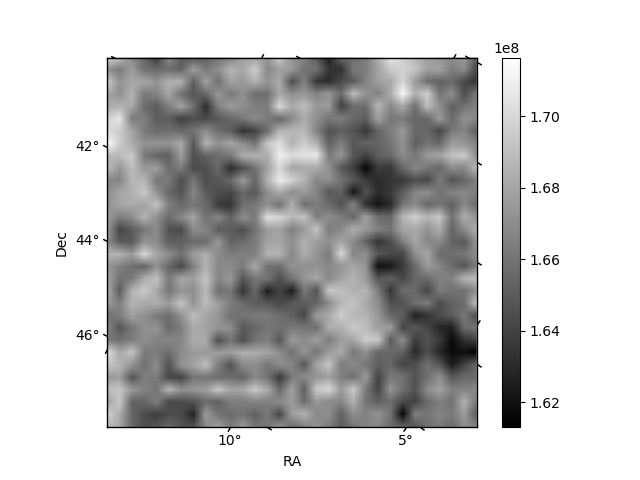
Histogram calculated using DETX and DETY for each event in the final _common_clean file
| Quadrant A | 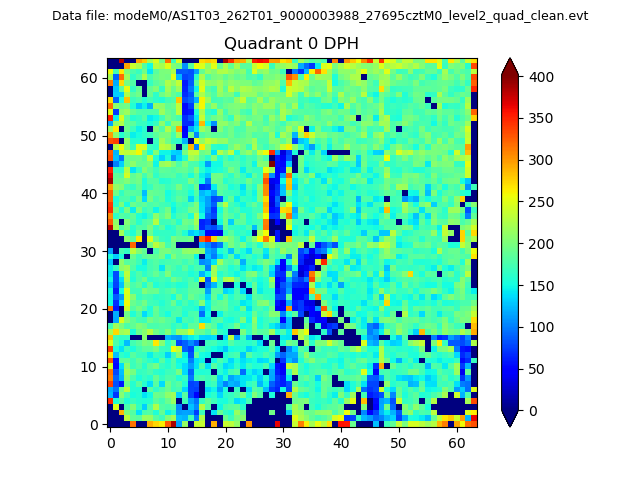 |
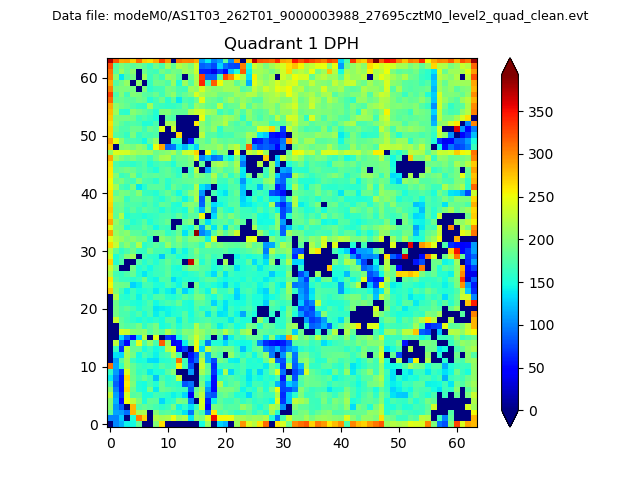 |
Quadrant B |
|---|---|---|---|
| Quadrant D | 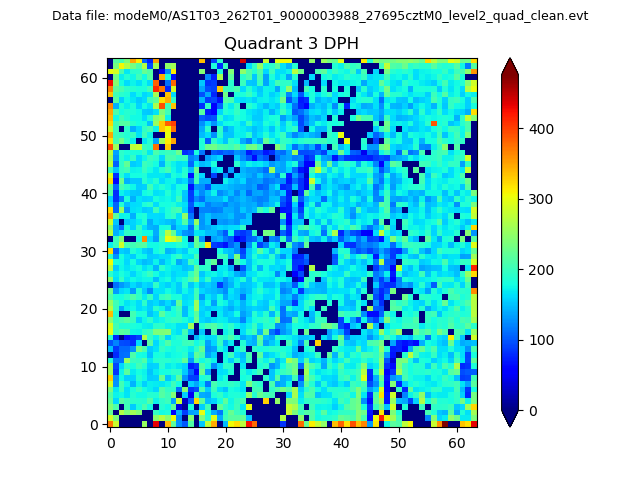 |
 |
Quadrant C |
| Plot type | Count rate plots | Images |
|---|---|---|
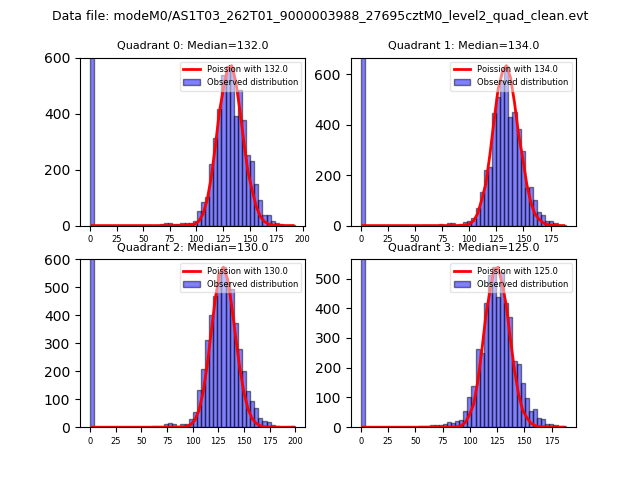
| Comparison with Poisson distribution Blue bars denote a histogram of data divided into 1 sec bins. Red curve is a Poisson curve with rate = median count rate of data. |
 |
 |
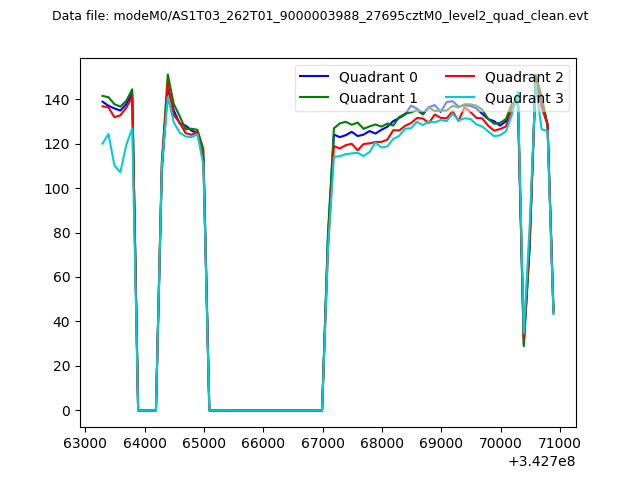
| Quadrant-wise count rates Data is divided into 100 sec bins |
 |
|
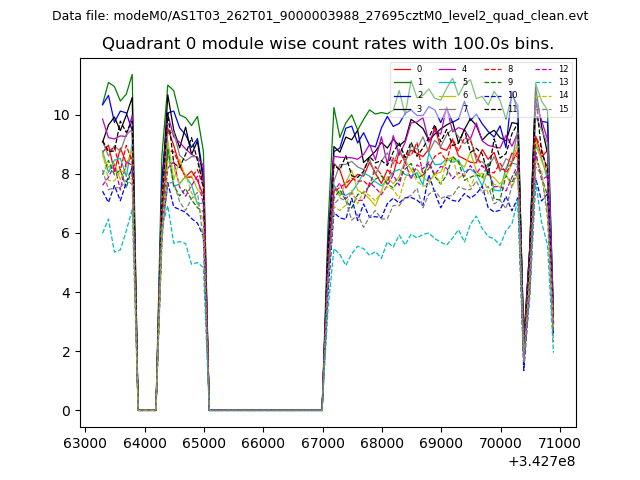
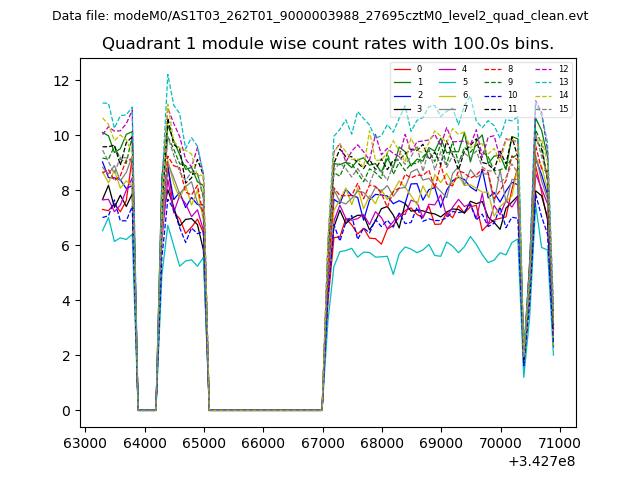
| Module-wise count rates for Quadrant A Data is divided into 100 sec bins |
 |
 |
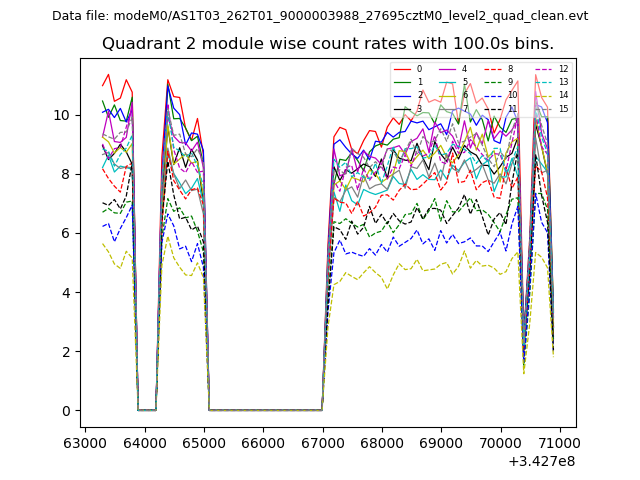
| Module-wise count rates for Quadrant B Data is divided into 100 sec bins |
 |
 |
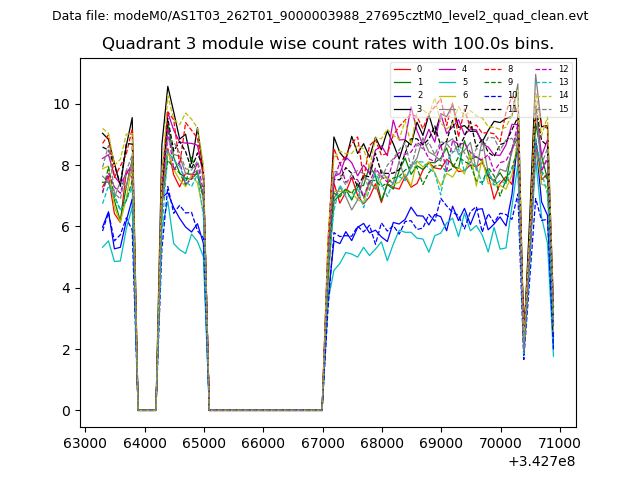
| Module-wise count rates for Quadrant C Data is divided into 100 sec bins |
 |
 |
| Module-wise count rates for Quadrant D Data is divided into 100 sec bins |
 |
 |
| Parameter | Plot |
|---|---|
| CZT HV Monitor | 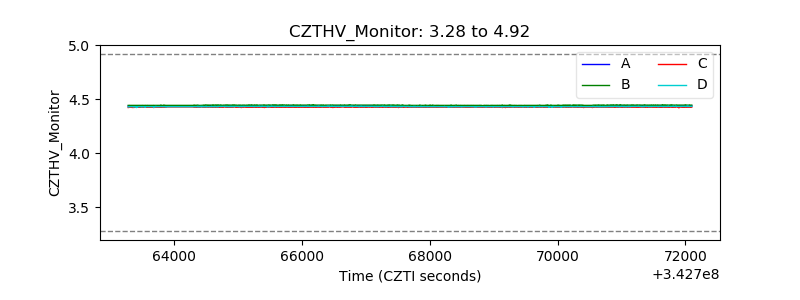 |
| D_VDD | 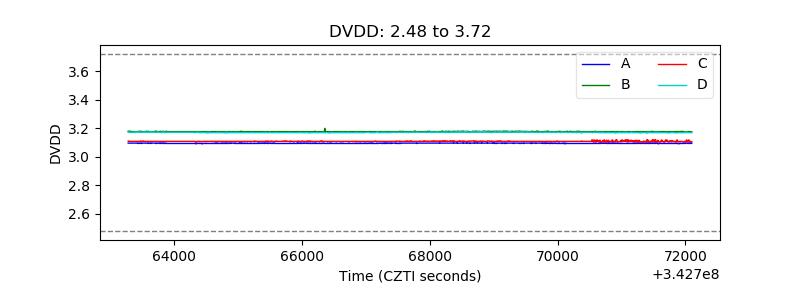 |
| Temperature 1 | 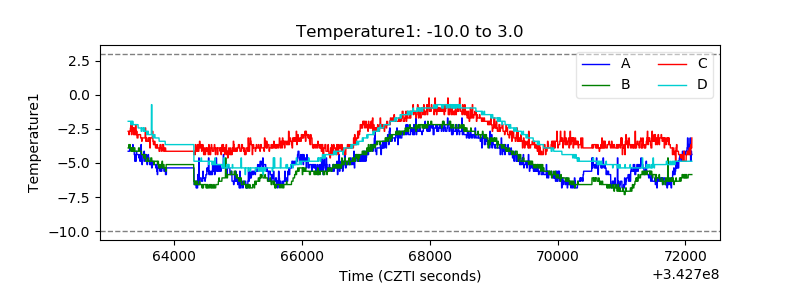 |
| Veto HV Monitor | 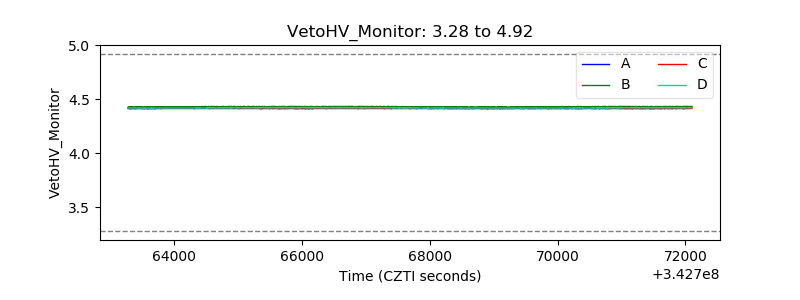 |
| Veto LLD | 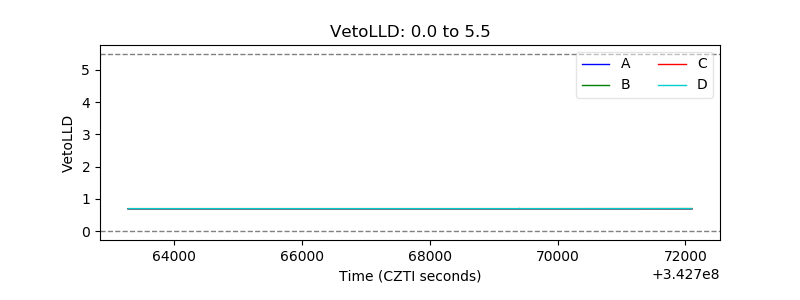 |
| Alpha Counter | 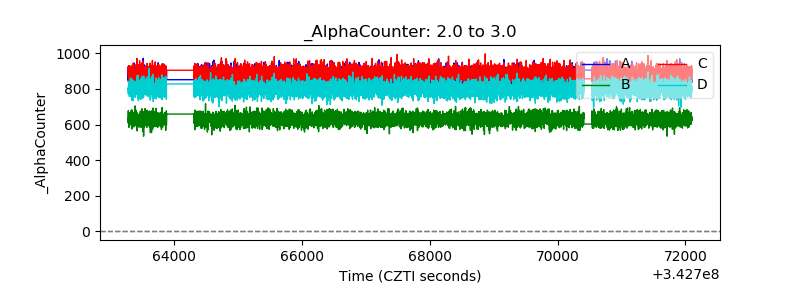 |
| _CPM_Rate | 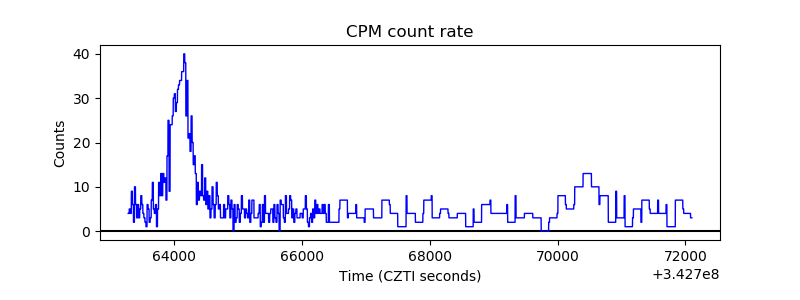 |
| CZT Counter |  |
| +2.5 Volts monitor |  |
| +5 Volts monitor | 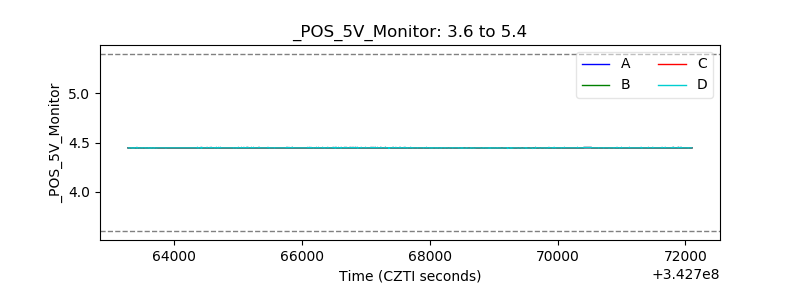 |
| _ROLL_ROT | 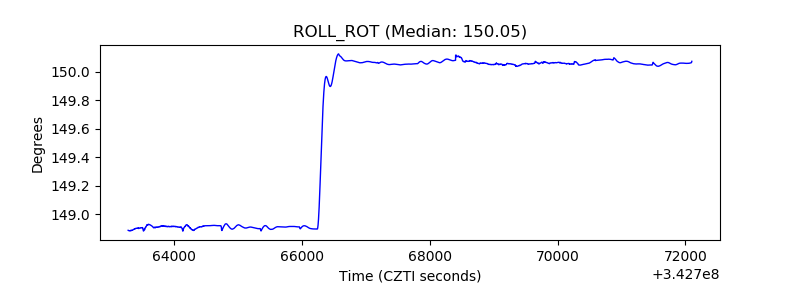 |
| _Roll_DEC | 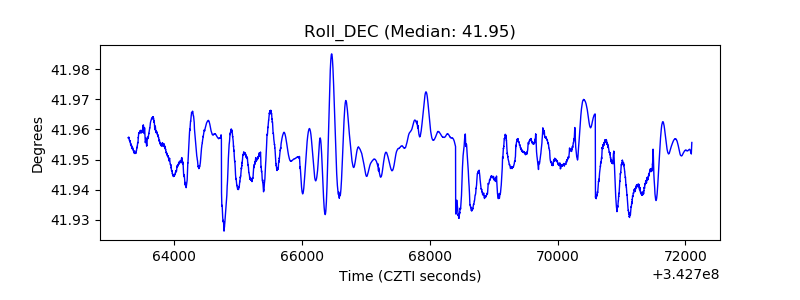 |
| _Roll_RA | 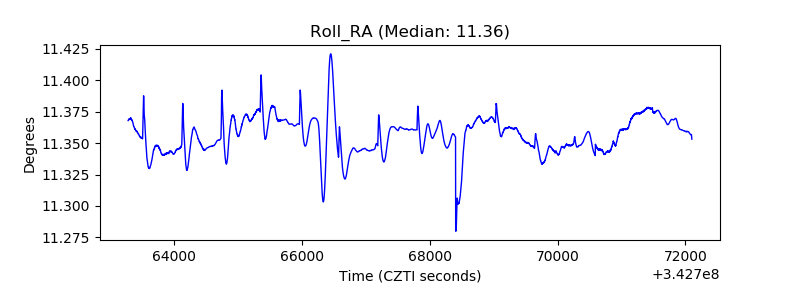 |
| Veto Counter |  |