| Param | Original file | Final file |
|---|---|---|
| Filename | modeM0/AS1T03_262T01_9000003988_27696cztM0_level2.evt | modeM0/AS1T03_262T01_9000003988_27696cztM0_level2_quad_clean.evt |
| Size (bytes) | 674,988,480 | 100,373,760 |
| Size | 643.7 MB | 95.7 MB |
| Events in quadrant A | 4,130,580 | 638,354 |
| Events in quadrant B | 4,867,019 | 637,363 |
| Events in quadrant C | 4,302,245 | 624,187 |
| Events in quadrant D | 6,555,433 | 538,094 |
| Mode M0 | |||
|---|---|---|---|
| Quadrant | BADHDUFLAG | Total packets | Discarded packets |
| A | 0 | 17923 | 0 |
| B | 0 | 19951 | 0 |
| C | 0 | 18214 | 0 |
| D | 0 | 25425 | 0 |
| Mode M9 | |||
|---|---|---|---|
| Quadrant | BADHDUFLAG | Total packets | Discarded packets |
| A | 0 | 4 | 0 |
| B | 0 | 4 | 0 |
| C | 0 | 4 | 0 |
| D | 0 | 4 | 0 |
| Quadrant | Total seconds | Saturated seconds | Saturation percentage |
|---|---|---|---|
| A | 8649 | 241 | 2.786449% |
| B | 8650 | 467 | 5.398844% |
| C | 8650 | 283 | 3.271676% |
| D | 8650 | 996 | 11.514451% |
Noise dominated data is calculated using 1-second bins in cleaned event files. If a bin has >2000 counts, and if more than 50% of those come from <1% of pixels, then it is considered to be noise-dominated and hence unusable.
| Quadrant | # 1 sec bins | Bins with >0 counts | Bins with >2000 counts | High rate bins dominated by noise | Noise dominated (total time) | Noise dominated (detector-on time) | Marked lightcurve |
|---|---|---|---|---|---|---|---|
| A | 9064 | 8649 | 0 | 0 | 0.00% | 0.00% | 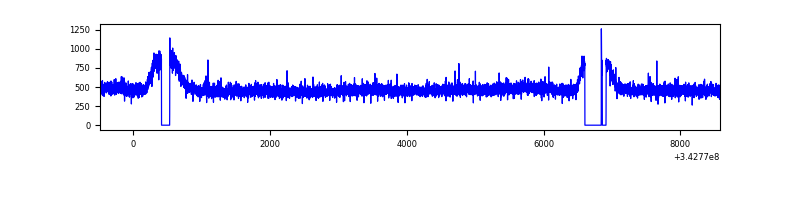 |
| B | 9065 | 8650 | 130 | 130 | 1.43% | 1.50% | 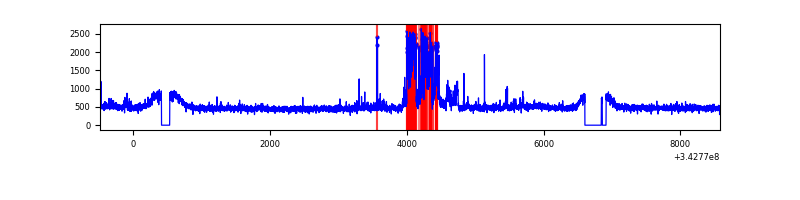 |
| C | 9065 | 8650 | 0 | 0 | 0.00% | 0.00% | 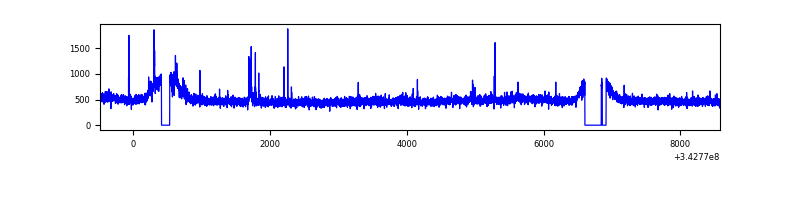 |
| D | 9065 | 8651 | 694 | 694 | 7.66% | 8.02% | 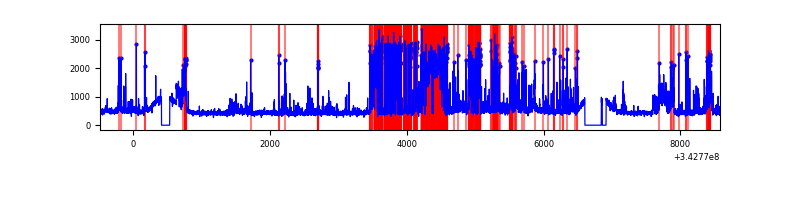 |
Top three noisy pixels from each quadrant. If the there are fewer than three noisy pixels in the level2.evt file, extra rows are filled as -1
| Pixel properties | Quadrant properties | ||||||
|---|---|---|---|---|---|---|---|
| Quadrant | DetID | PixID | Counts | Sigma | Mean | Median | Sigma |
| A | 13 | 254 | 13146 | 55.8 | 1068 | 1040 | 216.9 |
| A | 3 | 137 | 10949 | 45.68 | 1068 | 1040 | 216.9 |
| A | 0 | 226 | 8889 | 36.18 | 1068 | 1040 | 216.9 |
| B | 15 | 32 | 620509 | 3003.61 | 1060 | 1029 | 206.2 |
| B | 0 | 230 | 52433 | 249.24 | 1060 | 1029 | 206.2 |
| B | 12 | 111 | 26302 | 122.54 | 1060 | 1029 | 206.2 |
| C | 14 | 238 | 161687 | 661.22 | 1032 | 1037 | 243.0 |
| C | 2 | 16 | 59137 | 239.14 | 1032 | 1037 | 243.0 |
| C | 3 | 233 | 37149 | 148.63 | 1032 | 1037 | 243.0 |
| D | 1 | 52 | 2390614 | 10188.84 | 974 | 943 | 234.5 |
| D | 6 | 112 | 329748 | 1401.92 | 974 | 943 | 234.5 |
| D | 2 | 250 | 92734 | 391.37 | 974 | 943 | 234.5 |
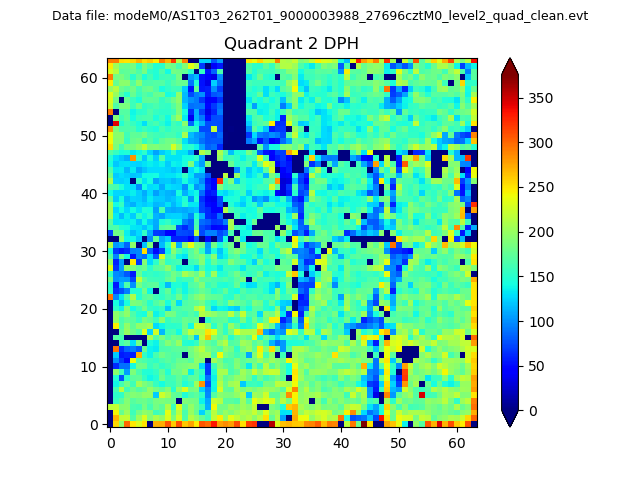
Histogram calculated using DETX and DETY for each event in the final _common_clean file
| Quadrant A | 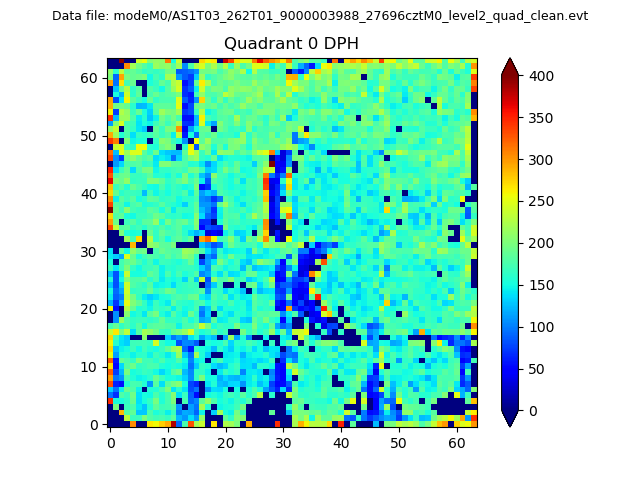 |
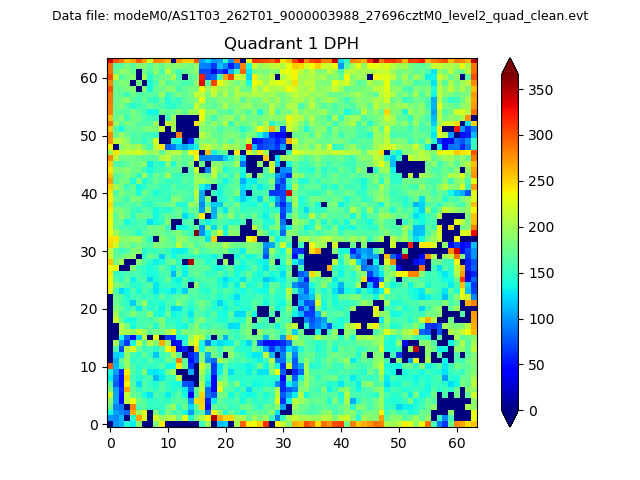 |
Quadrant B |
|---|---|---|---|
| Quadrant D | 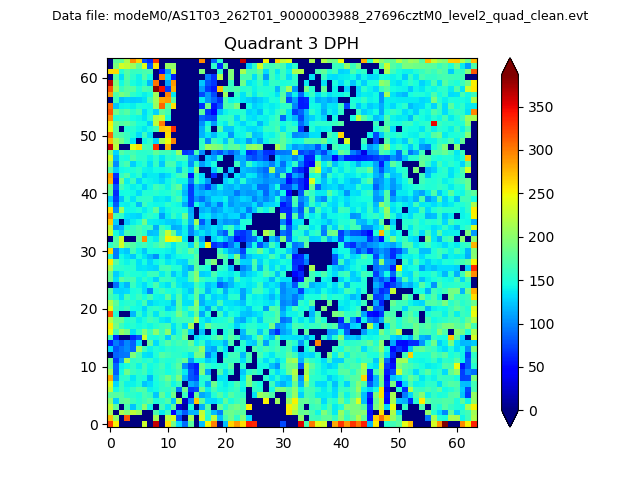 |
 |
Quadrant C |
| Plot type | Count rate plots | Images |
|---|---|---|
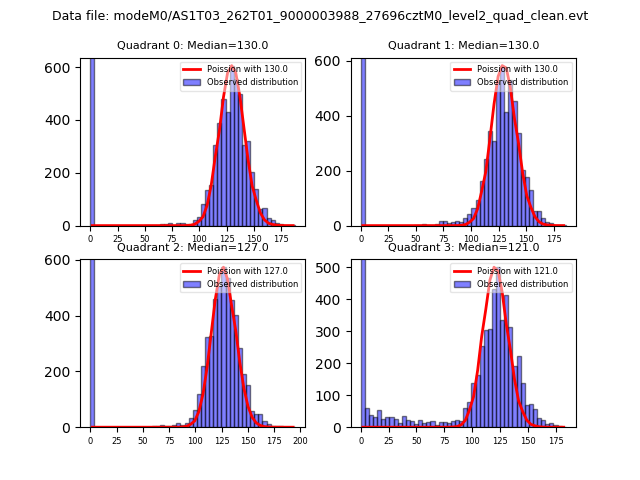
| Comparison with Poisson distribution Blue bars denote a histogram of data divided into 1 sec bins. Red curve is a Poisson curve with rate = median count rate of data. |
 |
 |
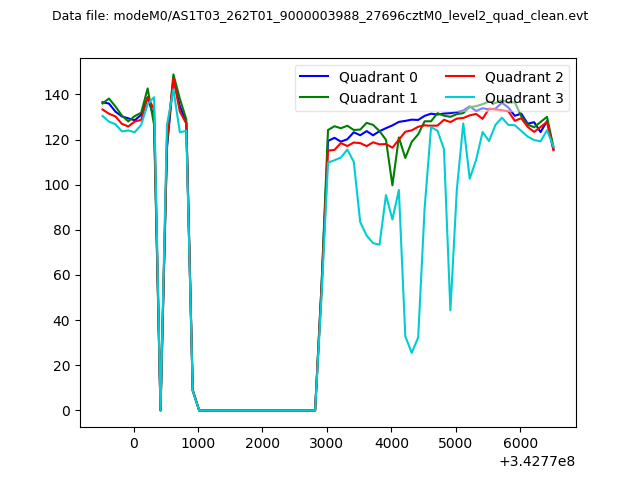
| Quadrant-wise count rates Data is divided into 100 sec bins |
 |
|
| Module-wise count rates for Quadrant A Data is divided into 100 sec bins |
 |
 |
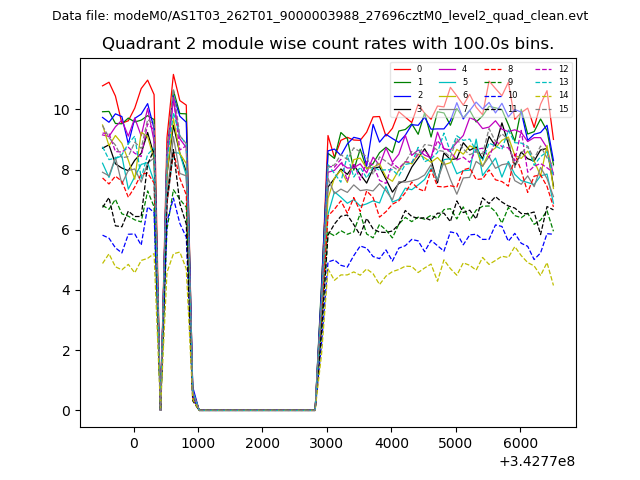
| Module-wise count rates for Quadrant B Data is divided into 100 sec bins |
 |
 |
| Module-wise count rates for Quadrant C Data is divided into 100 sec bins |
 |
 |
| Module-wise count rates for Quadrant D Data is divided into 100 sec bins |
 |
 |
| Parameter | Plot |
|---|---|
| CZT HV Monitor |  |
| D_VDD | 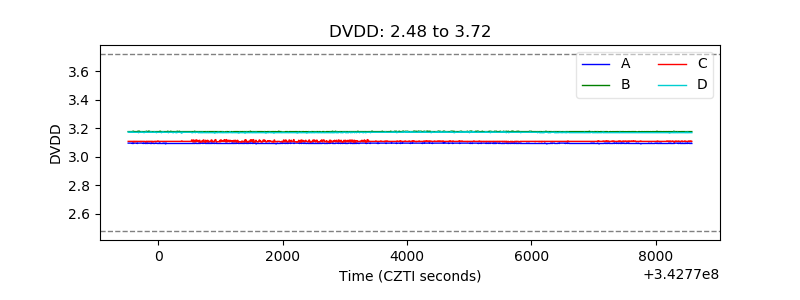 |
| Temperature 1 | 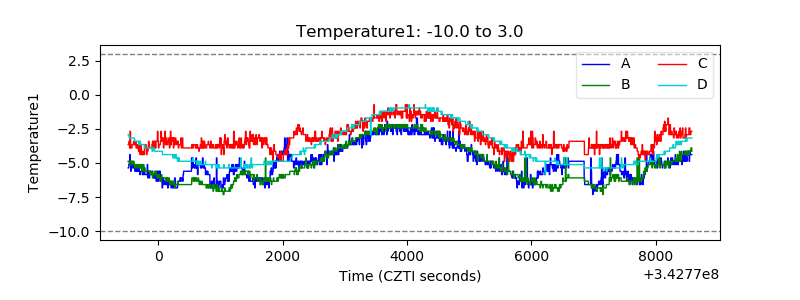 |
| Veto HV Monitor | 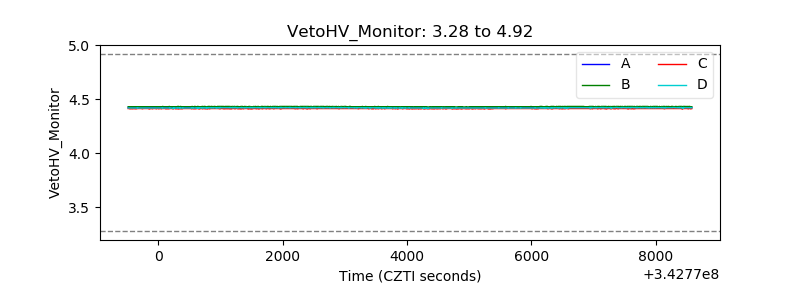 |
| Veto LLD |  |
| Alpha Counter | 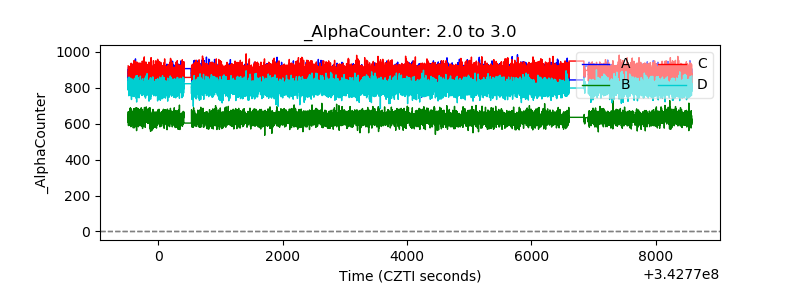 |
| _CPM_Rate | 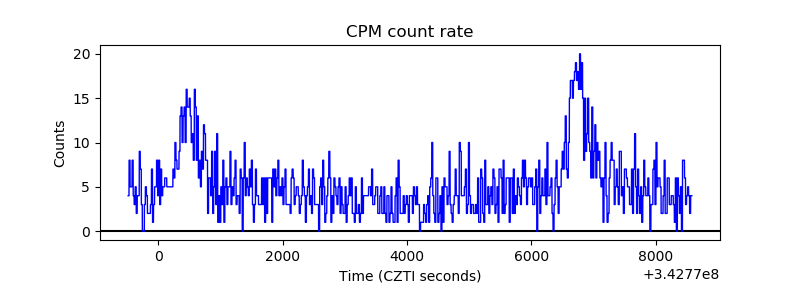 |
| CZT Counter | 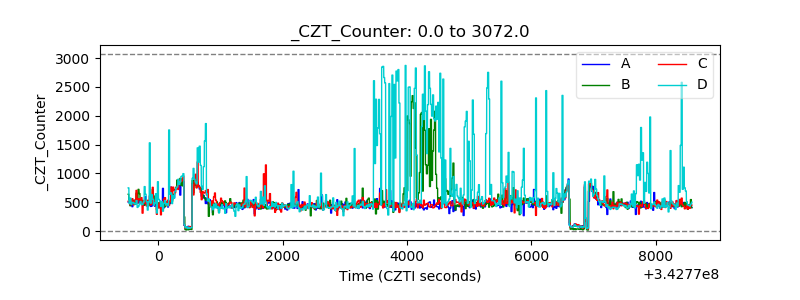 |
| +2.5 Volts monitor |  |
| +5 Volts monitor |  |
| _ROLL_ROT | 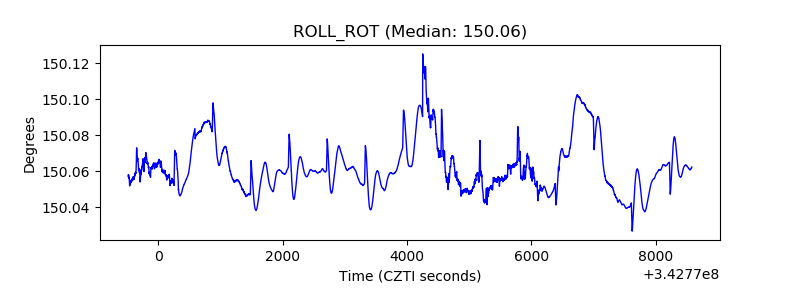 |
| _Roll_DEC | 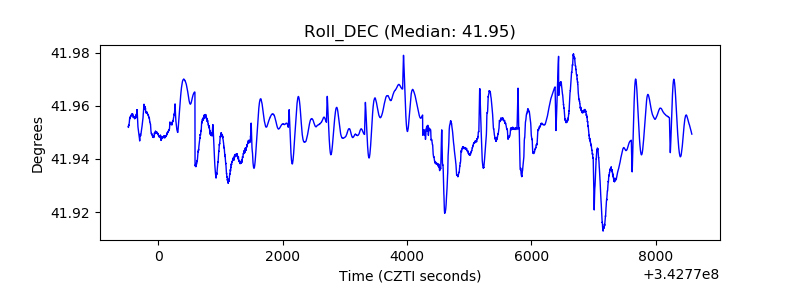 |
| _Roll_RA | 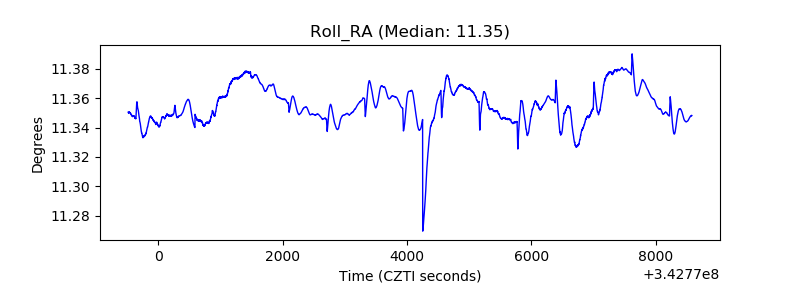 |
| Veto Counter |  |