| Param | Original file | Final file |
|---|---|---|
| Filename | modeM0/AS1T03_262T01_9000003988_27698cztM0_level2.evt | modeM0/AS1T03_262T01_9000003988_27698cztM0_level2_quad_clean.evt |
| Size (bytes) | 334,062,720 | 59,123,520 |
| Size | 318.6 MB | 56.4 MB |
| Events in quadrant A | 2,207,457 | 370,785 |
| Events in quadrant B | 2,387,106 | 372,676 |
| Events in quadrant C | 2,285,566 | 358,509 |
| Events in quadrant D | 2,906,685 | 347,998 |
| Mode M0 | |||
|---|---|---|---|
| Quadrant | BADHDUFLAG | Total packets | Discarded packets |
| A | 0 | 9819 | 0 |
| B | 0 | 10212 | 0 |
| C | 0 | 9884 | 0 |
| D | 0 | 11963 | 0 |
| Quadrant | Total seconds | Saturated seconds | Saturation percentage |
|---|---|---|---|
| A | 4848 | 37 | 0.763201% |
| B | 4849 | 50 | 1.031140% |
| C | 4849 | 56 | 1.154877% |
| D | 4848 | 112 | 2.310231% |
Noise dominated data is calculated using 1-second bins in cleaned event files. If a bin has >2000 counts, and if more than 50% of those come from <1% of pixels, then it is considered to be noise-dominated and hence unusable.
| Quadrant | # 1 sec bins | Bins with >0 counts | Bins with >2000 counts | High rate bins dominated by noise | Noise dominated (total time) | Noise dominated (detector-on time) | Marked lightcurve |
|---|---|---|---|---|---|---|---|
| A | 4848 | 4848 | 0 | 0 | 0.00% | 0.00% | 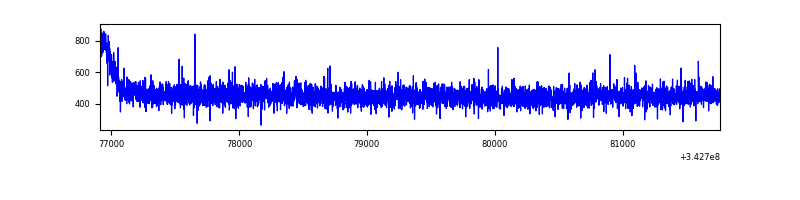 |
| B | 4849 | 4849 | 1 | 1 | 0.02% | 0.02% | 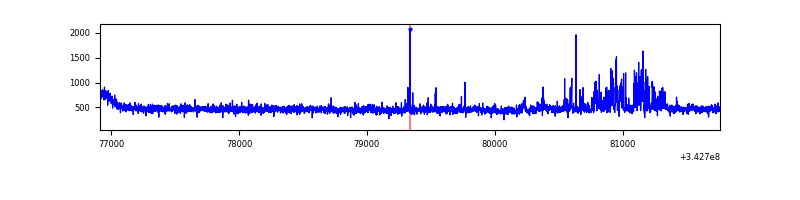 |
| C | 4849 | 4849 | 0 | 0 | 0.00% | 0.00% | 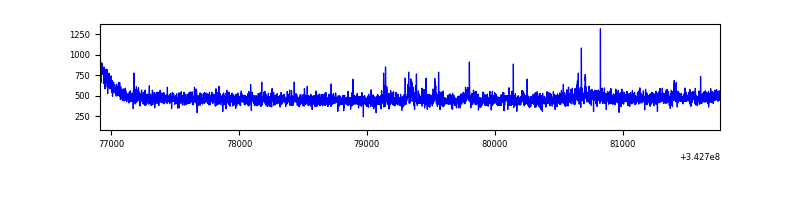 |
| D | 4848 | 4848 | 76 | 76 | 1.57% | 1.57% | 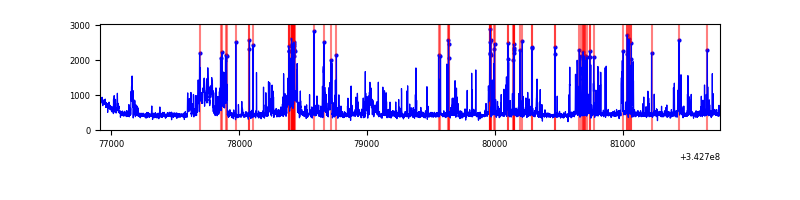 |
Top three noisy pixels from each quadrant. If the there are fewer than three noisy pixels in the level2.evt file, extra rows are filled as -1
| Pixel properties | Quadrant properties | ||||||
|---|---|---|---|---|---|---|---|
| Quadrant | DetID | PixID | Counts | Sigma | Mean | Median | Sigma |
| A | 13 | 254 | 7292 | 58.32 | 571 | 559 | 115.5 |
| A | 3 | 137 | 5656 | 44.15 | 571 | 559 | 115.5 |
| A | 0 | 226 | 4929 | 37.85 | 571 | 559 | 115.5 |
| B | 0 | 230 | 113750 | 1027.08 | 567 | 551 | 110.2 |
| B | 0 | 190 | 25838 | 229.44 | 567 | 551 | 110.2 |
| B | 12 | 111 | 13945 | 121.53 | 567 | 551 | 110.2 |
| C | 14 | 238 | 88445 | 673.13 | 550 | 552 | 130.6 |
| C | 3 | 233 | 50536 | 382.8 | 550 | 552 | 130.6 |
| C | 13 | 61 | 3818 | 25.01 | 550 | 552 | 130.6 |
| D | 1 | 52 | 553167 | 4162.9 | 550 | 534 | 132.8 |
| D | 6 | 112 | 171046 | 1284.44 | 550 | 534 | 132.8 |
| D | 2 | 250 | 60200 | 449.45 | 550 | 534 | 132.8 |
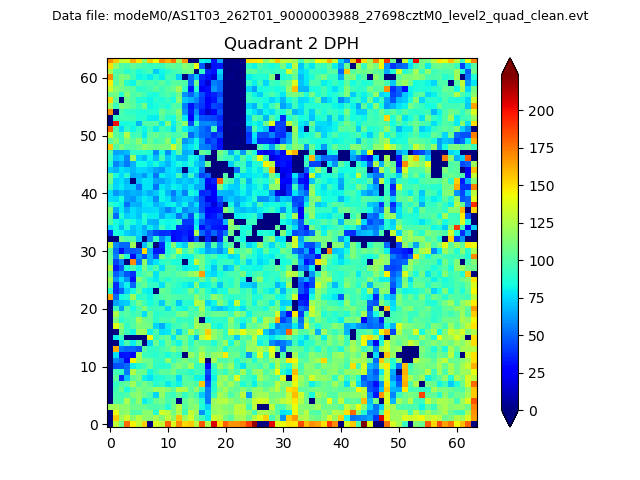
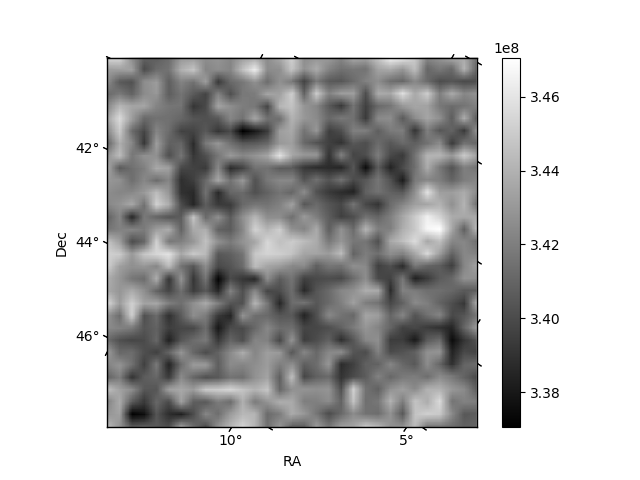
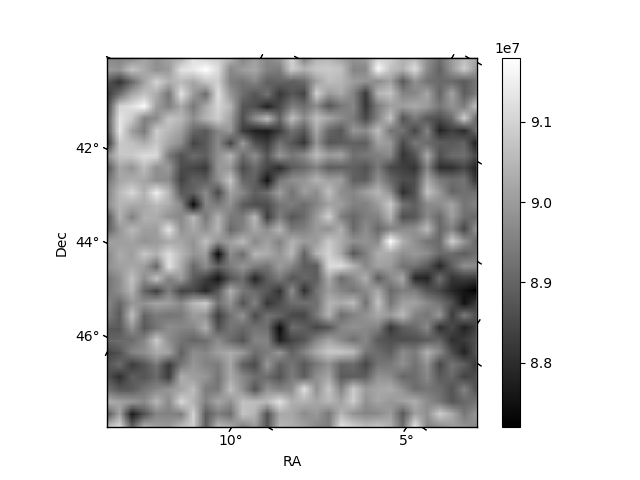
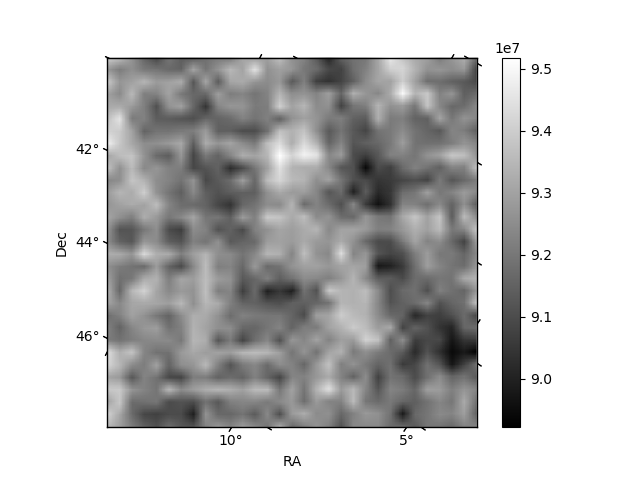
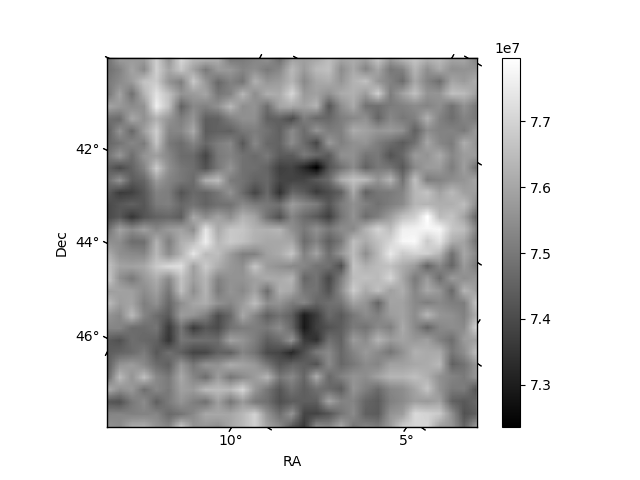
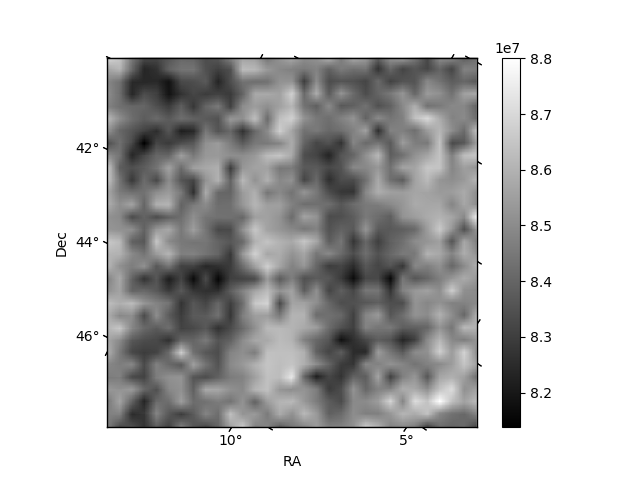
Histogram calculated using DETX and DETY for each event in the final _common_clean file
| Quadrant A | 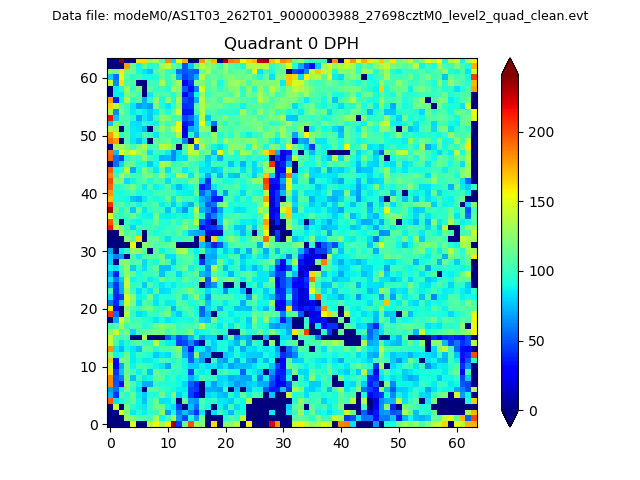 |
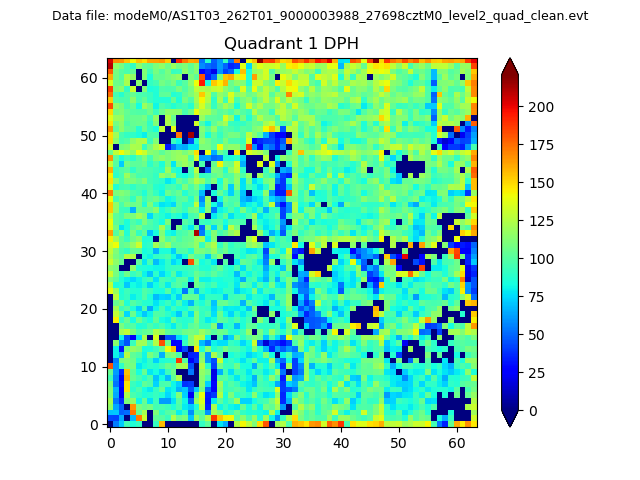 |
Quadrant B |
|---|---|---|---|
| Quadrant D | 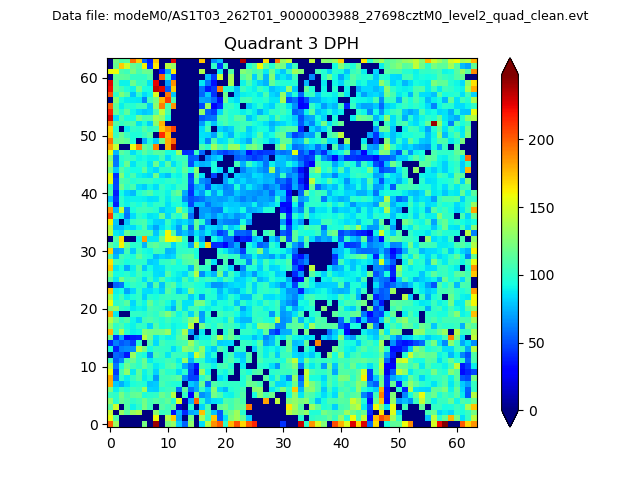 |
 |
Quadrant C |
| Plot type | Count rate plots | Images |
|---|---|---|
| Comparison with Poisson distribution Blue bars denote a histogram of data divided into 1 sec bins. Red curve is a Poisson curve with rate = median count rate of data. |
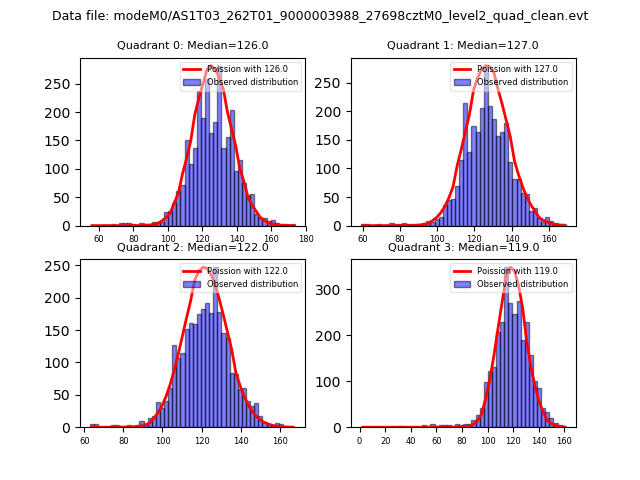 |
 |
| Quadrant-wise count rates Data is divided into 100 sec bins |
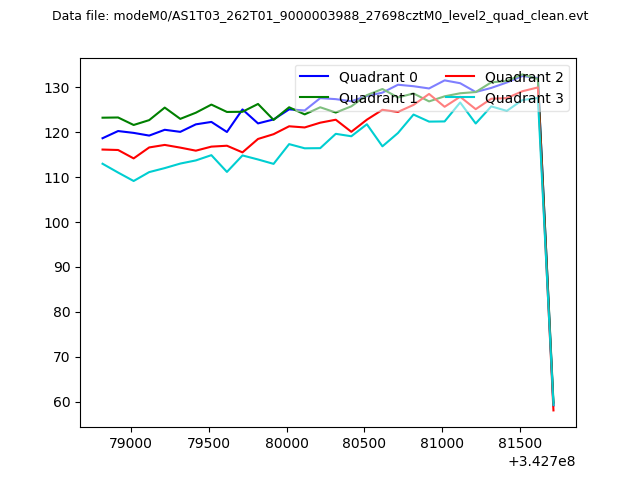 |
|
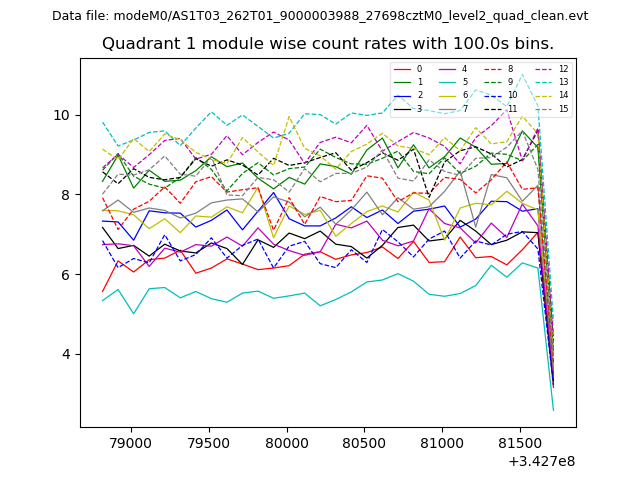
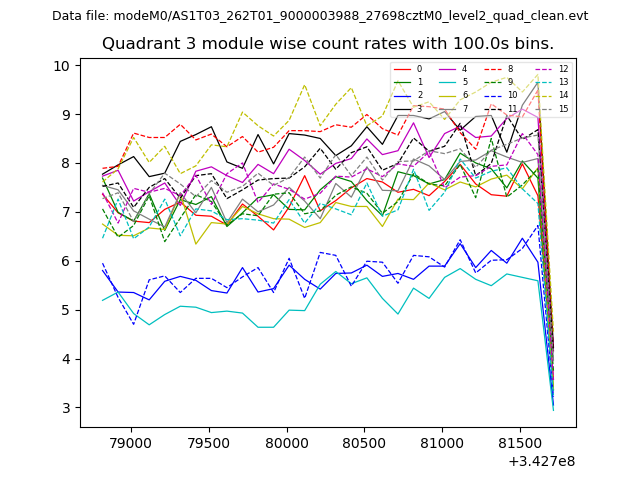
| Module-wise count rates for Quadrant A Data is divided into 100 sec bins |
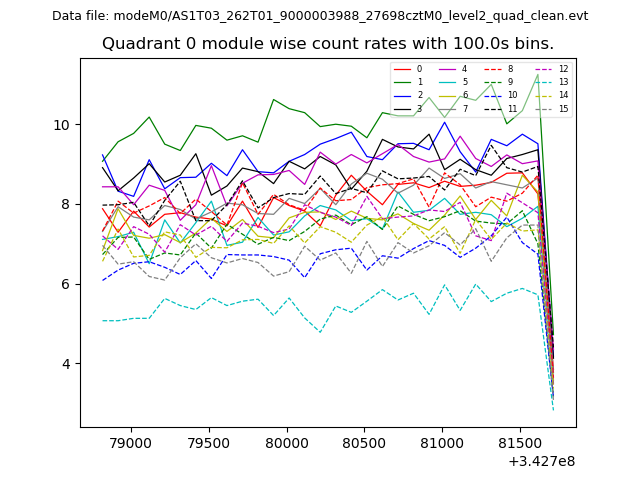 |
 |
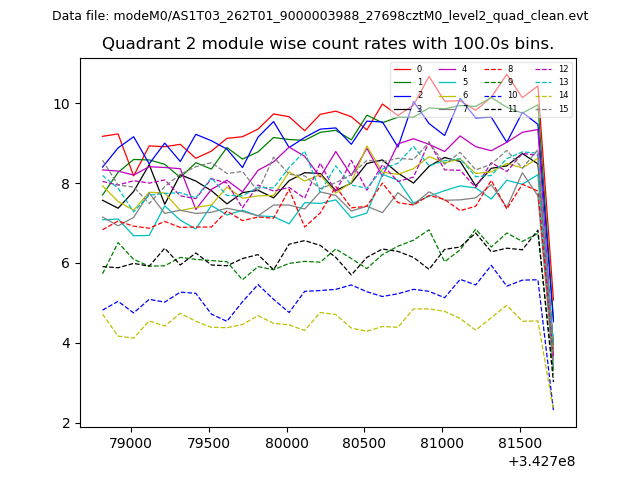
| Module-wise count rates for Quadrant B Data is divided into 100 sec bins |
 |
 |
| Module-wise count rates for Quadrant C Data is divided into 100 sec bins |
 |
 |
| Module-wise count rates for Quadrant D Data is divided into 100 sec bins |
 |
 |
| Parameter | Plot |
|---|---|
| CZT HV Monitor | 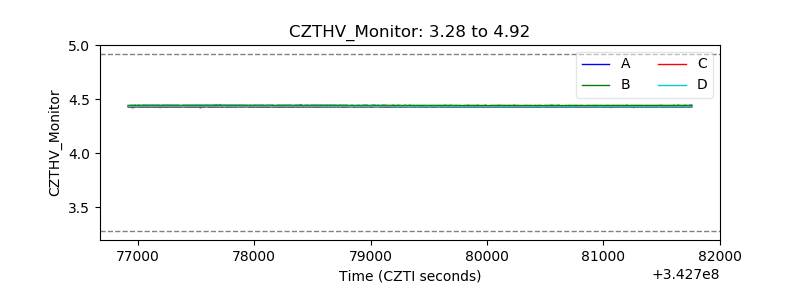 |
| D_VDD | 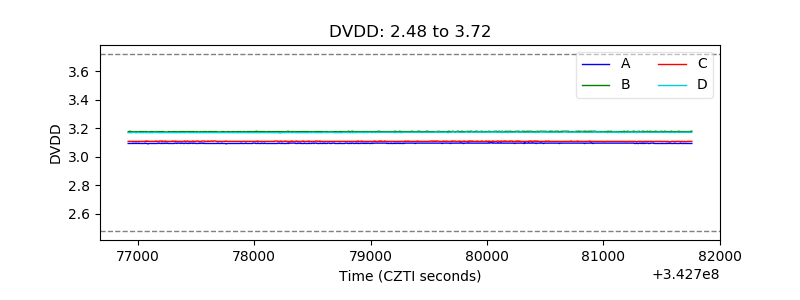 |
| Temperature 1 | 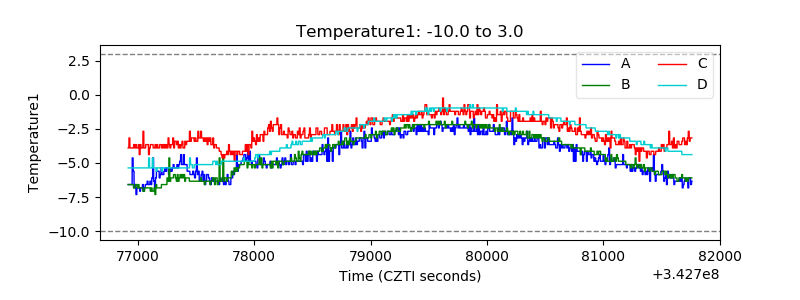 |
| Veto HV Monitor | 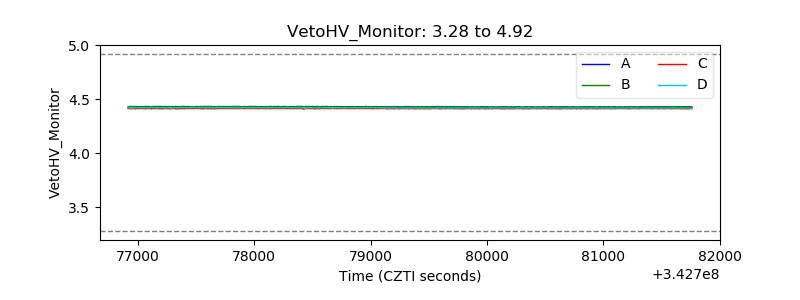 |
| Veto LLD | 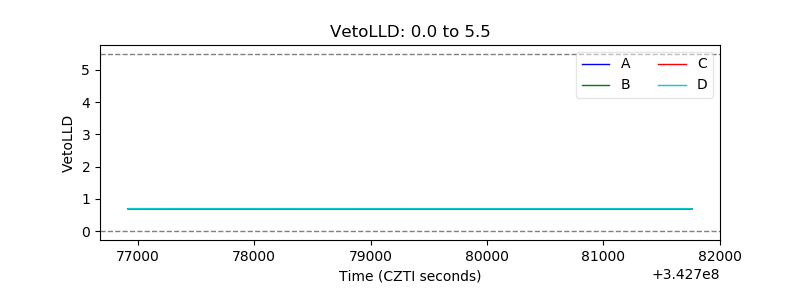 |
| Alpha Counter | 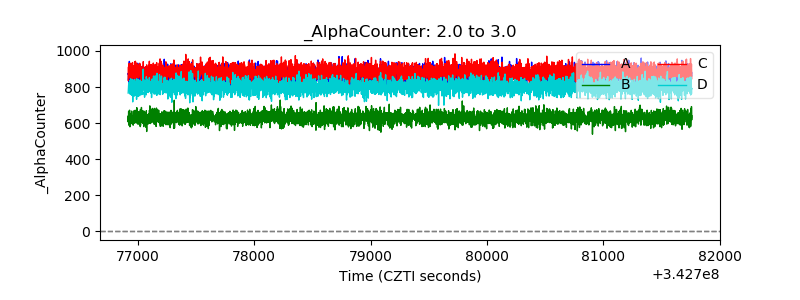 |
| _CPM_Rate | 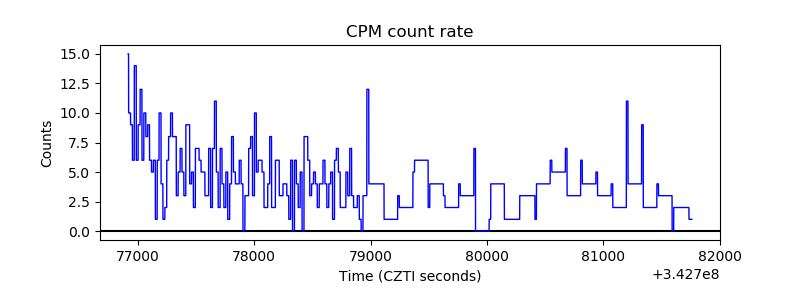 |
| CZT Counter | 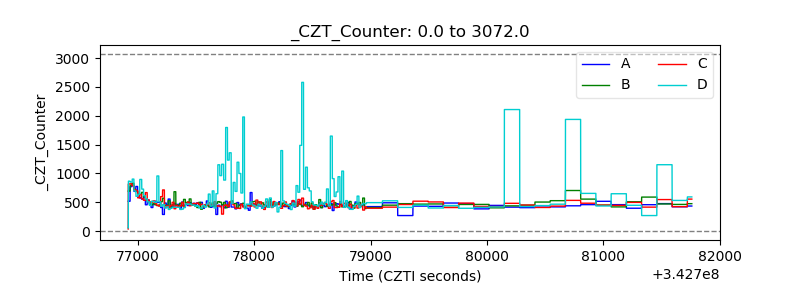 |
| +2.5 Volts monitor |  |
| +5 Volts monitor | 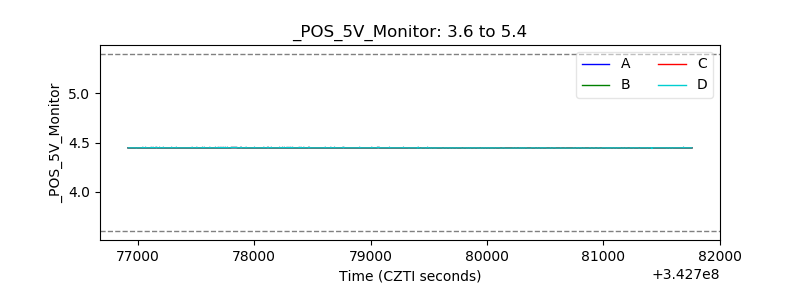 |
| _ROLL_ROT | 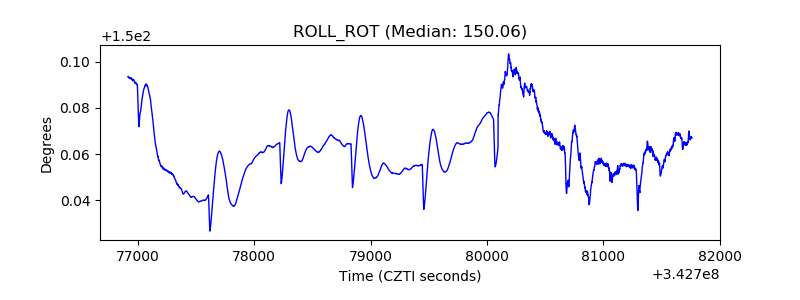 |
| _Roll_DEC | 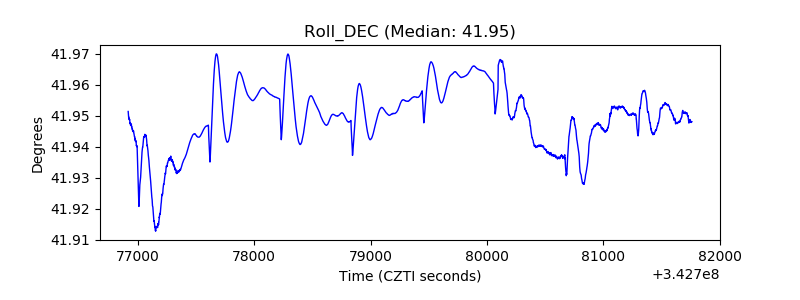 |
| _Roll_RA | 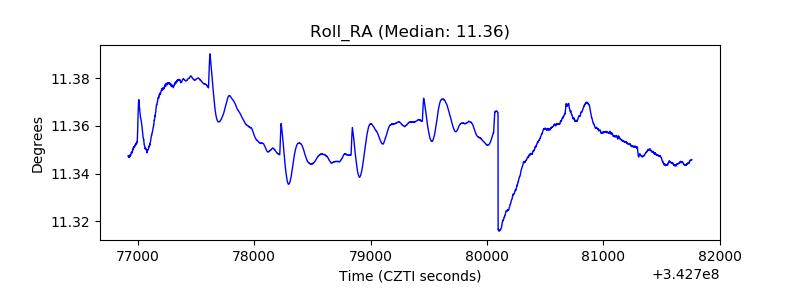 |
| Veto Counter | 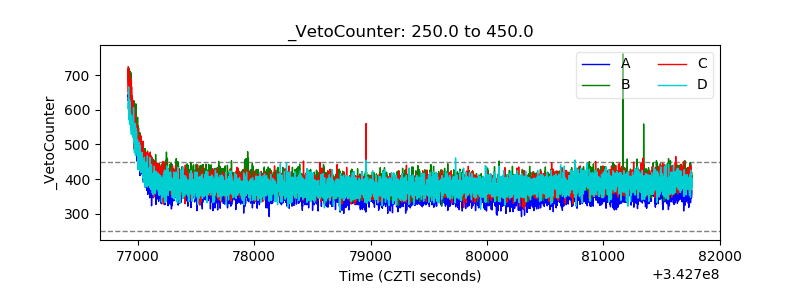 |