| Param | Original file | Final file |
|---|---|---|
| Filename | modeM0/AS1T03_262T01_9000003988_27699cztM0_level2.evt | modeM0/AS1T03_262T01_9000003988_27699cztM0_level2_quad_clean.evt |
| Size (bytes) | 985,276,800 | 189,840,960 |
| Size | 939.6 MB | 181.0 MB |
| Events in quadrant A | 6,525,850 | 1,222,746 |
| Events in quadrant B | 7,544,288 | 1,223,220 |
| Events in quadrant C | 6,798,670 | 1,187,604 |
| Events in quadrant D | 8,027,950 | 1,154,358 |
| Mode M0 | |||
|---|---|---|---|
| Quadrant | BADHDUFLAG | Total packets | Discarded packets |
| A | 0 | 28448 | 0 |
| B | 0 | 31158 | 0 |
| C | 0 | 28739 | 0 |
| D | 0 | 33030 | 0 |
| Mode M9 | |||
|---|---|---|---|
| Quadrant | BADHDUFLAG | Total packets | Discarded packets |
| A | 0 | 19 | 0 |
| B | 0 | 19 | 0 |
| C | 0 | 19 | 0 |
| D | 0 | 19 | 0 |
| Quadrant | Total seconds | Saturated seconds | Saturation percentage |
|---|---|---|---|
| A | 13931 | 213 | 1.528964% |
| B | 13932 | 370 | 2.655757% |
| C | 13932 | 255 | 1.830319% |
| D | 13932 | 402 | 2.885444% |
Noise dominated data is calculated using 1-second bins in cleaned event files. If a bin has >2000 counts, and if more than 50% of those come from <1% of pixels, then it is considered to be noise-dominated and hence unusable.
| Quadrant | # 1 sec bins | Bins with >0 counts | Bins with >2000 counts | High rate bins dominated by noise | Noise dominated (total time) | Noise dominated (detector-on time) | Marked lightcurve |
|---|---|---|---|---|---|---|---|
| A | 15836 | 13931 | 0 | 0 | 0.00% | 0.00% | 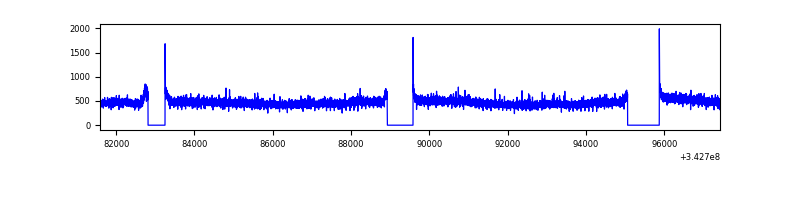 |
| B | 15837 | 13932 | 116 | 116 | 0.73% | 0.83% | 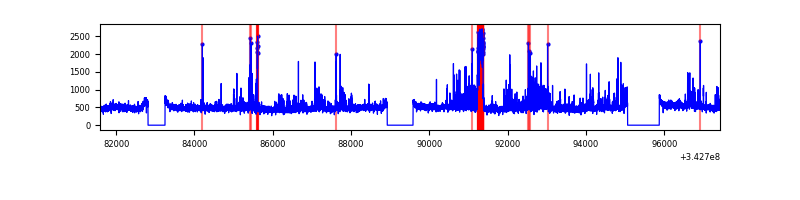 |
| C | 15837 | 13932 | 4 | 4 | 0.03% | 0.03% | 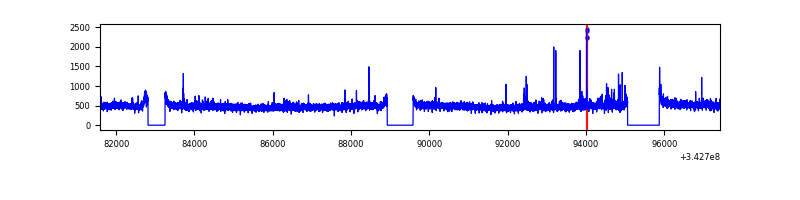 |
| D | 15837 | 13932 | 251 | 251 | 1.58% | 1.80% | 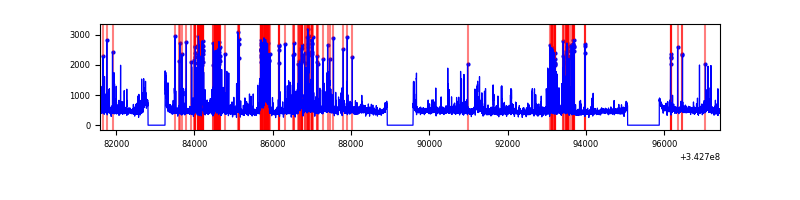 |
Top three noisy pixels from each quadrant. If the there are fewer than three noisy pixels in the level2.evt file, extra rows are filled as -1
| Pixel properties | Quadrant properties | ||||||
|---|---|---|---|---|---|---|---|
| Quadrant | DetID | PixID | Counts | Sigma | Mean | Median | Sigma |
| A | 13 | 254 | 21377 | 57.77 | 1687 | 1650 | 341.5 |
| A | 8 | 192 | 17341 | 45.95 | 1687 | 1650 | 341.5 |
| A | 3 | 137 | 16817 | 44.42 | 1687 | 1650 | 341.5 |
| B | 3 | 64 | 400293 | 1241.26 | 1671 | 1624 | 321.2 |
| B | 15 | 32 | 276960 | 857.26 | 1671 | 1624 | 321.2 |
| B | 0 | 230 | 220375 | 681.08 | 1671 | 1624 | 321.2 |
| C | 14 | 238 | 257866 | 673.19 | 1625 | 1632 | 380.6 |
| C | 3 | 233 | 158884 | 413.14 | 1625 | 1632 | 380.6 |
| C | 8 | 208 | 37689 | 94.73 | 1625 | 1632 | 380.6 |
| D | 1 | 52 | 1218008 | 3134.35 | 1626 | 1581 | 388.1 |
| D | 6 | 112 | 223118 | 570.83 | 1626 | 1581 | 388.1 |
| D | 11 | 176 | 185216 | 473.17 | 1626 | 1581 | 388.1 |
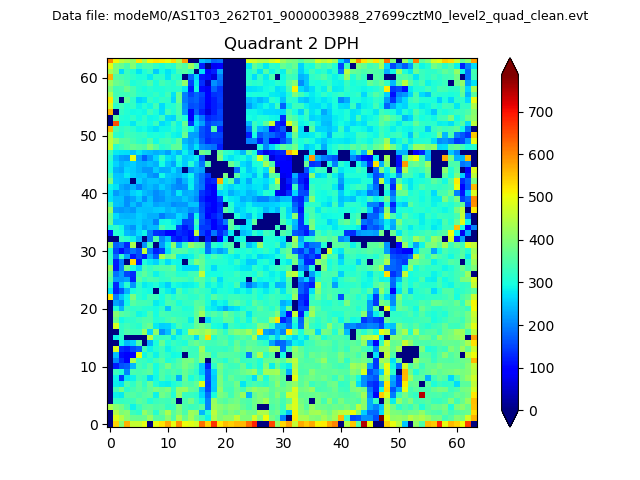
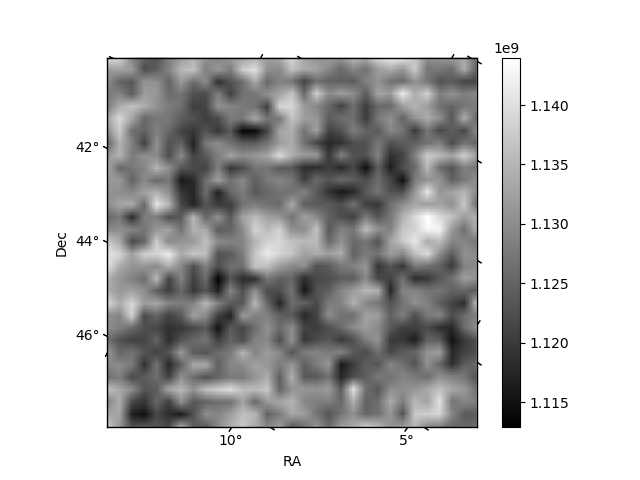
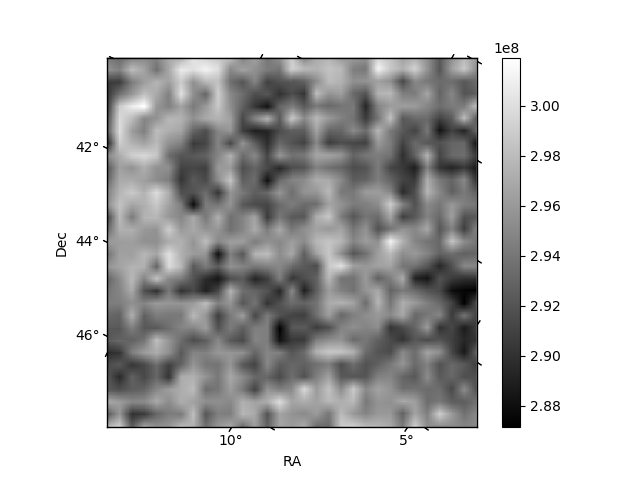
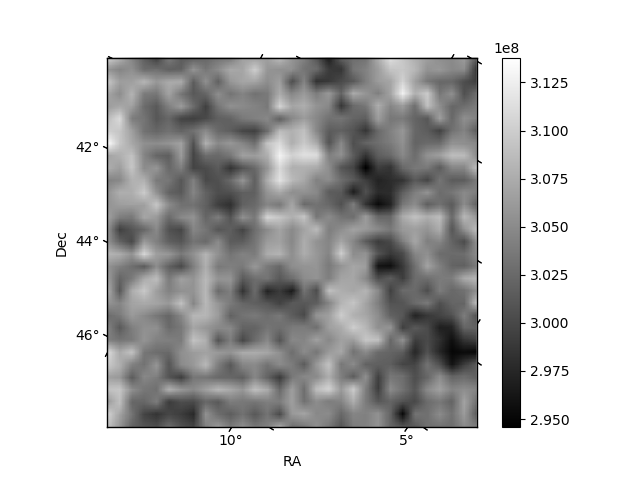
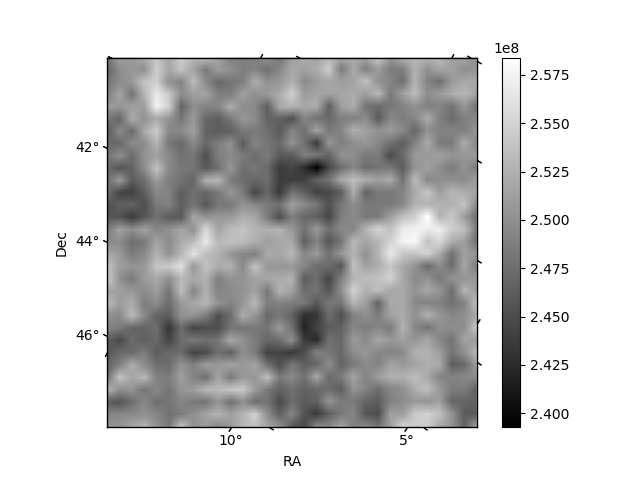
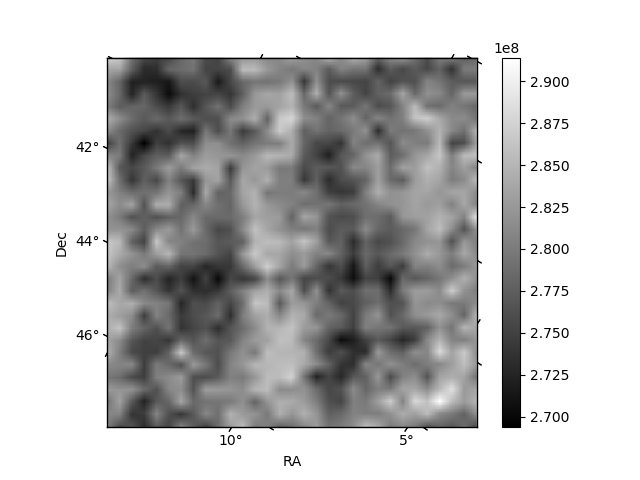
Histogram calculated using DETX and DETY for each event in the final _common_clean file
| Quadrant A | 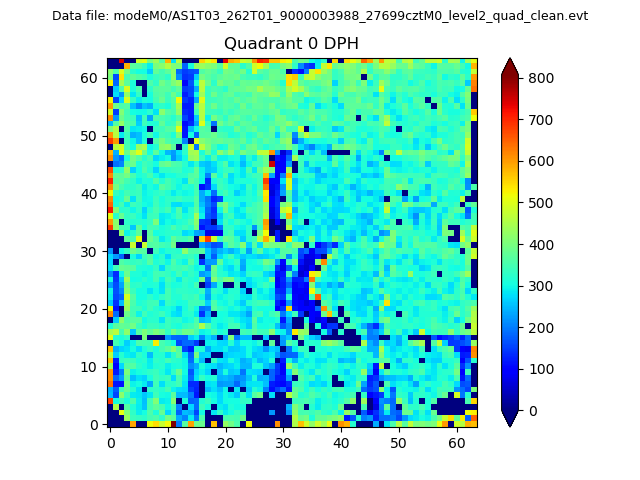 |
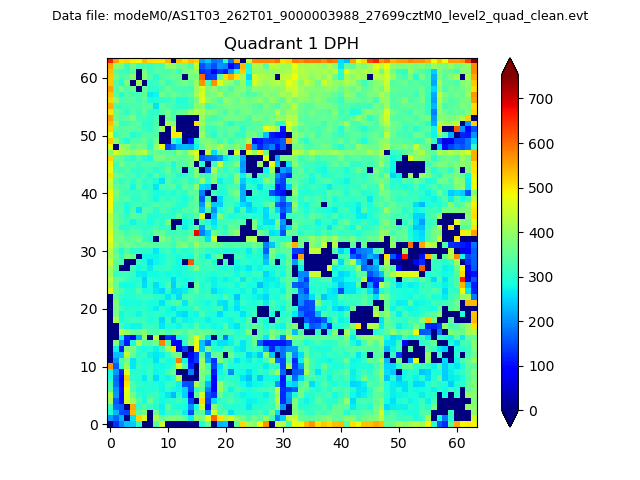 |
Quadrant B |
|---|---|---|---|
| Quadrant D | 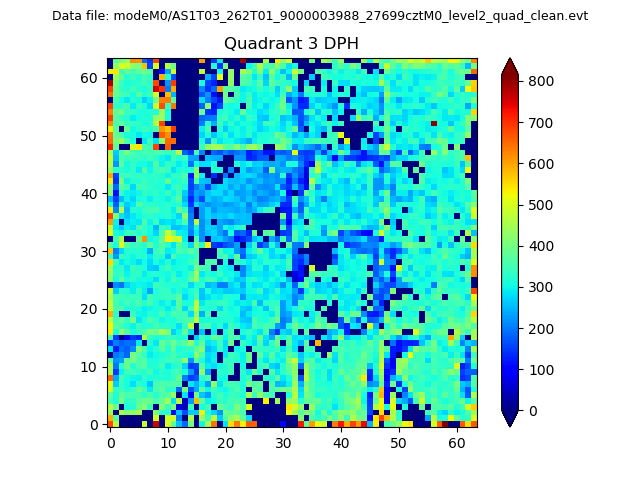 |
 |
Quadrant C |
| Plot type | Count rate plots | Images |
|---|---|---|
| Comparison with Poisson distribution Blue bars denote a histogram of data divided into 1 sec bins. Red curve is a Poisson curve with rate = median count rate of data. |
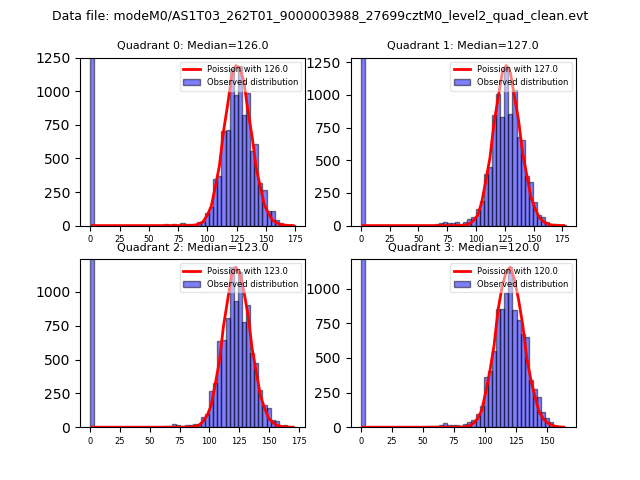 |
 |
| Quadrant-wise count rates Data is divided into 100 sec bins |
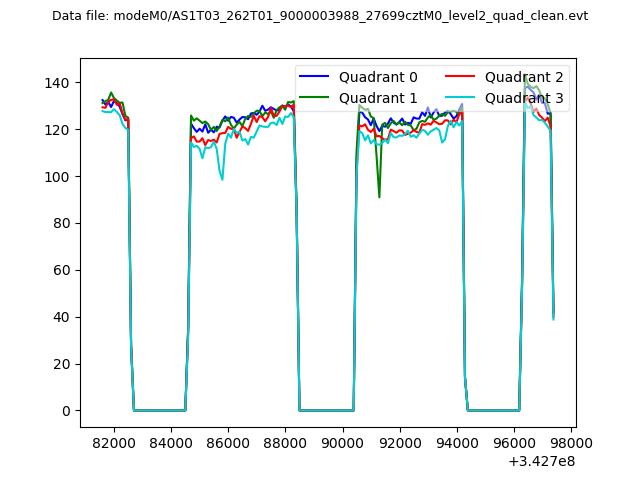 |
|
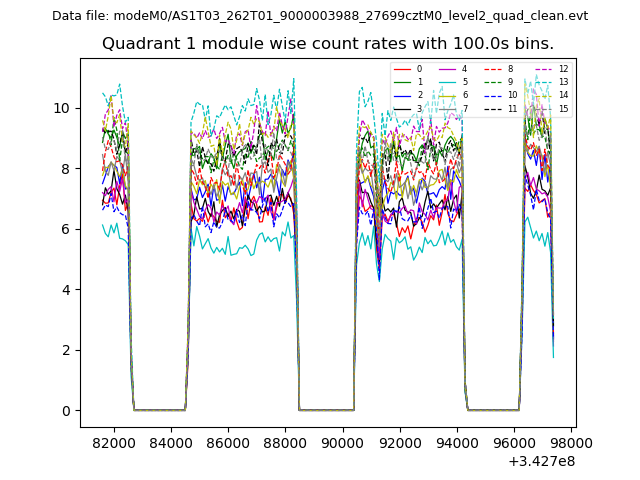
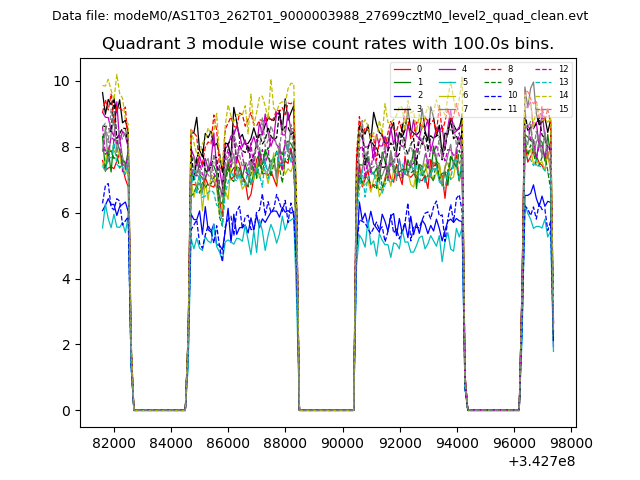
| Module-wise count rates for Quadrant A Data is divided into 100 sec bins |
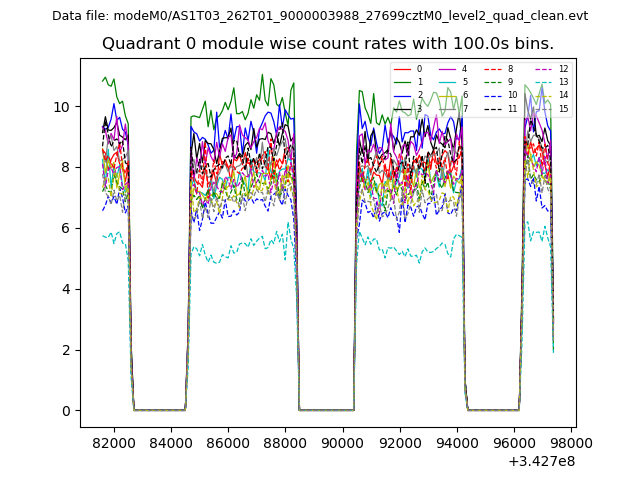 |
 |
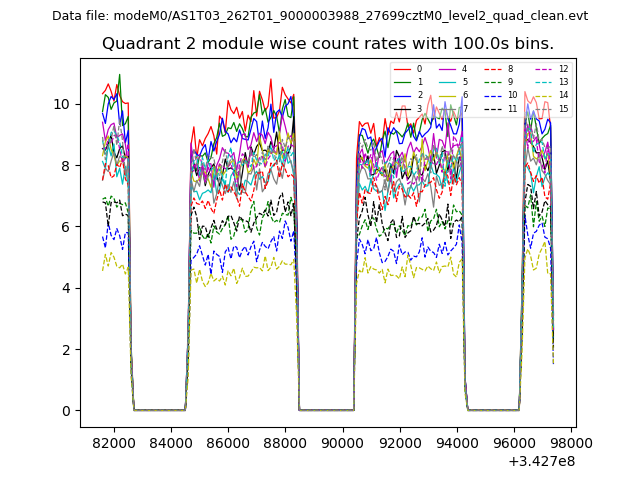
| Module-wise count rates for Quadrant B Data is divided into 100 sec bins |
 |
 |
| Module-wise count rates for Quadrant C Data is divided into 100 sec bins |
 |
 |
| Module-wise count rates for Quadrant D Data is divided into 100 sec bins |
 |
 |
| Parameter | Plot |
|---|---|
| CZT HV Monitor | 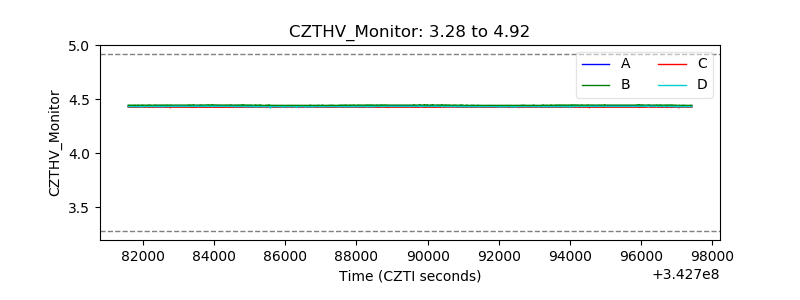 |
| D_VDD | 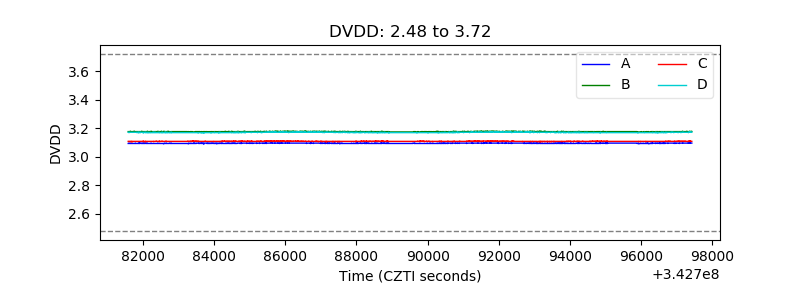 |
| Temperature 1 | 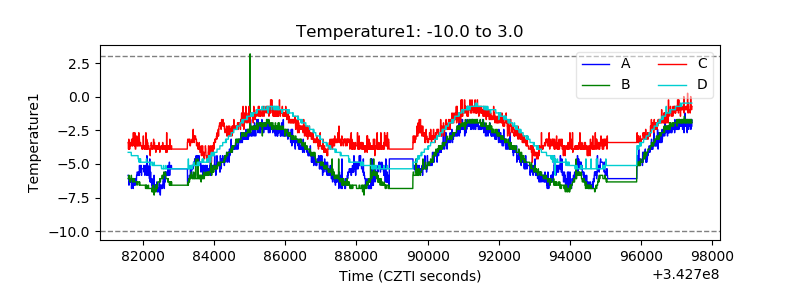 |
| Veto HV Monitor |  |
| Veto LLD | 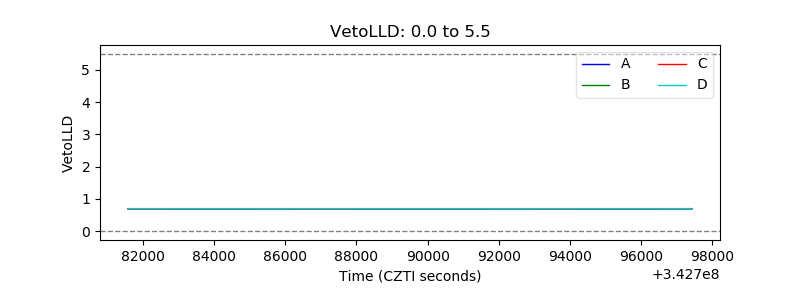 |
| Alpha Counter | 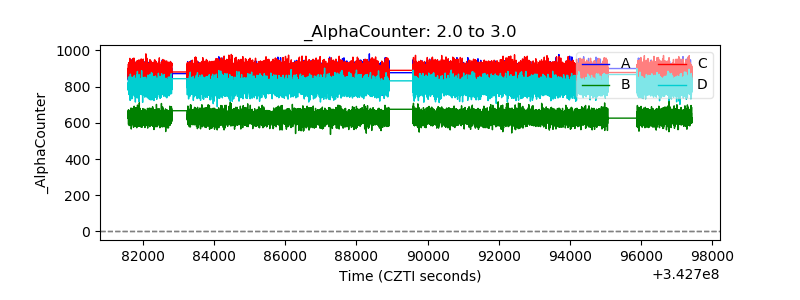 |
| _CPM_Rate | 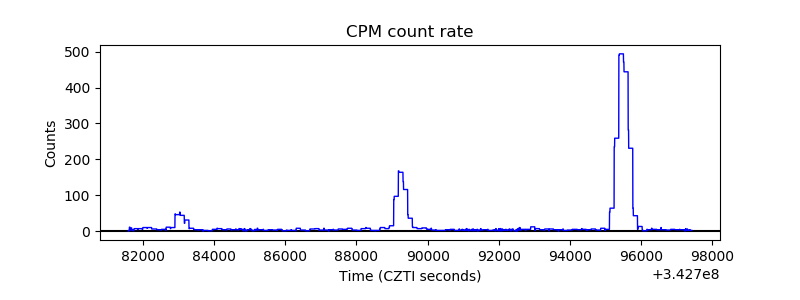 |
| CZT Counter | 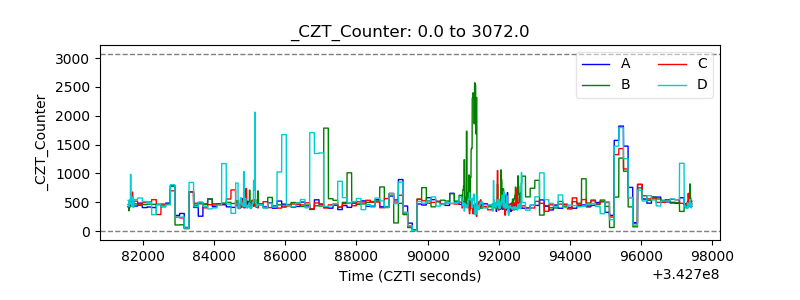 |
| +2.5 Volts monitor | 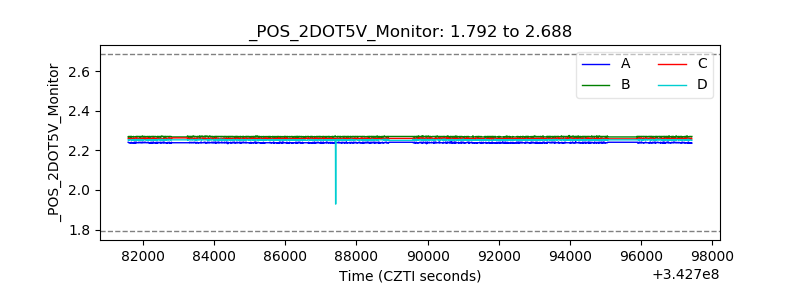 |
| +5 Volts monitor |  |
| _ROLL_ROT | 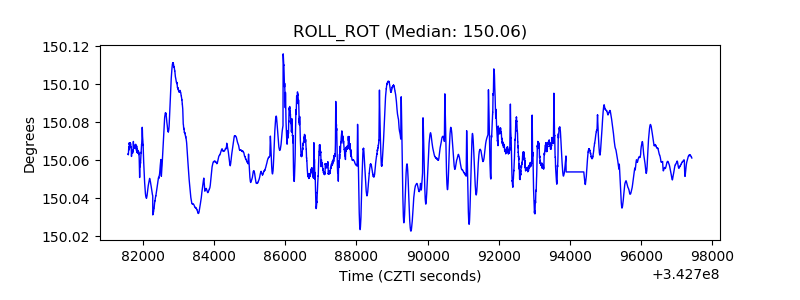 |
| _Roll_DEC | 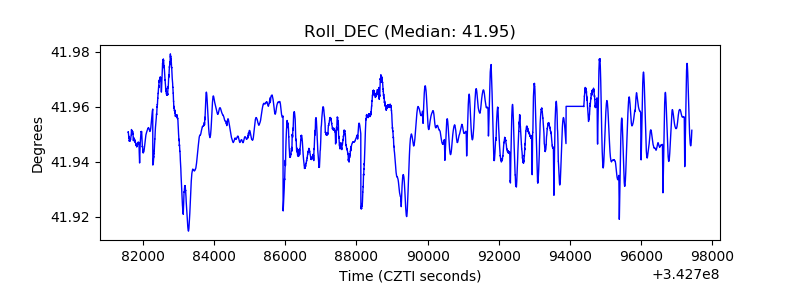 |
| _Roll_RA | 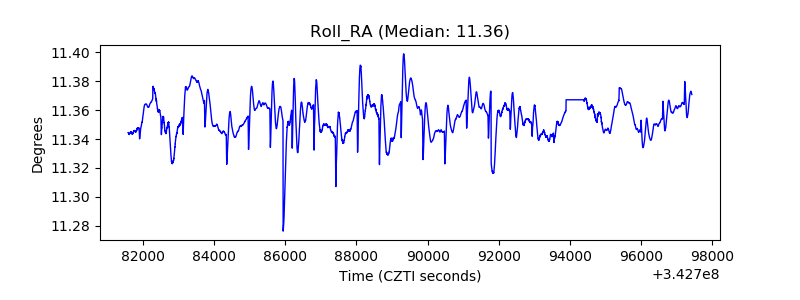 |
| Veto Counter | 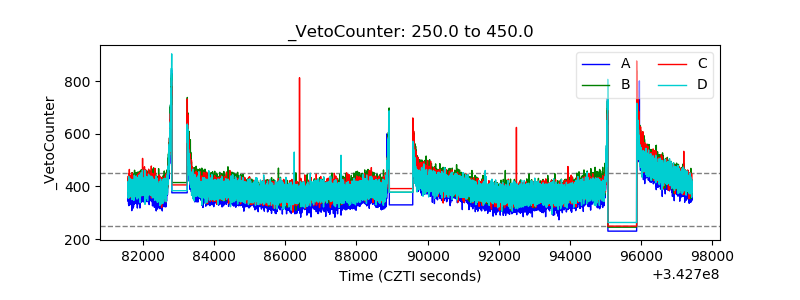 |