| Param | Original file | Final file |
|---|---|---|
| Filename | modeM0/AS1T03_262T01_9000003988_27700cztM0_level2.evt | modeM0/AS1T03_262T01_9000003988_27700cztM0_level2_quad_clean.evt |
| Size (bytes) | 427,913,280 | 103,115,520 |
| Size | 408.1 MB | 98.3 MB |
| Events in quadrant A | 2,944,035 | 689,263 |
| Events in quadrant B | 3,156,970 | 690,190 |
| Events in quadrant C | 3,158,085 | 662,604 |
| Events in quadrant D | 3,278,993 | 648,291 |
| Mode M0 | |||
|---|---|---|---|
| Quadrant | BADHDUFLAG | Total packets | Discarded packets |
| A | 0 | 12879 | 0 |
| B | 0 | 13420 | 0 |
| C | 0 | 13197 | 0 |
| D | 0 | 13906 | 0 |
| Mode M9 | |||
|---|---|---|---|
| Quadrant | BADHDUFLAG | Total packets | Discarded packets |
| A | 0 | 9 | 0 |
| B | 0 | 9 | 0 |
| C | 0 | 9 | 0 |
| D | 0 | 9 | 0 |
| Quadrant | Total seconds | Saturated seconds | Saturation percentage |
|---|---|---|---|
| A | 6188 | 49 | 0.791855% |
| B | 6189 | 55 | 0.888673% |
| C | 6189 | 79 | 1.276458% |
| D | 6189 | 80 | 1.292616% |
Noise dominated data is calculated using 1-second bins in cleaned event files. If a bin has >2000 counts, and if more than 50% of those come from <1% of pixels, then it is considered to be noise-dominated and hence unusable.
| Quadrant | # 1 sec bins | Bins with >0 counts | Bins with >2000 counts | High rate bins dominated by noise | Noise dominated (total time) | Noise dominated (detector-on time) | Marked lightcurve |
|---|---|---|---|---|---|---|---|
| A | 7173 | 6188 | 0 | 0 | 0.00% | 0.00% | 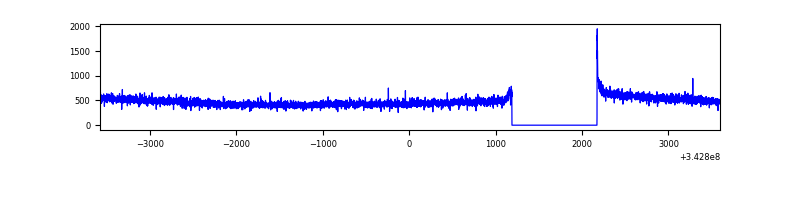 |
| B | 7174 | 6189 | 2 | 2 | 0.03% | 0.03% | 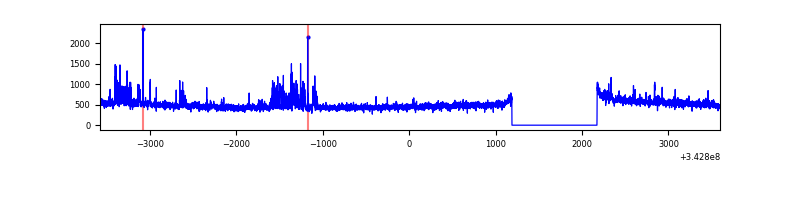 |
| C | 7174 | 6189 | 0 | 0 | 0.00% | 0.00% | 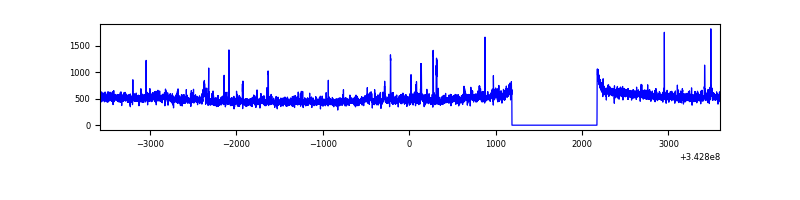 |
| D | 7174 | 6189 | 52 | 52 | 0.72% | 0.84% | 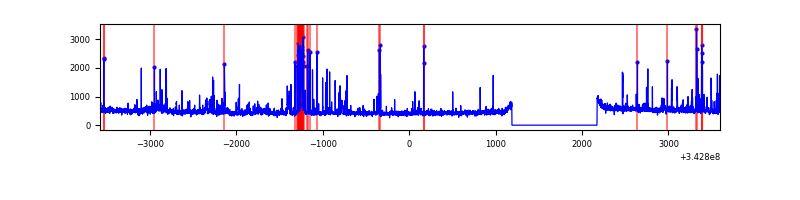 |
Top three noisy pixels from each quadrant. If the there are fewer than three noisy pixels in the level2.evt file, extra rows are filled as -1
| Pixel properties | Quadrant properties | ||||||
|---|---|---|---|---|---|---|---|
| Quadrant | DetID | PixID | Counts | Sigma | Mean | Median | Sigma |
| A | 13 | 254 | 9294 | 55.56 | 762 | 745 | 153.9 |
| A | 3 | 137 | 7113 | 41.39 | 762 | 745 | 153.9 |
| A | 0 | 226 | 6522 | 37.55 | 762 | 745 | 153.9 |
| B | 0 | 230 | 112283 | 772.5 | 753 | 733 | 144.4 |
| B | 3 | 64 | 47024 | 320.57 | 753 | 733 | 144.4 |
| B | 0 | 190 | 43280 | 294.65 | 753 | 733 | 144.4 |
| C | 3 | 233 | 156598 | 911.66 | 732 | 737 | 171.0 |
| C | 14 | 238 | 115626 | 672.01 | 732 | 737 | 171.0 |
| C | 8 | 208 | 26798 | 152.44 | 732 | 737 | 171.0 |
| D | 11 | 176 | 165252 | 933.91 | 737 | 717 | 176.2 |
| D | 1 | 52 | 152873 | 863.64 | 737 | 717 | 176.2 |
| D | 2 | 250 | 80793 | 454.51 | 737 | 717 | 176.2 |
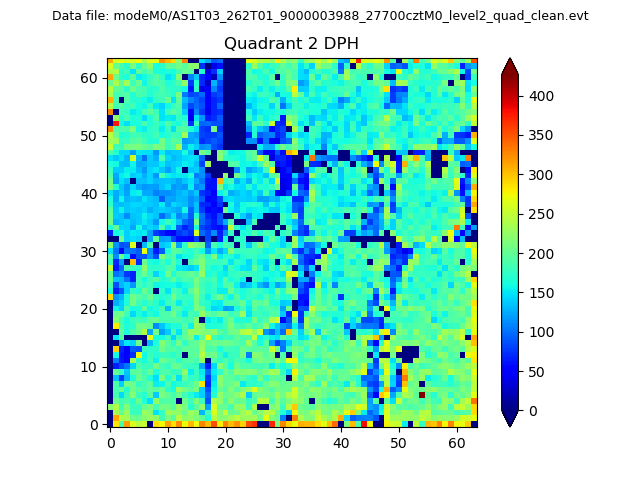
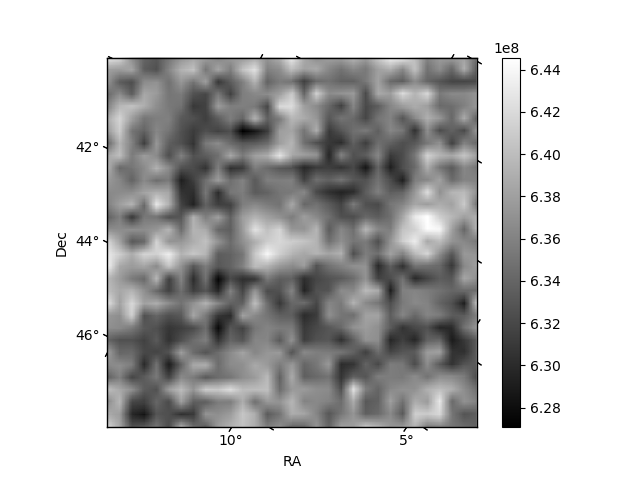
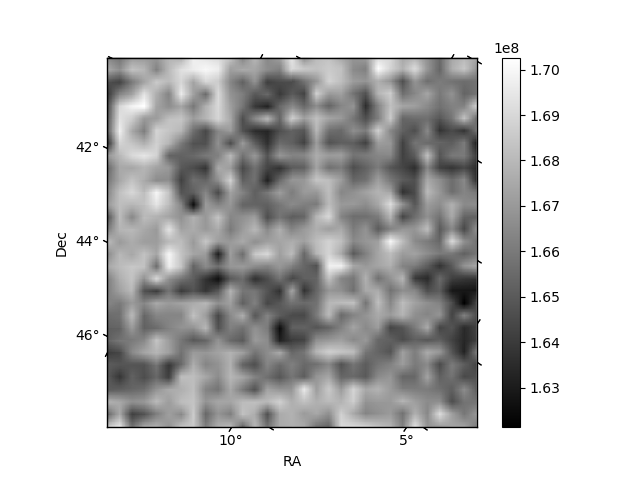
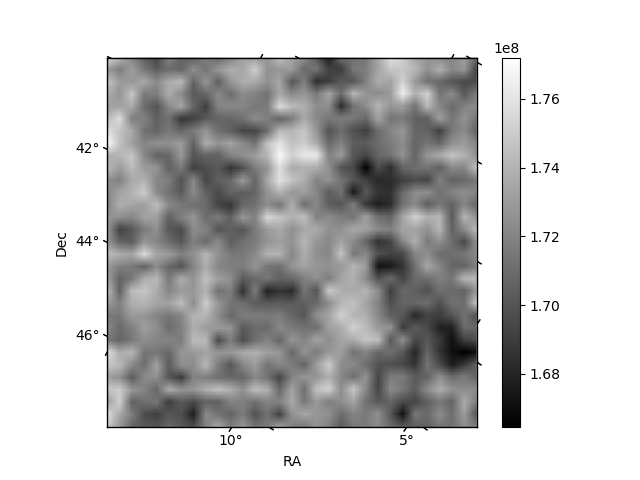
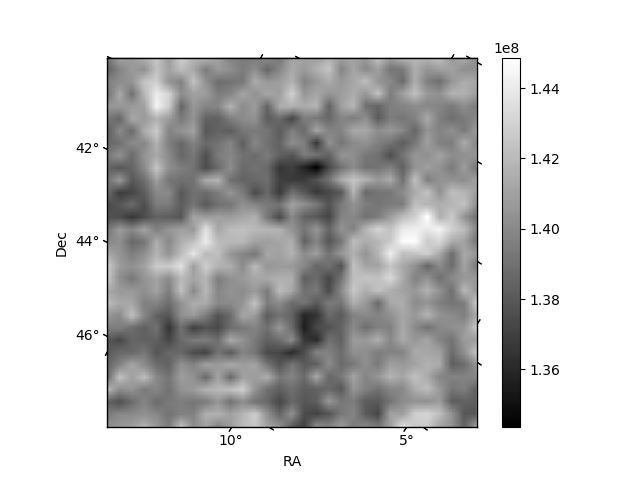
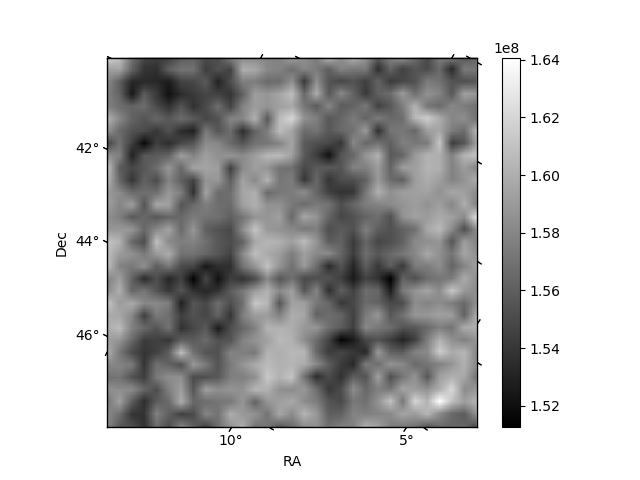
Histogram calculated using DETX and DETY for each event in the final _common_clean file
| Quadrant A | 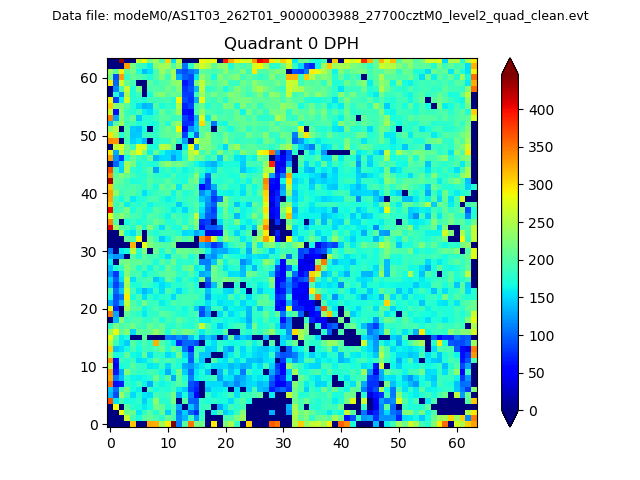 |
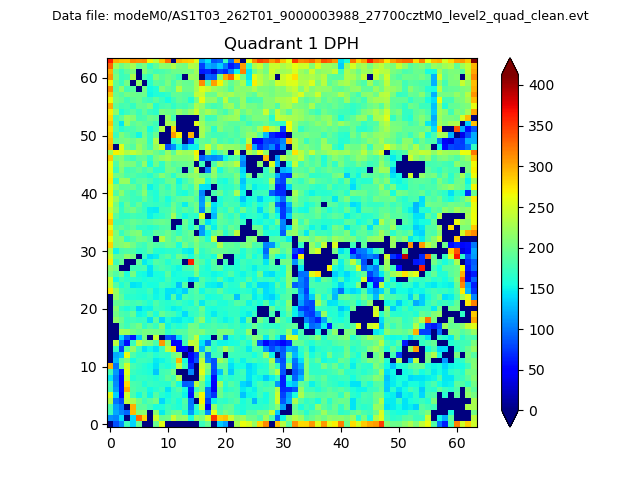 |
Quadrant B |
|---|---|---|---|
| Quadrant D | 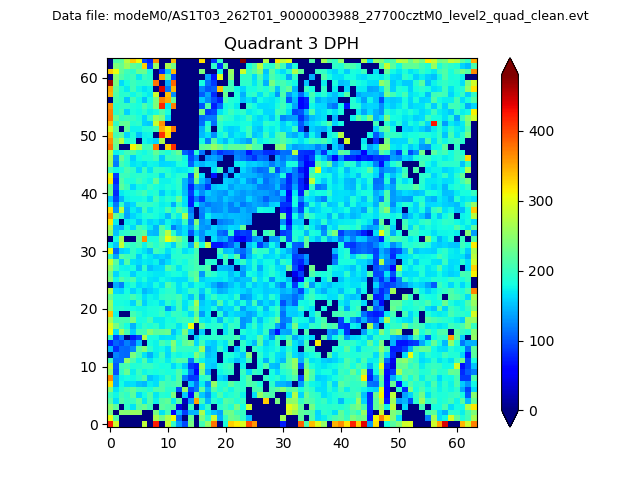 |
 |
Quadrant C |
| Plot type | Count rate plots | Images |
|---|---|---|
| Comparison with Poisson distribution Blue bars denote a histogram of data divided into 1 sec bins. Red curve is a Poisson curve with rate = median count rate of data. |
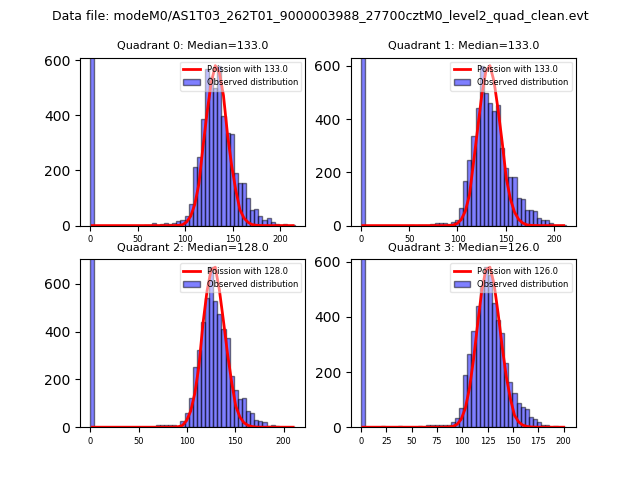 |
 |
| Quadrant-wise count rates Data is divided into 100 sec bins |
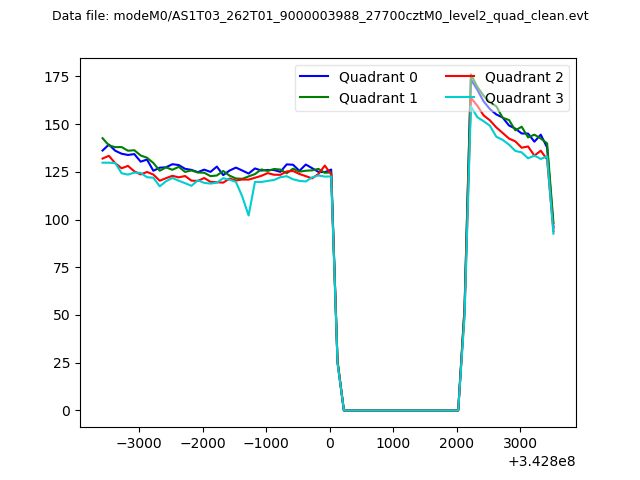 |
|
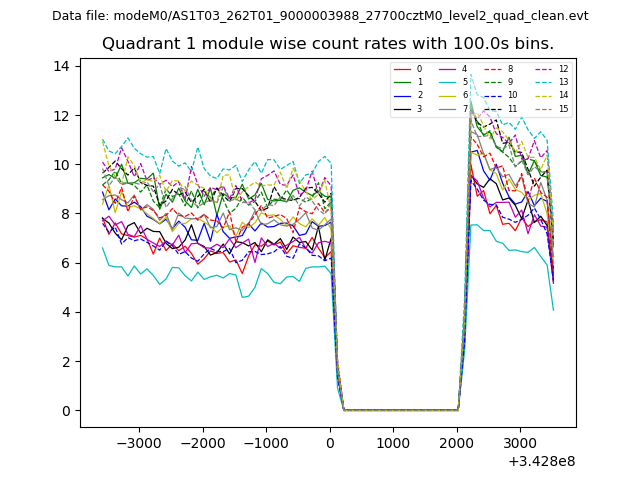
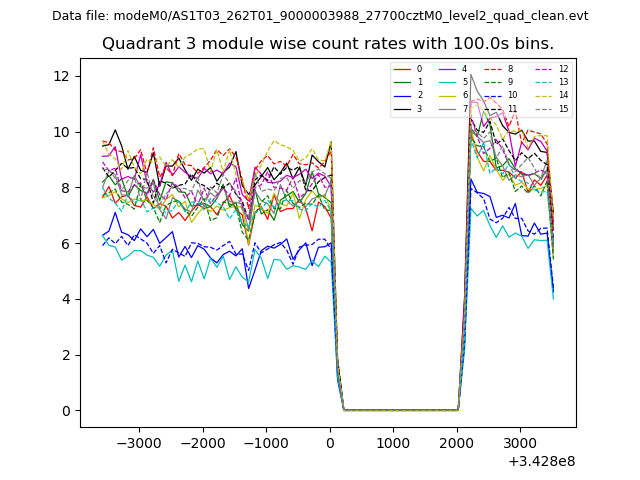
| Module-wise count rates for Quadrant A Data is divided into 100 sec bins |
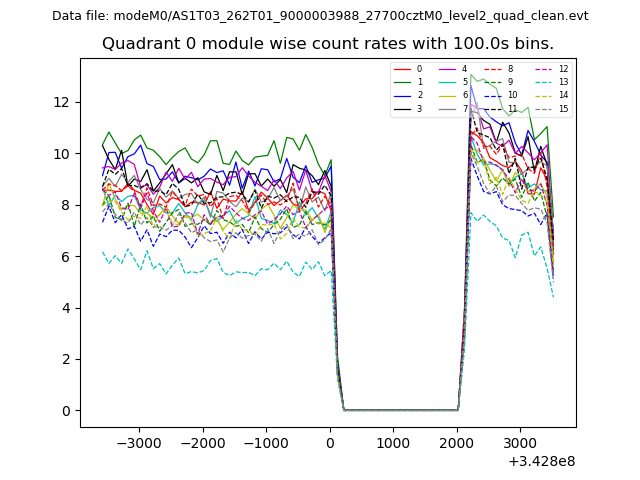 |
 |
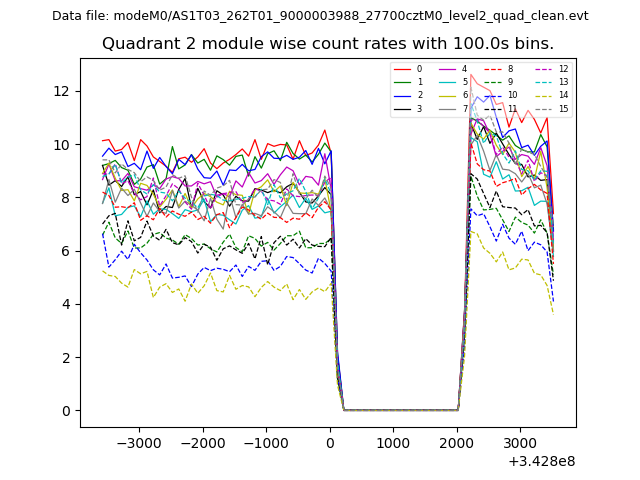
| Module-wise count rates for Quadrant B Data is divided into 100 sec bins |
 |
 |
| Module-wise count rates for Quadrant C Data is divided into 100 sec bins |
 |
 |
| Module-wise count rates for Quadrant D Data is divided into 100 sec bins |
 |
 |
| Parameter | Plot |
|---|---|
| CZT HV Monitor | 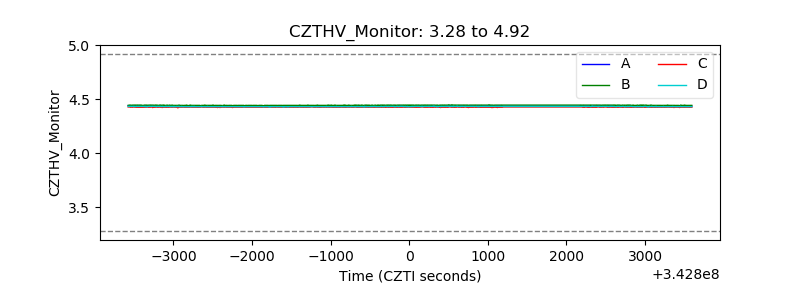 |
| D_VDD | 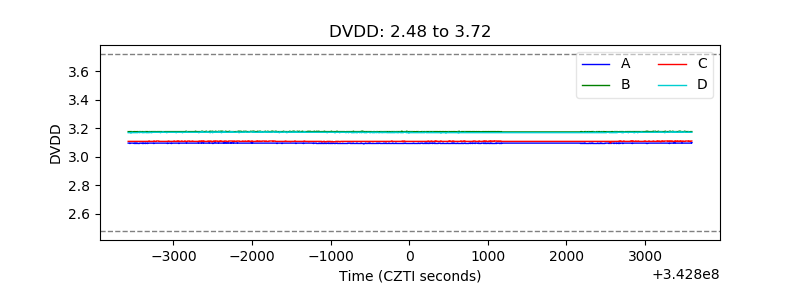 |
| Temperature 1 | 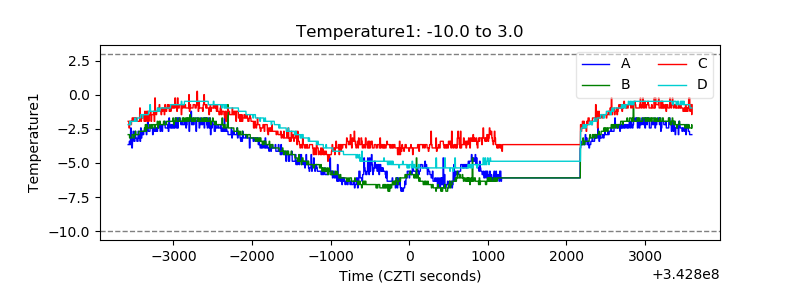 |
| Veto HV Monitor | 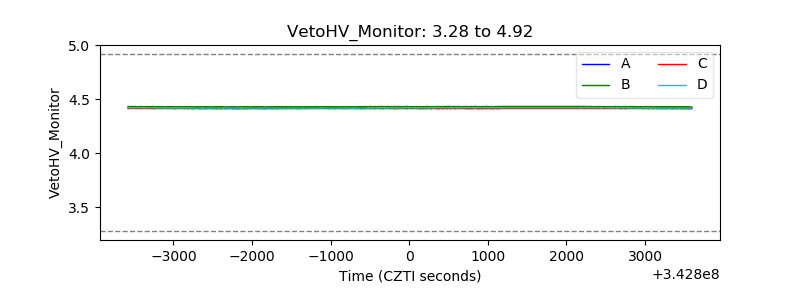 |
| Veto LLD | 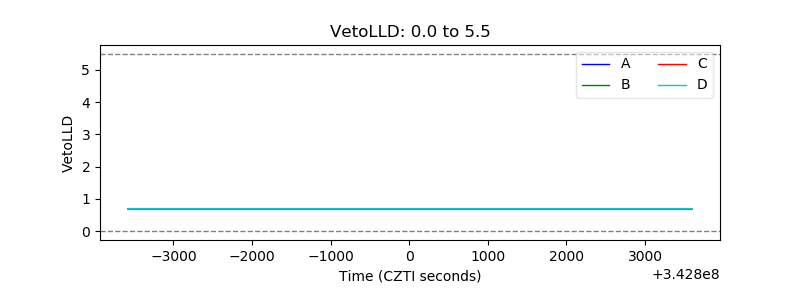 |
| Alpha Counter | 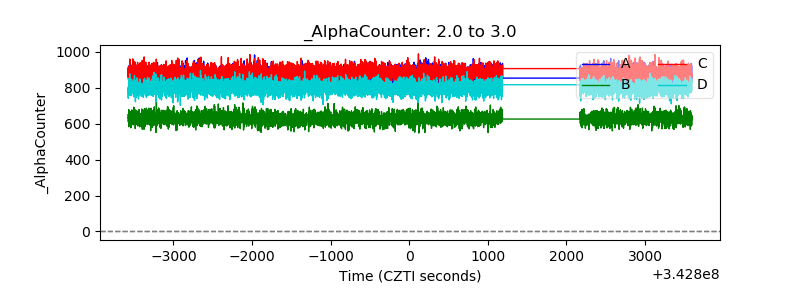 |
| _CPM_Rate | 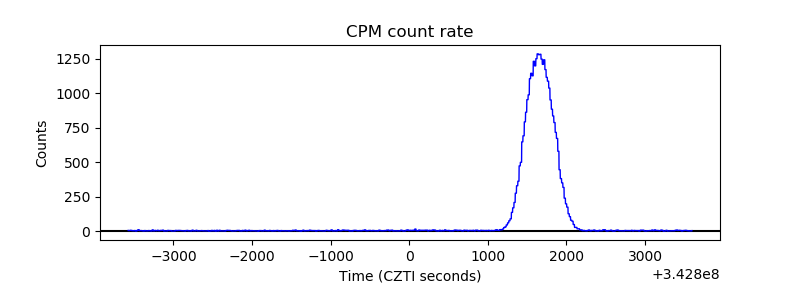 |
| CZT Counter | 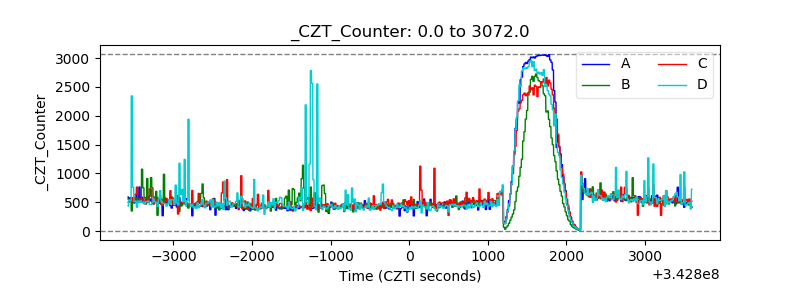 |
| +2.5 Volts monitor |  |
| +5 Volts monitor | 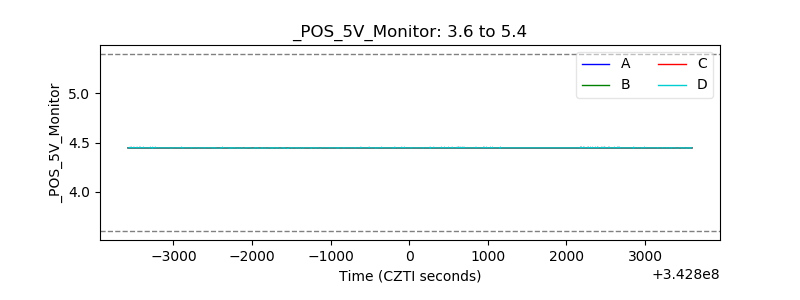 |
| _ROLL_ROT | 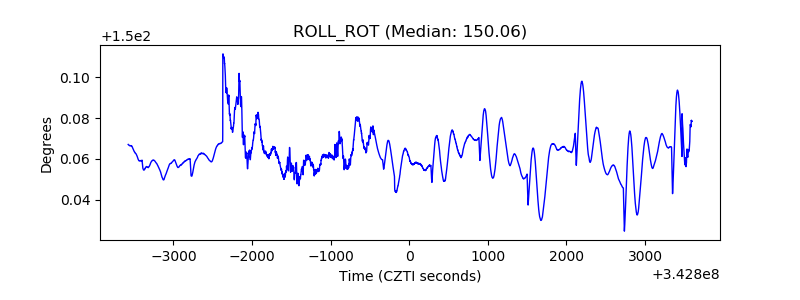 |
| _Roll_DEC | 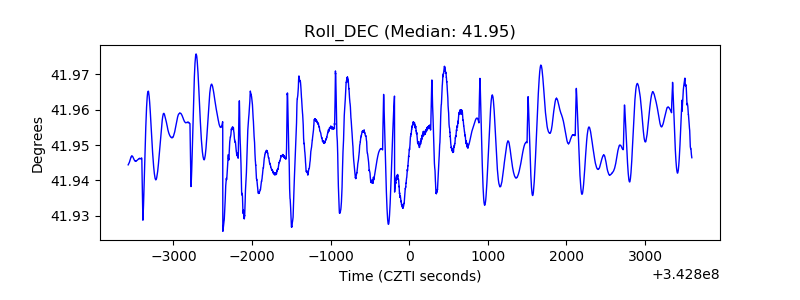 |
| _Roll_RA | 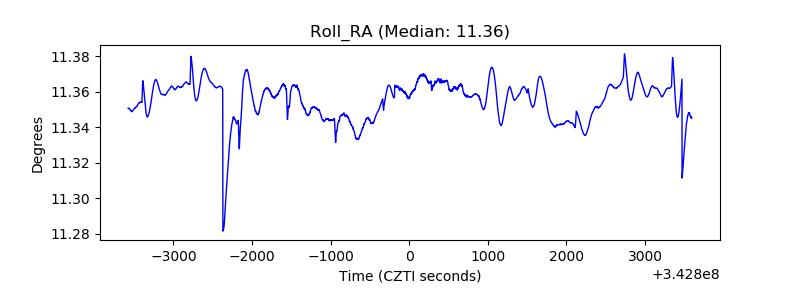 |
| Veto Counter | 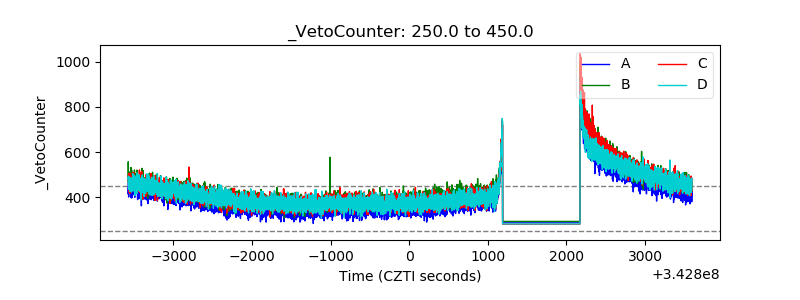 |