| Param | Original file | Final file |
|---|---|---|
| Filename | modeM0/AS1T03_262T01_9000003988_27702cztM0_level2.evt | modeM0/AS1T03_262T01_9000003988_27702cztM0_level2_quad_clean.evt |
| Size (bytes) | 468,365,760 | 111,352,320 |
| Size | 446.7 MB | 106.2 MB |
| Events in quadrant A | 3,257,804 | 748,920 |
| Events in quadrant B | 3,319,481 | 750,695 |
| Events in quadrant C | 3,395,162 | 720,292 |
| Events in quadrant D | 3,769,569 | 698,244 |
| Mode M0 | |||
|---|---|---|---|
| Quadrant | BADHDUFLAG | Total packets | Discarded packets |
| A | 0 | 14063 | 0 |
| B | 0 | 14198 | 0 |
| C | 0 | 14314 | 0 |
| D | 0 | 15526 | 0 |
| Mode M9 | |||
|---|---|---|---|
| Quadrant | BADHDUFLAG | Total packets | Discarded packets |
| A | 0 | 20 | 0 |
| B | 0 | 21 | 0 |
| C | 0 | 21 | 0 |
| D | 0 | 21 | 0 |
| Quadrant | Total seconds | Saturated seconds | Saturation percentage |
|---|---|---|---|
| A | 6516 | 85 | 1.304481% |
| B | 6516 | 77 | 1.181707% |
| C | 6516 | 112 | 1.718846% |
| D | 6516 | 139 | 2.133211% |
Noise dominated data is calculated using 1-second bins in cleaned event files. If a bin has >2000 counts, and if more than 50% of those come from <1% of pixels, then it is considered to be noise-dominated and hence unusable.
| Quadrant | # 1 sec bins | Bins with >0 counts | Bins with >2000 counts | High rate bins dominated by noise | Noise dominated (total time) | Noise dominated (detector-on time) | Marked lightcurve |
|---|---|---|---|---|---|---|---|
| A | 7636 | 6516 | 1 | 1 | 0.01% | 0.02% | 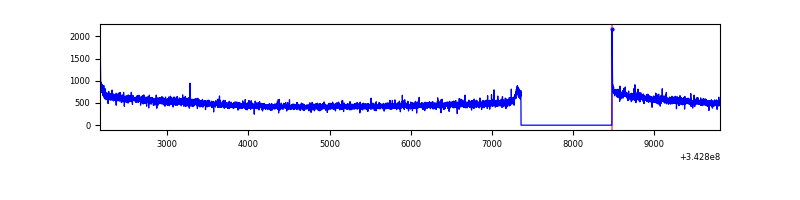 |
| B | 7636 | 6516 | 3 | 3 | 0.04% | 0.05% | 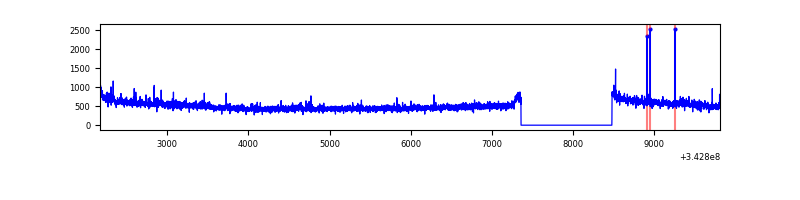 |
| C | 7636 | 6516 | 0 | 0 | 0.00% | 0.00% | 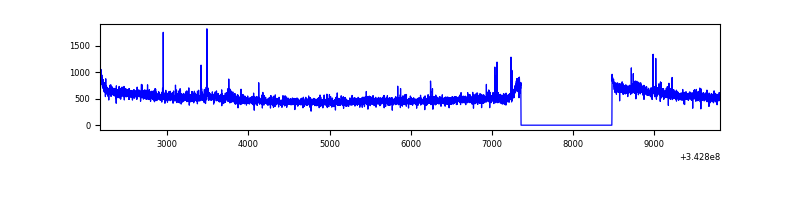 |
| D | 7636 | 6516 | 76 | 76 | 1.00% | 1.17% | 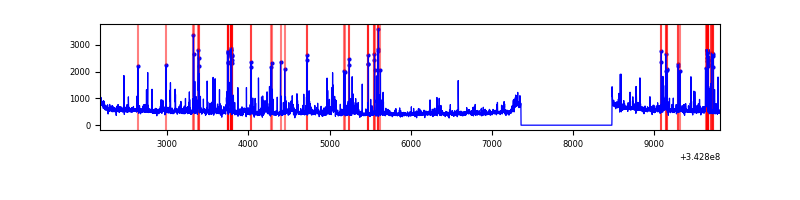 |
Top three noisy pixels from each quadrant. If the there are fewer than three noisy pixels in the level2.evt file, extra rows are filled as -1
| Pixel properties | Quadrant properties | ||||||
|---|---|---|---|---|---|---|---|
| Quadrant | DetID | PixID | Counts | Sigma | Mean | Median | Sigma |
| A | 8 | 192 | 13152 | 73.25 | 841 | 823 | 168.3 |
| A | 13 | 254 | 10019 | 54.64 | 841 | 823 | 168.3 |
| A | 3 | 137 | 7821 | 41.58 | 841 | 823 | 168.3 |
| B | 0 | 190 | 35955 | 225.67 | 827 | 805 | 155.8 |
| B | 0 | 230 | 21380 | 132.09 | 827 | 805 | 155.8 |
| B | 12 | 111 | 18551 | 113.93 | 827 | 805 | 155.8 |
| C | 14 | 238 | 128635 | 676.88 | 807 | 813 | 188.8 |
| C | 3 | 233 | 78228 | 409.95 | 807 | 813 | 188.8 |
| C | 8 | 208 | 23065 | 117.83 | 807 | 813 | 188.8 |
| D | 1 | 52 | 306843 | 1591.03 | 813 | 792 | 192.4 |
| D | 11 | 176 | 235518 | 1220.24 | 813 | 792 | 192.4 |
| D | 2 | 250 | 59920 | 307.38 | 813 | 792 | 192.4 |
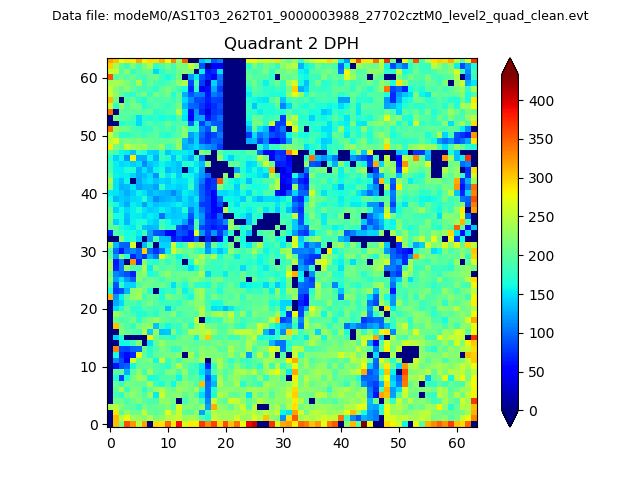
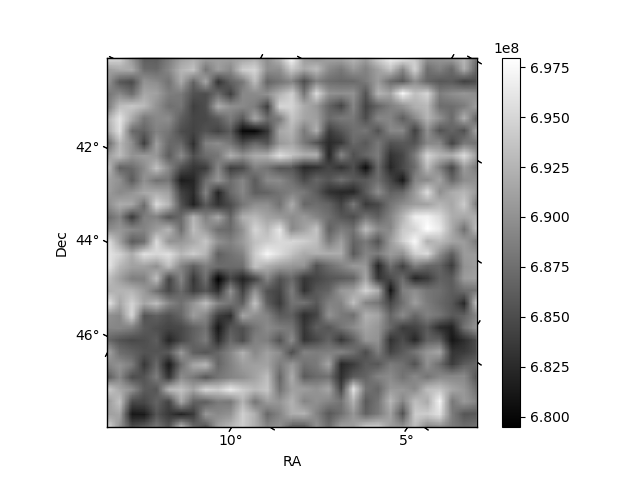
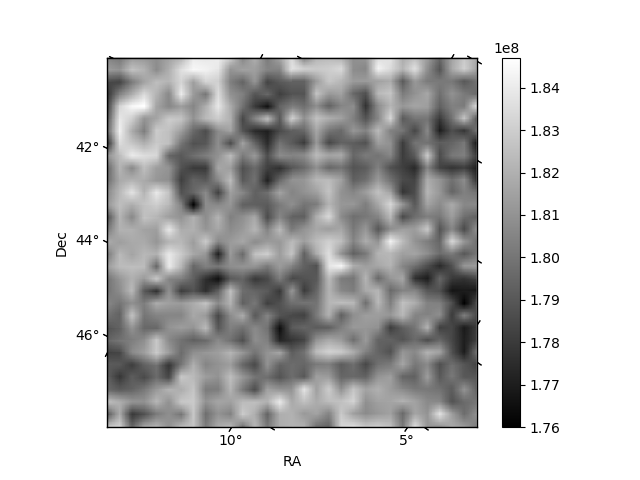
Histogram calculated using DETX and DETY for each event in the final _common_clean file
| Quadrant A | 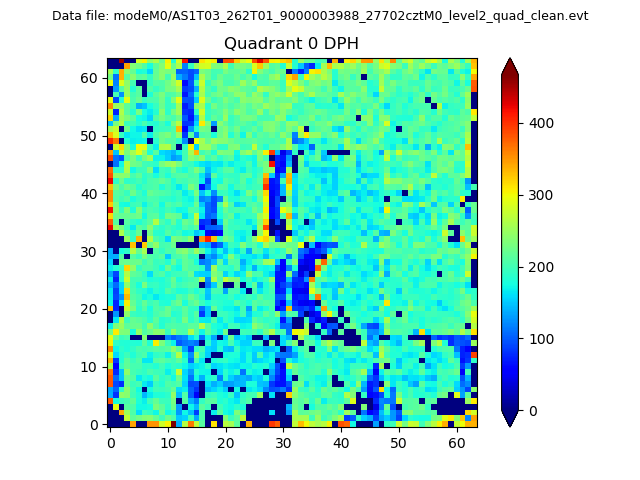 |
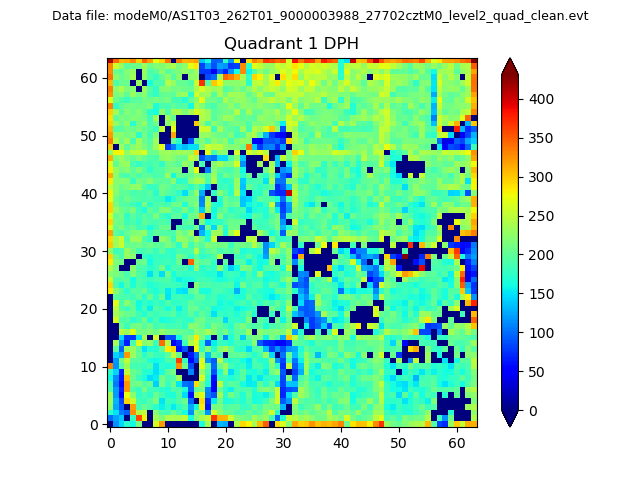 |
Quadrant B |
|---|---|---|---|
| Quadrant D | 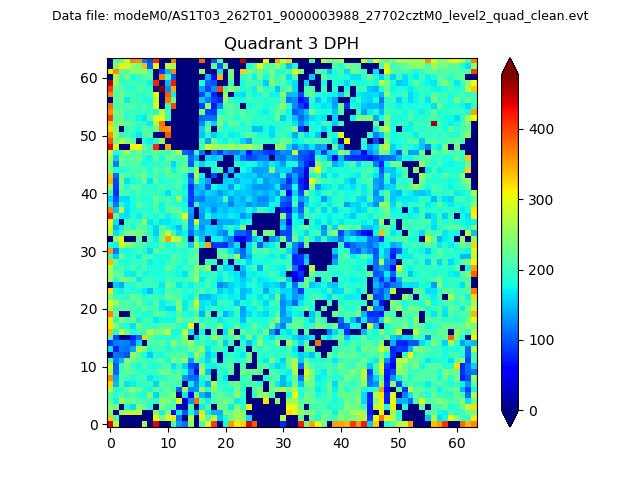 |
 |
Quadrant C |
| Plot type | Count rate plots | Images |
|---|---|---|
| Comparison with Poisson distribution Blue bars denote a histogram of data divided into 1 sec bins. Red curve is a Poisson curve with rate = median count rate of data. |
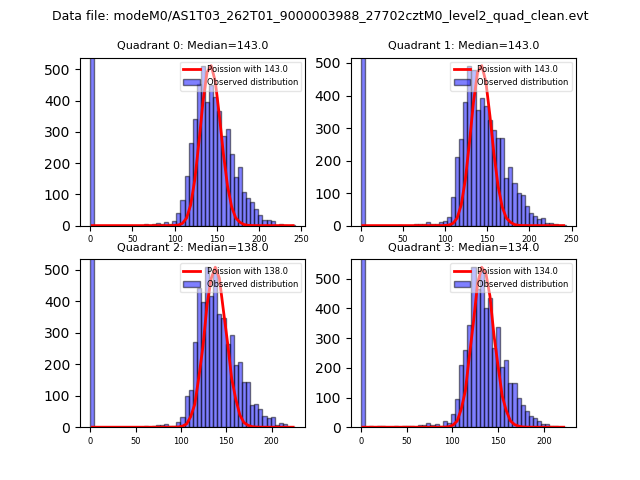 |
 |
| Quadrant-wise count rates Data is divided into 100 sec bins |
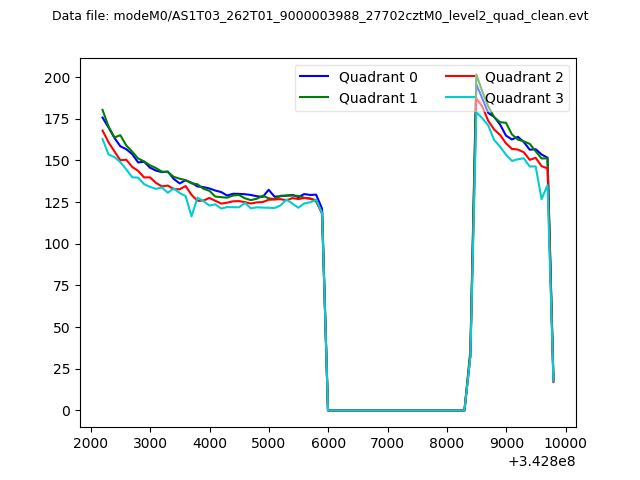 |
|
| Module-wise count rates for Quadrant A Data is divided into 100 sec bins |
 |
 |
| Module-wise count rates for Quadrant B Data is divided into 100 sec bins |
 |
 |
| Module-wise count rates for Quadrant C Data is divided into 100 sec bins |
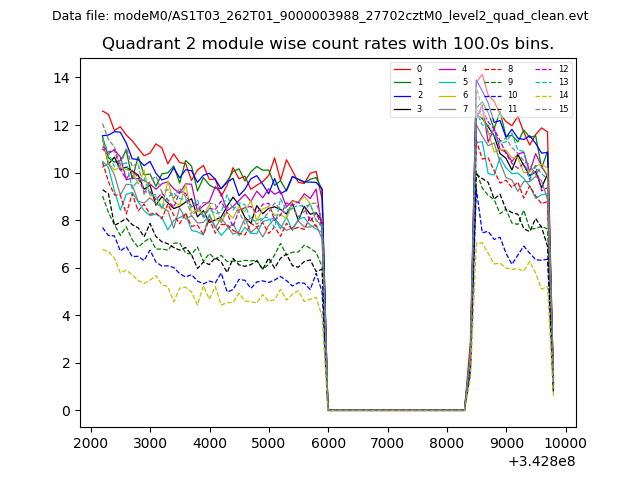 |
 |
| Module-wise count rates for Quadrant D Data is divided into 100 sec bins |
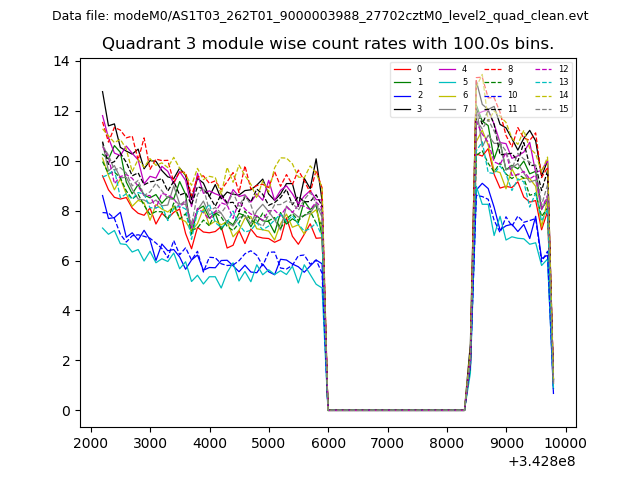 |
 |
| Parameter | Plot |
|---|---|
| CZT HV Monitor | 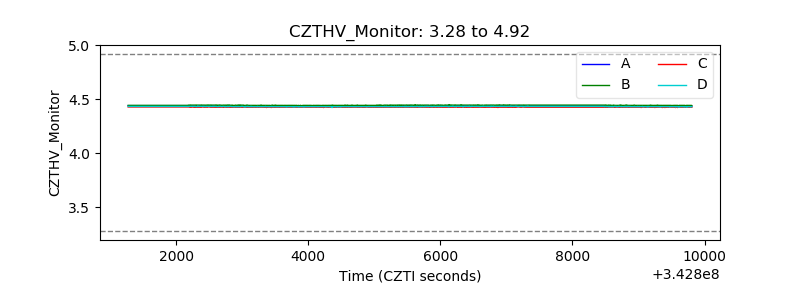 |
| D_VDD | 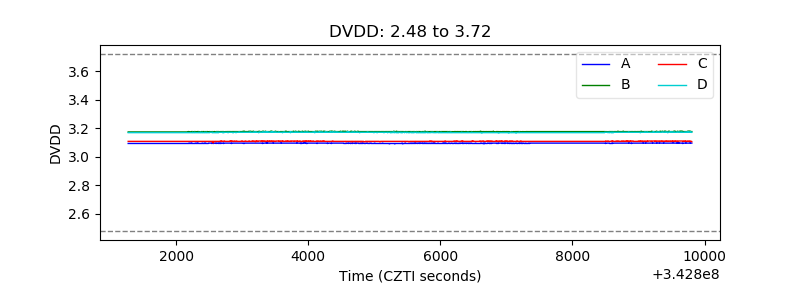 |
| Temperature 1 | 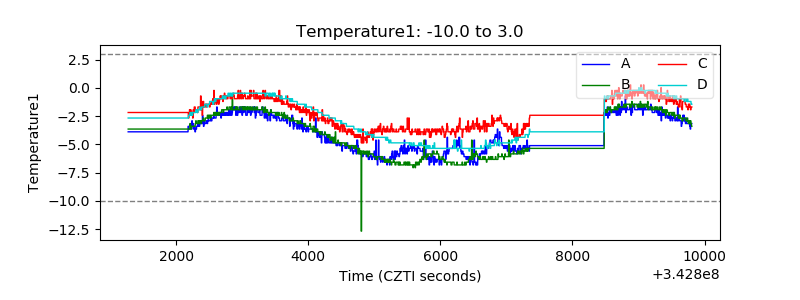 |
| Veto HV Monitor | 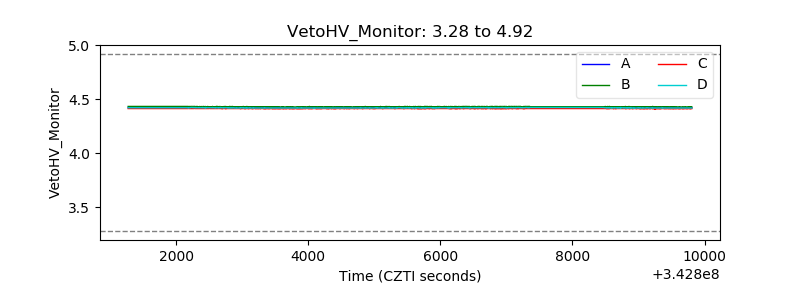 |
| Veto LLD | 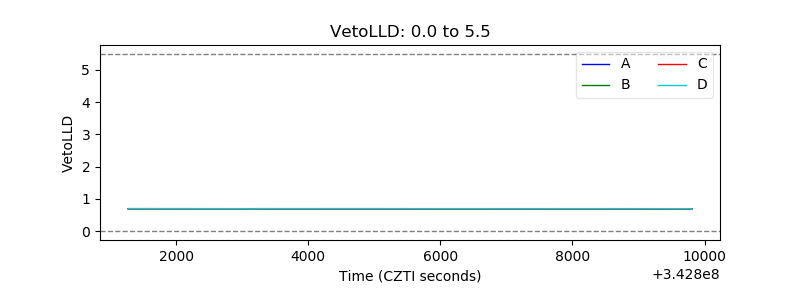 |
| Alpha Counter | 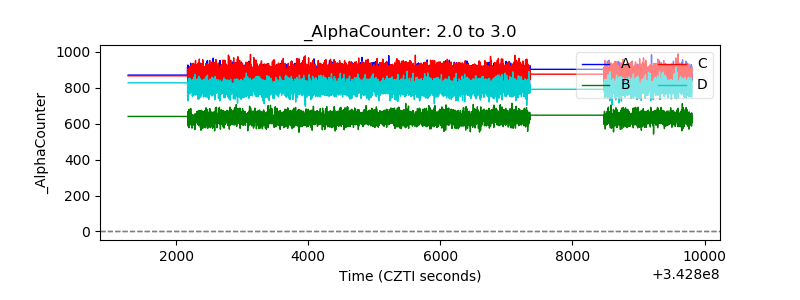 |
| _CPM_Rate | 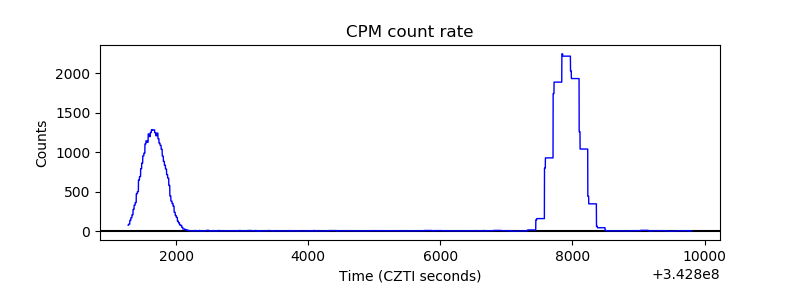 |
| CZT Counter | 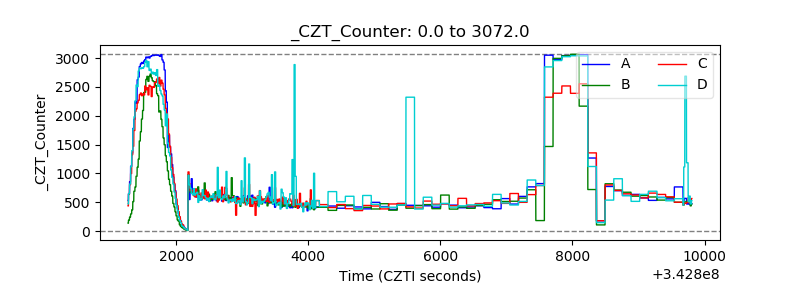 |
| +2.5 Volts monitor | 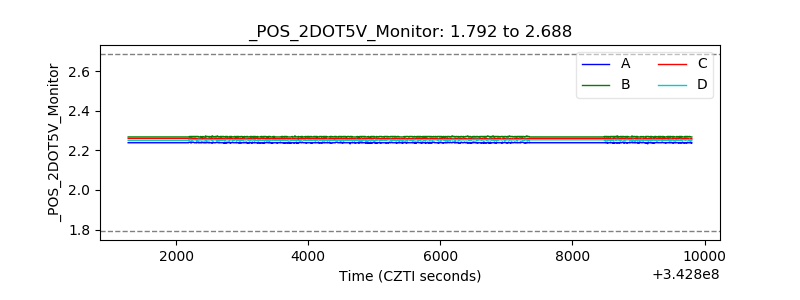 |
| +5 Volts monitor |  |
| _ROLL_ROT | 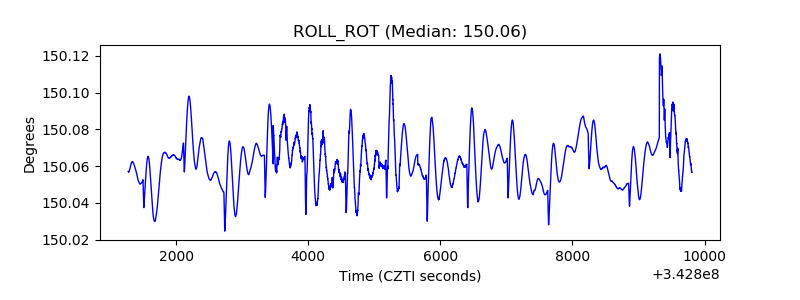 |
| _Roll_DEC | 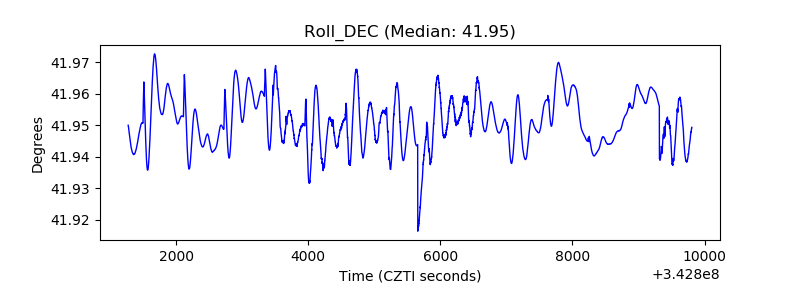 |
| _Roll_RA | 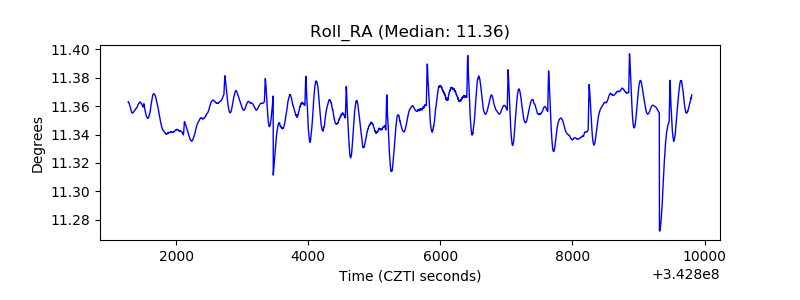 |
| Veto Counter | 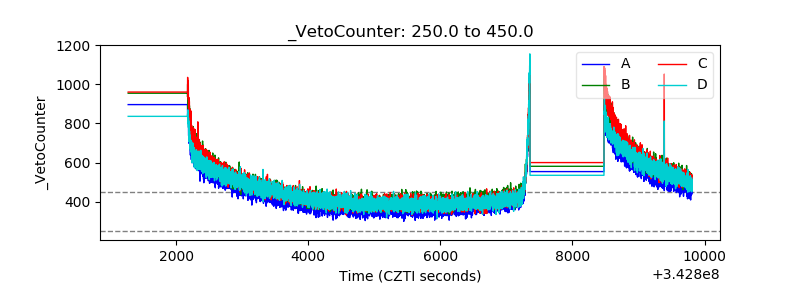 |