| Param | Original file | Final file |
|---|---|---|
| Filename | modeM0/AS1T03_262T01_9000003988_27703cztM0_level2.evt | modeM0/AS1T03_262T01_9000003988_27703cztM0_level2_quad_clean.evt |
| Size (bytes) | 481,979,520 | 109,808,640 |
| Size | 459.7 MB | 104.7 MB |
| Events in quadrant A | 3,270,440 | 738,620 |
| Events in quadrant B | 3,433,043 | 743,625 |
| Events in quadrant C | 3,456,353 | 715,396 |
| Events in quadrant D | 4,006,201 | 685,254 |
| Mode M0 | |||
|---|---|---|---|
| Quadrant | BADHDUFLAG | Total packets | Discarded packets |
| A | 0 | 13863 | 0 |
| B | 0 | 14453 | 0 |
| C | 0 | 14409 | 0 |
| D | 0 | 16263 | 0 |
| Mode M9 | |||
|---|---|---|---|
| Quadrant | BADHDUFLAG | Total packets | Discarded packets |
| A | 0 | 14 | 0 |
| B | 0 | 15 | 0 |
| C | 0 | 15 | 0 |
| D | 0 | 15 | 0 |
| Quadrant | Total seconds | Saturated seconds | Saturation percentage |
|---|---|---|---|
| A | 6349 | 56 | 0.882029% |
| B | 6348 | 61 | 0.960933% |
| C | 6348 | 106 | 1.669817% |
| D | 6348 | 228 | 3.591682% |
Noise dominated data is calculated using 1-second bins in cleaned event files. If a bin has >2000 counts, and if more than 50% of those come from <1% of pixels, then it is considered to be noise-dominated and hence unusable.
| Quadrant | # 1 sec bins | Bins with >0 counts | Bins with >2000 counts | High rate bins dominated by noise | Noise dominated (total time) | Noise dominated (detector-on time) | Marked lightcurve |
|---|---|---|---|---|---|---|---|
| A | 7584 | 6349 | 1 | 1 | 0.01% | 0.02% | 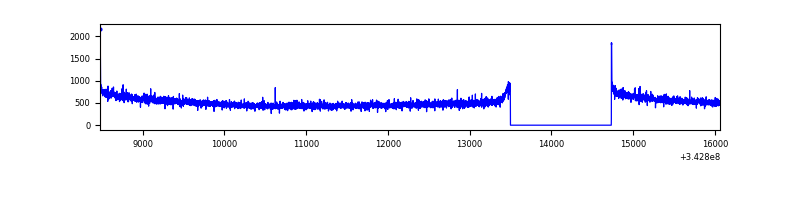 |
| B | 7583 | 6348 | 4 | 4 | 0.05% | 0.06% | 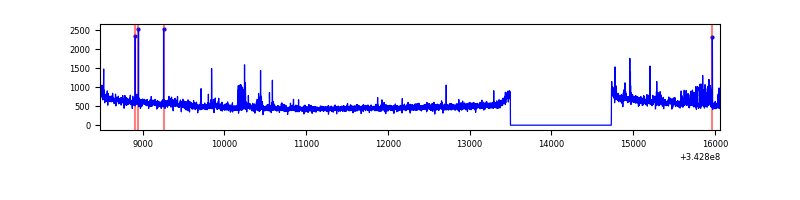 |
| C | 7583 | 6348 | 0 | 0 | 0.00% | 0.00% | 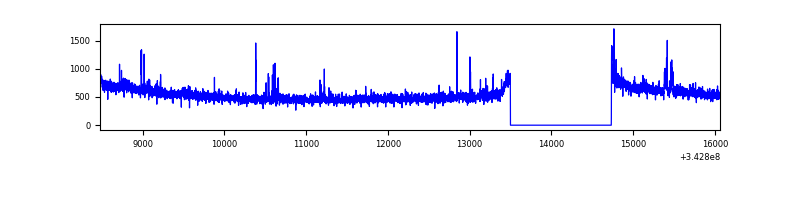 |
| D | 7583 | 6348 | 192 | 192 | 2.53% | 3.02% | 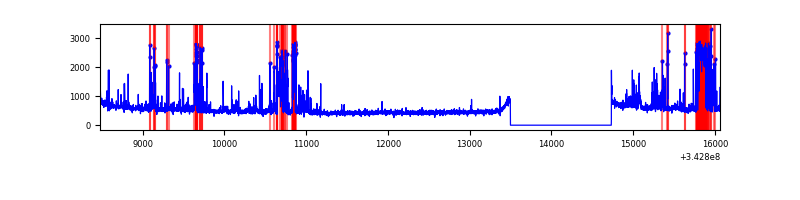 |
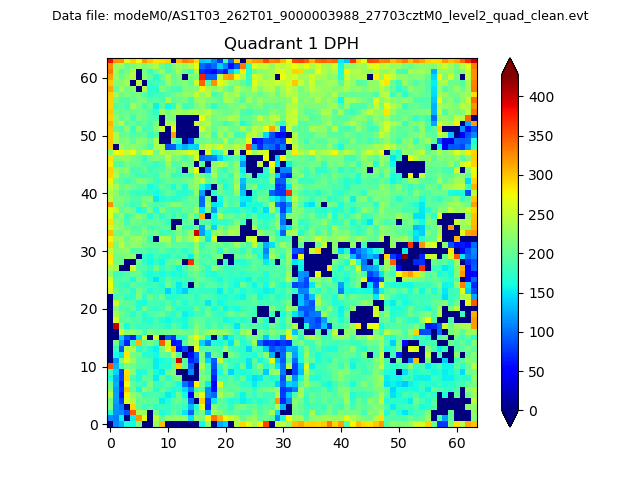
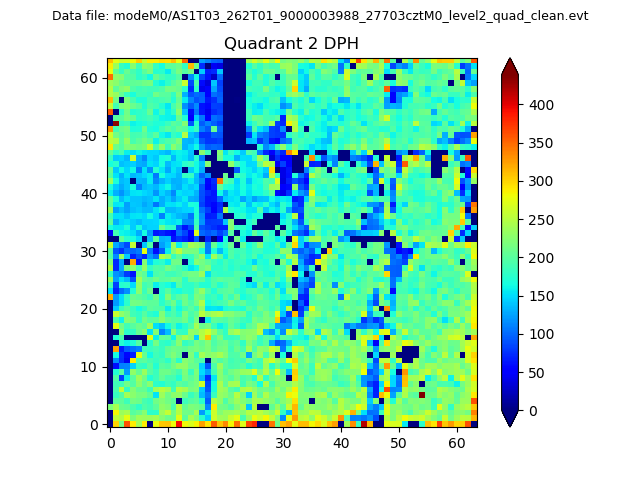
Top three noisy pixels from each quadrant. If the there are fewer than three noisy pixels in the level2.evt file, extra rows are filled as -1
| Pixel properties | Quadrant properties | ||||||
|---|---|---|---|---|---|---|---|
| Quadrant | DetID | PixID | Counts | Sigma | Mean | Median | Sigma |
| A | 8 | 192 | 13490 | 76.4 | 843 | 829 | 165.7 |
| A | 13 | 254 | 10529 | 58.53 | 843 | 829 | 165.7 |
| A | 3 | 137 | 7488 | 40.18 | 843 | 829 | 165.7 |
| B | 0 | 230 | 125002 | 803.64 | 832 | 813 | 154.5 |
| B | 0 | 190 | 43435 | 275.81 | 832 | 813 | 154.5 |
| B | 12 | 111 | 18052 | 111.55 | 832 | 813 | 154.5 |
| C | 14 | 238 | 132133 | 700.42 | 814 | 822 | 187.5 |
| C | 3 | 233 | 74765 | 394.41 | 814 | 822 | 187.5 |
| C | 8 | 208 | 31070 | 161.34 | 814 | 822 | 187.5 |
| D | 11 | 176 | 686197 | 3600.14 | 813 | 793 | 190.4 |
| D | 1 | 52 | 121055 | 631.68 | 813 | 793 | 190.4 |
| D | 2 | 250 | 69331 | 360.0 | 813 | 793 | 190.4 |
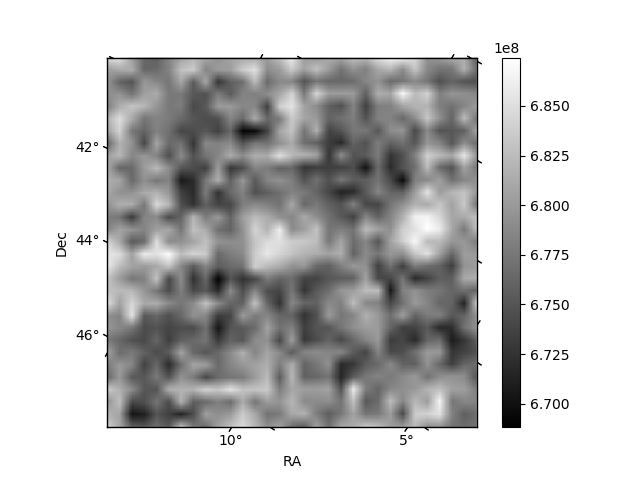
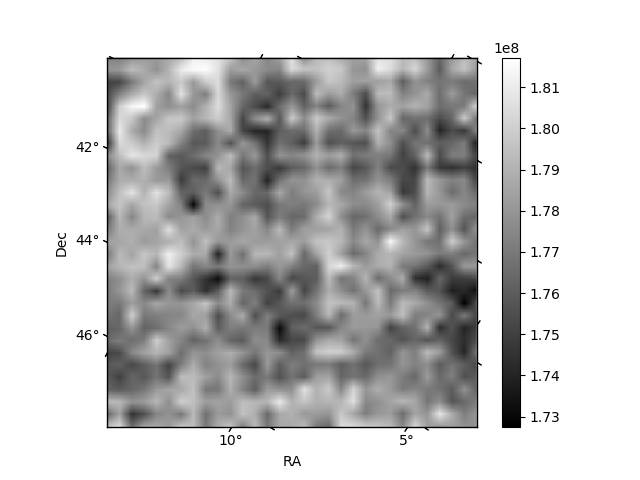
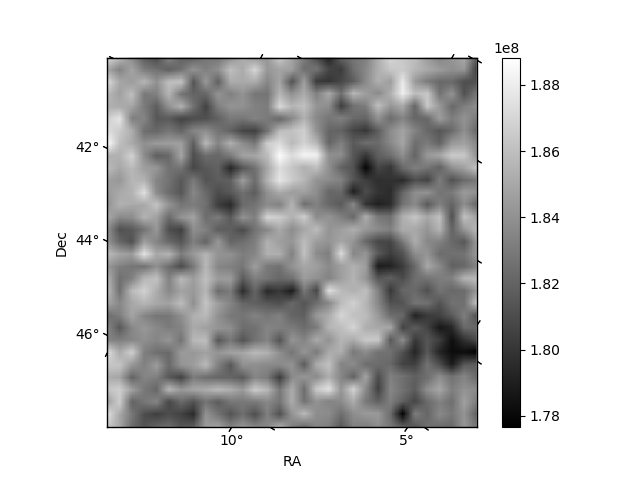
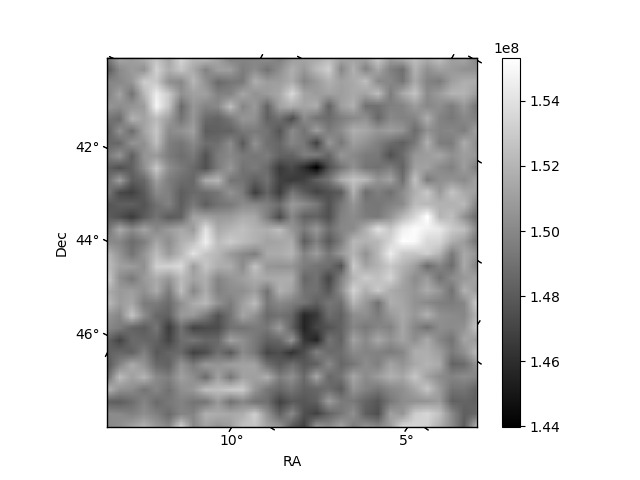
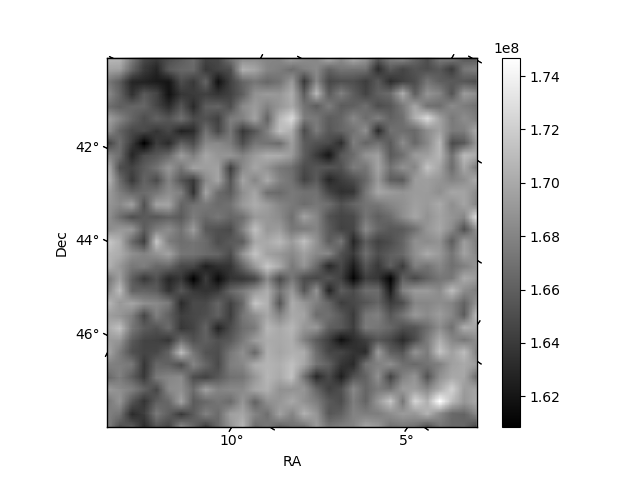
Histogram calculated using DETX and DETY for each event in the final _common_clean file
| Quadrant A | 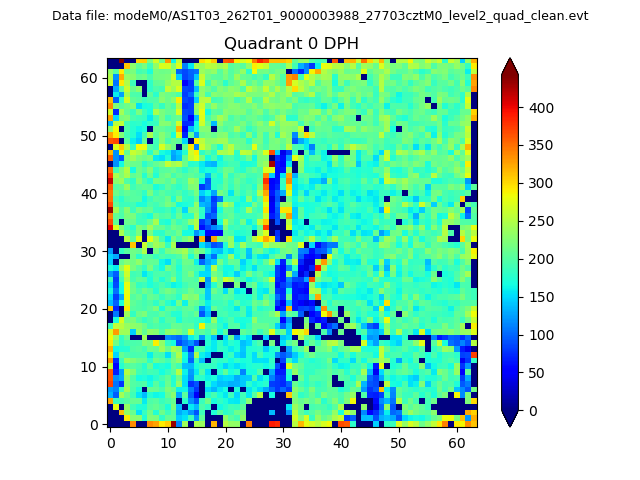 |
 |
Quadrant B |
|---|---|---|---|
| Quadrant D | 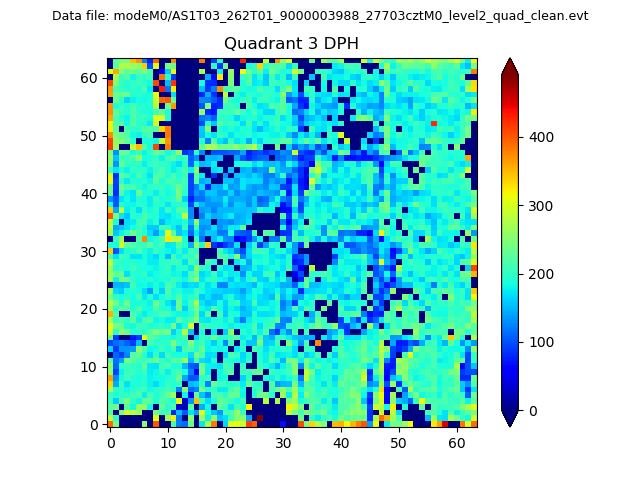 |
 |
Quadrant C |
| Plot type | Count rate plots | Images |
|---|---|---|
| Comparison with Poisson distribution Blue bars denote a histogram of data divided into 1 sec bins. Red curve is a Poisson curve with rate = median count rate of data. |
 |
 |
| Quadrant-wise count rates Data is divided into 100 sec bins |
 |
|
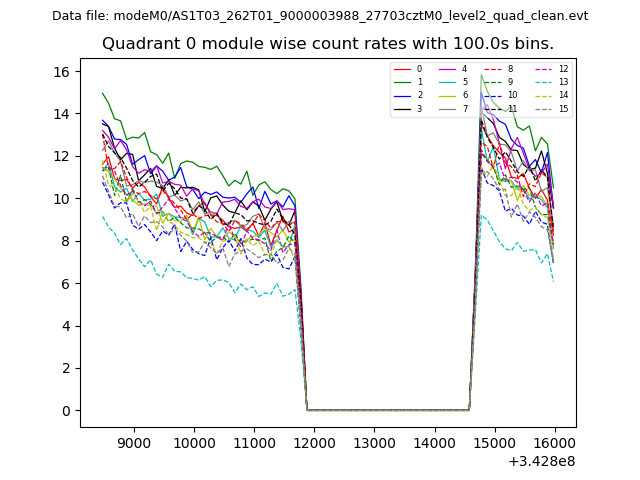
| Module-wise count rates for Quadrant A Data is divided into 100 sec bins |
 |
 |
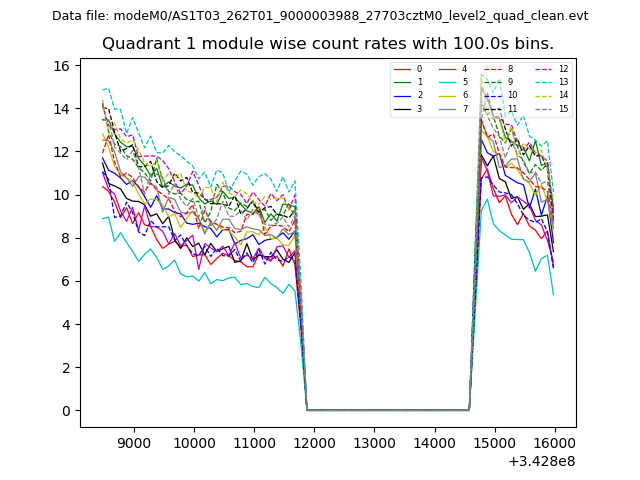
| Module-wise count rates for Quadrant B Data is divided into 100 sec bins |
 |
 |
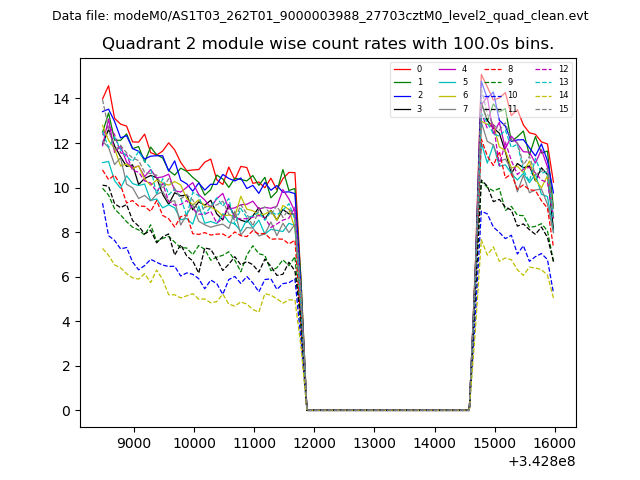
| Module-wise count rates for Quadrant C Data is divided into 100 sec bins |
 |
 |
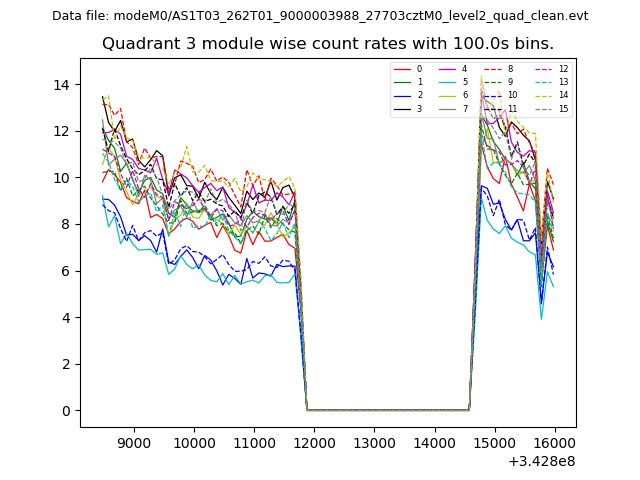
| Module-wise count rates for Quadrant D Data is divided into 100 sec bins |
 |
 |
| Parameter | Plot |
|---|---|
| CZT HV Monitor | 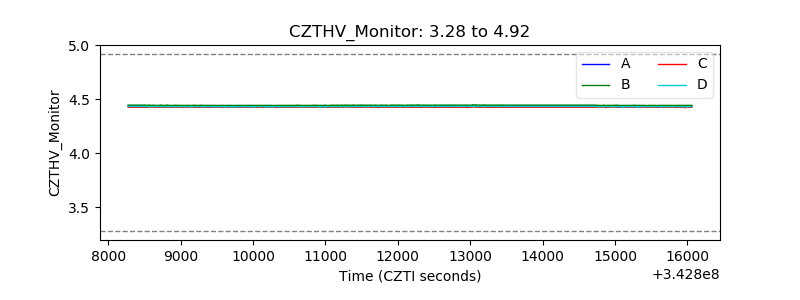 |
| D_VDD | 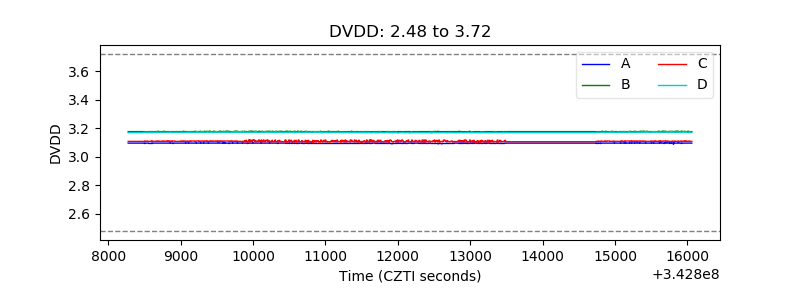 |
| Temperature 1 | 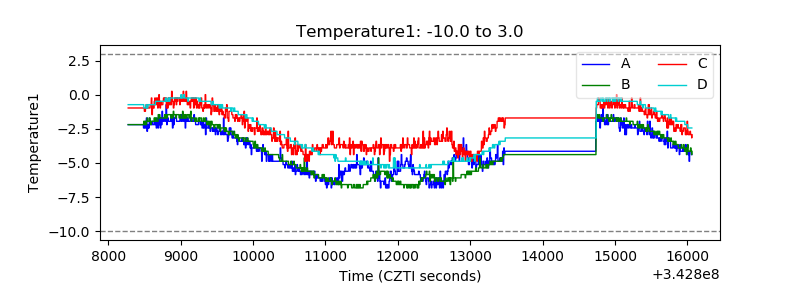 |
| Veto HV Monitor | 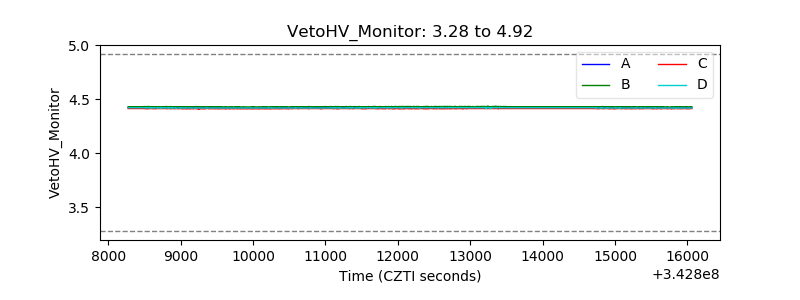 |
| Veto LLD | 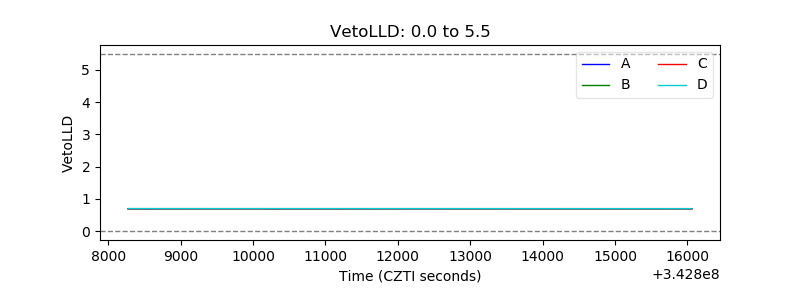 |
| Alpha Counter |  |
| _CPM_Rate |  |
| CZT Counter | 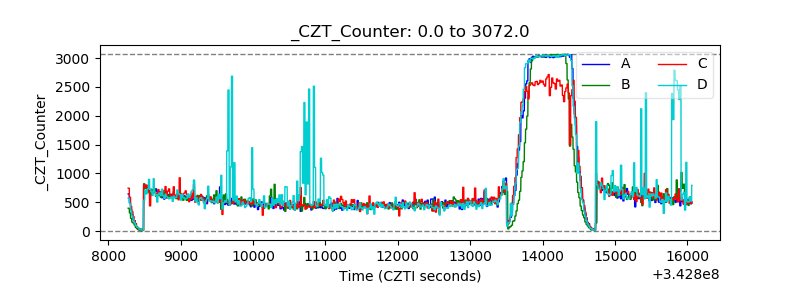 |
| +2.5 Volts monitor |  |
| +5 Volts monitor |  |
| _ROLL_ROT |  |
| _Roll_DEC | 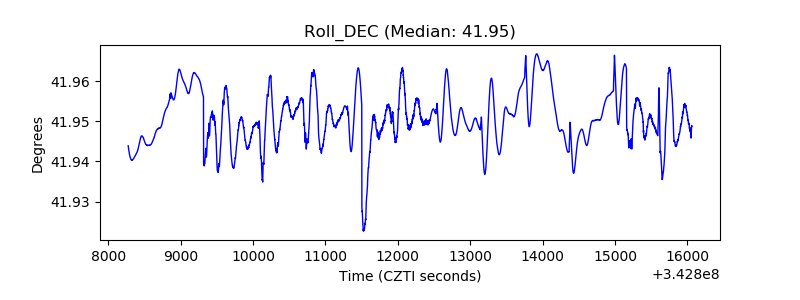 |
| _Roll_RA | 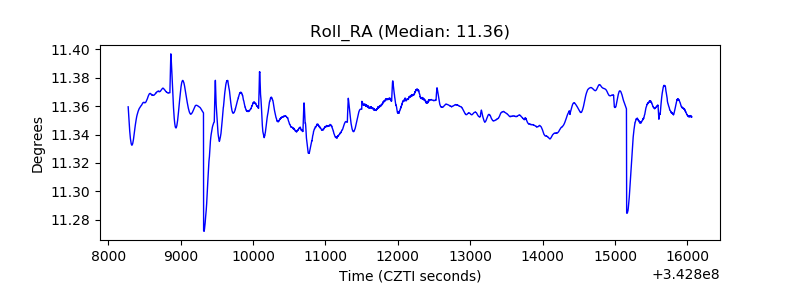 |
| Veto Counter | 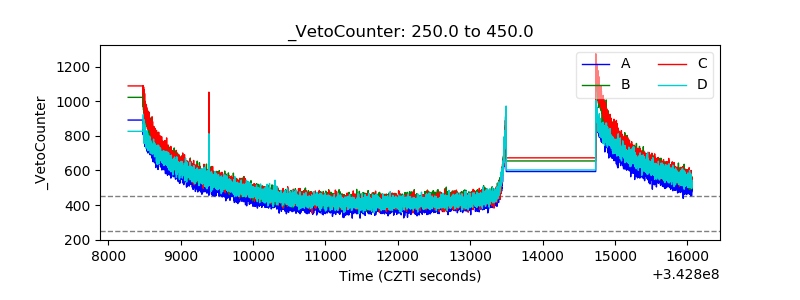 |