| Param | Original file | Final file |
|---|---|---|
| Filename | modeM0/AS1T03_262T01_9000003988_27704cztM0_level2.evt | modeM0/AS1T03_262T01_9000003988_27704cztM0_level2_quad_clean.evt |
| Size (bytes) | 467,349,120 | 101,845,440 |
| Size | 445.7 MB | 97.1 MB |
| Events in quadrant A | 3,196,469 | 677,395 |
| Events in quadrant B | 3,458,976 | 686,083 |
| Events in quadrant C | 3,375,176 | 662,162 |
| Events in quadrant D | 3,707,811 | 631,817 |
| Mode M0 | |||
|---|---|---|---|
| Quadrant | BADHDUFLAG | Total packets | Discarded packets |
| A | 0 | 13358 | 0 |
| B | 0 | 14355 | 0 |
| C | 0 | 13958 | 0 |
| D | 0 | 15184 | 0 |
| Mode M9 | |||
|---|---|---|---|
| Quadrant | BADHDUFLAG | Total packets | Discarded packets |
| A | 0 | 13 | 0 |
| B | 0 | 13 | 0 |
| C | 0 | 13 | 0 |
| D | 0 | 13 | 0 |
| Quadrant | Total seconds | Saturated seconds | Saturation percentage |
|---|---|---|---|
| A | 6117 | 75 | 1.226091% |
| B | 6117 | 80 | 1.307831% |
| C | 6116 | 141 | 2.305428% |
| D | 6116 | 205 | 3.351864% |
Noise dominated data is calculated using 1-second bins in cleaned event files. If a bin has >2000 counts, and if more than 50% of those come from <1% of pixels, then it is considered to be noise-dominated and hence unusable.
| Quadrant | # 1 sec bins | Bins with >0 counts | Bins with >2000 counts | High rate bins dominated by noise | Noise dominated (total time) | Noise dominated (detector-on time) | Marked lightcurve |
|---|---|---|---|---|---|---|---|
| A | 7422 | 6117 | 1 | 1 | 0.01% | 0.02% | 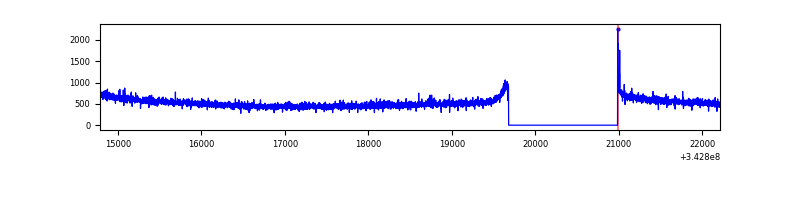 |
| B | 7422 | 6117 | 2 | 2 | 0.03% | 0.03% | 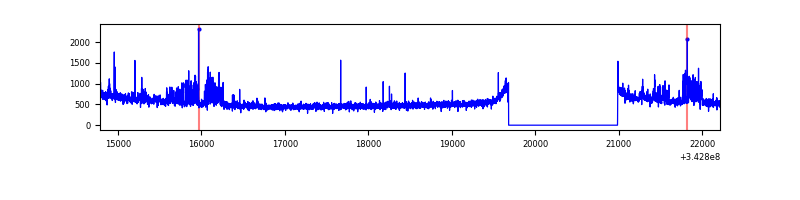 |
| C | 7421 | 6116 | 2 | 2 | 0.03% | 0.03% | 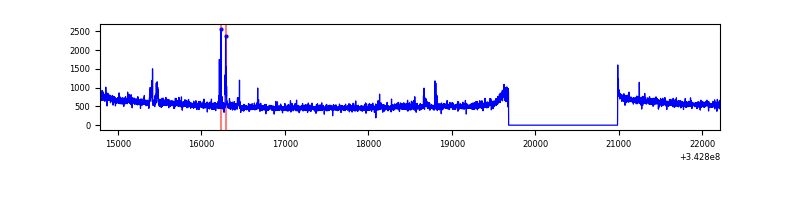 |
| D | 7421 | 6116 | 146 | 146 | 1.97% | 2.39% | 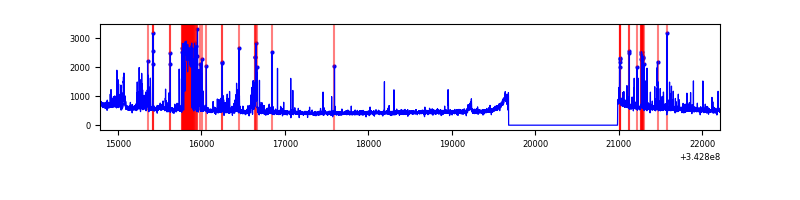 |
Top three noisy pixels from each quadrant. If the there are fewer than three noisy pixels in the level2.evt file, extra rows are filled as -1
| Pixel properties | Quadrant properties | ||||||
|---|---|---|---|---|---|---|---|
| Quadrant | DetID | PixID | Counts | Sigma | Mean | Median | Sigma |
| A | 13 | 254 | 10639 | 60.45 | 823 | 807 | 162.6 |
| A | 8 | 192 | 7902 | 43.62 | 823 | 807 | 162.6 |
| A | 3 | 137 | 7213 | 39.39 | 823 | 807 | 162.6 |
| B | 0 | 230 | 222466 | 1474.94 | 816 | 797 | 150.3 |
| B | 0 | 190 | 31200 | 202.3 | 816 | 797 | 150.3 |
| B | 12 | 111 | 17202 | 109.16 | 816 | 797 | 150.3 |
| C | 14 | 238 | 129931 | 694.8 | 801 | 808 | 185.8 |
| C | 3 | 233 | 96143 | 512.99 | 801 | 808 | 185.8 |
| C | 15 | 208 | 10156 | 50.3 | 801 | 808 | 185.8 |
| D | 11 | 176 | 412815 | 2202.45 | 796 | 779 | 187.1 |
| D | 12 | 2 | 89805 | 475.87 | 796 | 779 | 187.1 |
| D | 2 | 250 | 88825 | 470.63 | 796 | 779 | 187.1 |
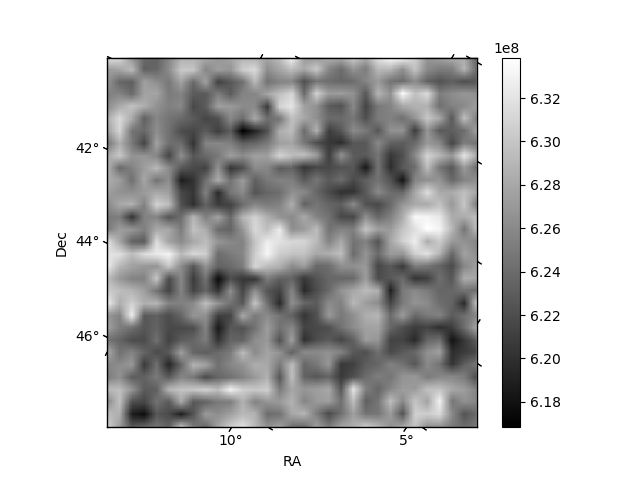
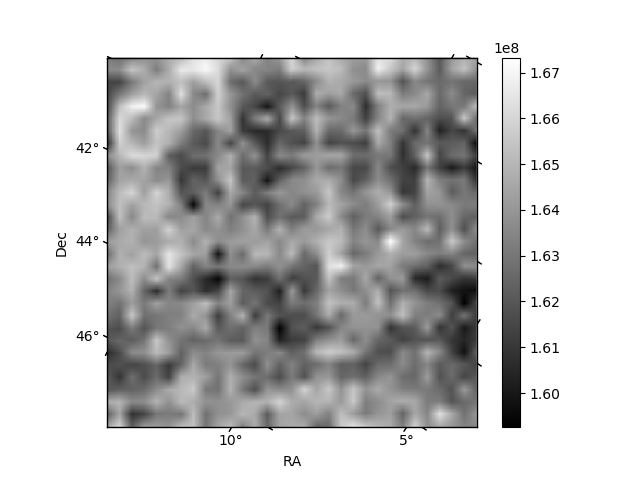
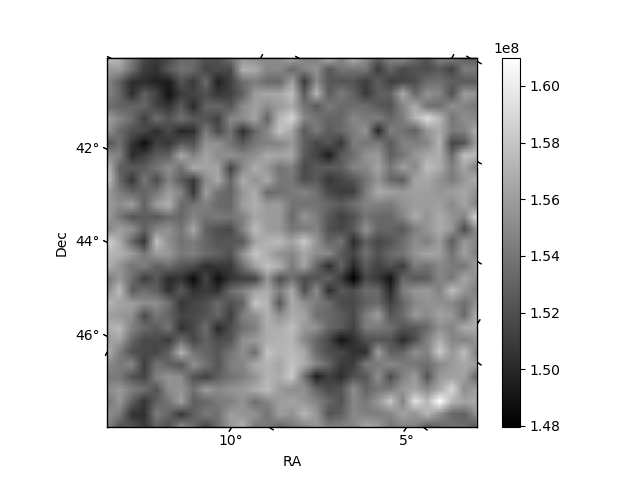
Histogram calculated using DETX and DETY for each event in the final _common_clean file
| Quadrant A | 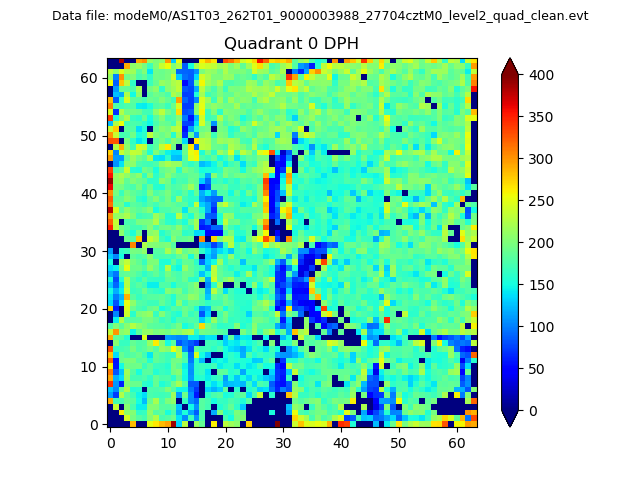 |
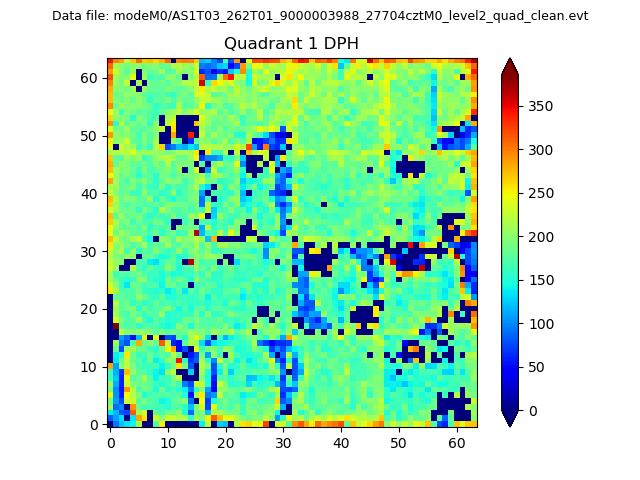 |
Quadrant B |
|---|---|---|---|
| Quadrant D |  |
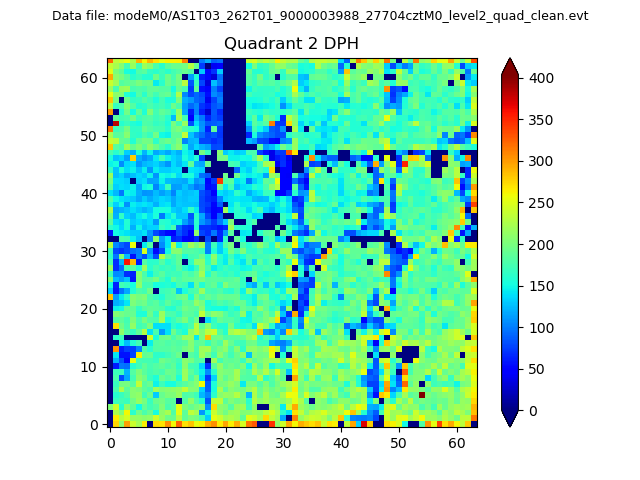 |
Quadrant C |
| Plot type | Count rate plots | Images |
|---|---|---|
| Comparison with Poisson distribution Blue bars denote a histogram of data divided into 1 sec bins. Red curve is a Poisson curve with rate = median count rate of data. |
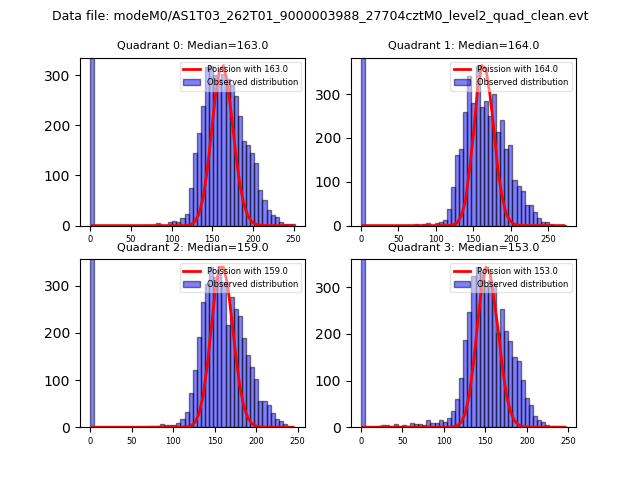 |
 |
| Quadrant-wise count rates Data is divided into 100 sec bins |
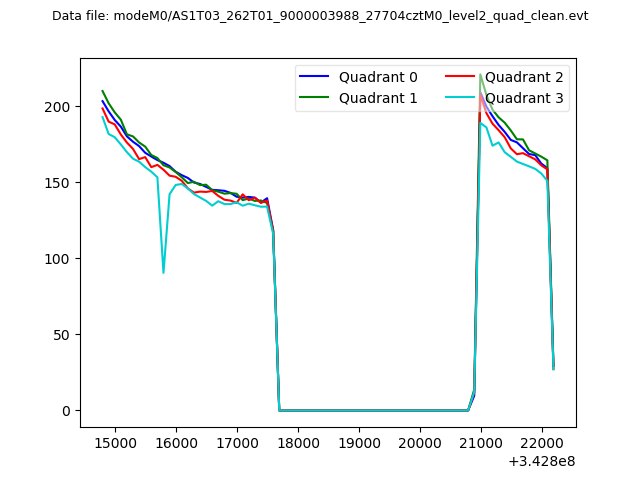 |
|
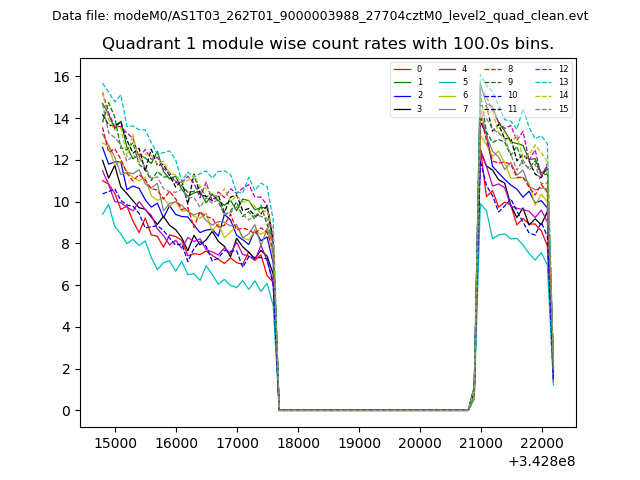
| Module-wise count rates for Quadrant A Data is divided into 100 sec bins |
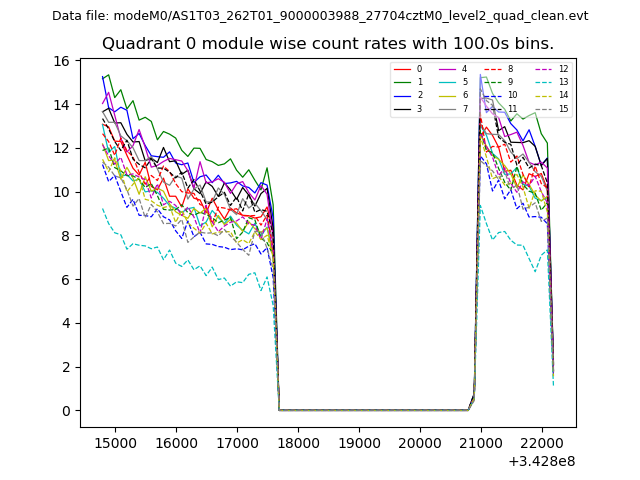 |
 |
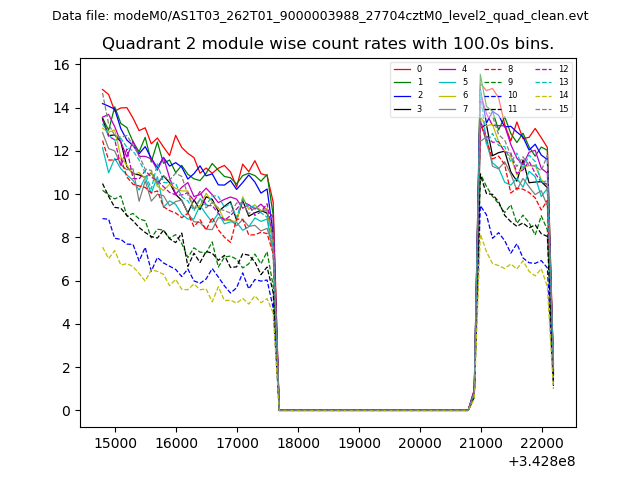
| Module-wise count rates for Quadrant B Data is divided into 100 sec bins |
 |
 |
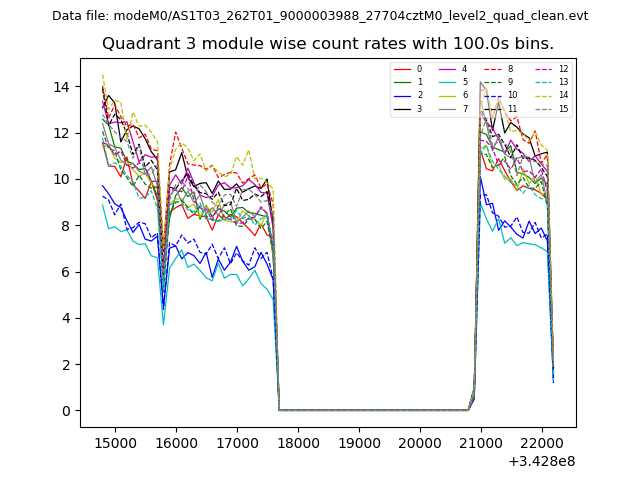
| Module-wise count rates for Quadrant C Data is divided into 100 sec bins |
 |
 |
| Module-wise count rates for Quadrant D Data is divided into 100 sec bins |
 |
 |
| Parameter | Plot |
|---|---|
| CZT HV Monitor | 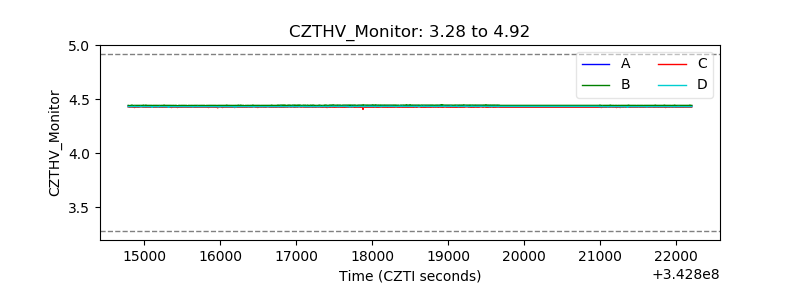 |
| D_VDD | 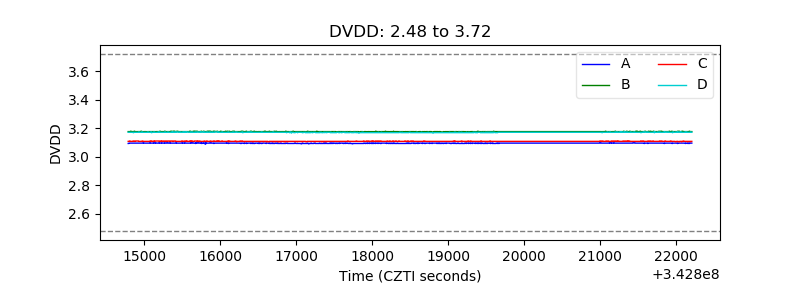 |
| Temperature 1 | 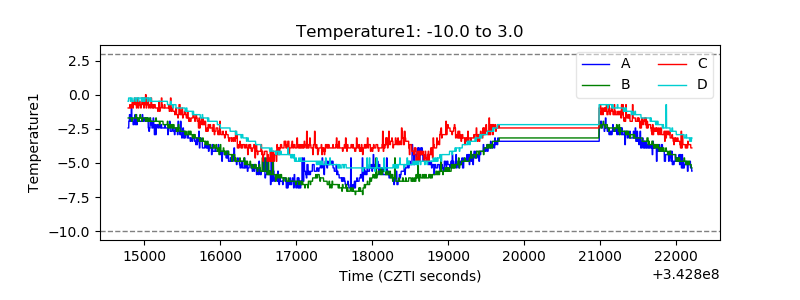 |
| Veto HV Monitor | 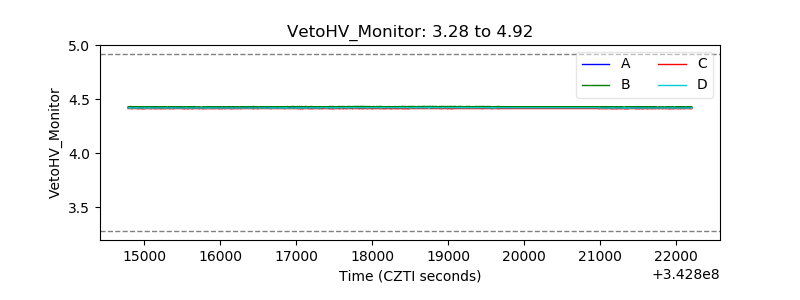 |
| Veto LLD | 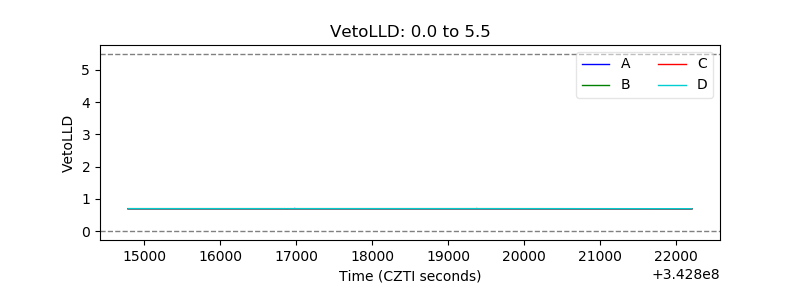 |
| Alpha Counter | 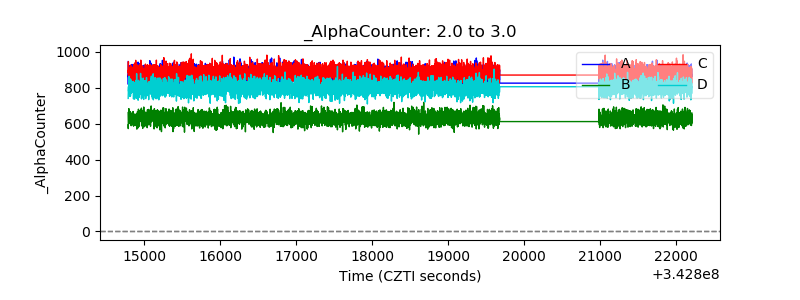 |
| _CPM_Rate | 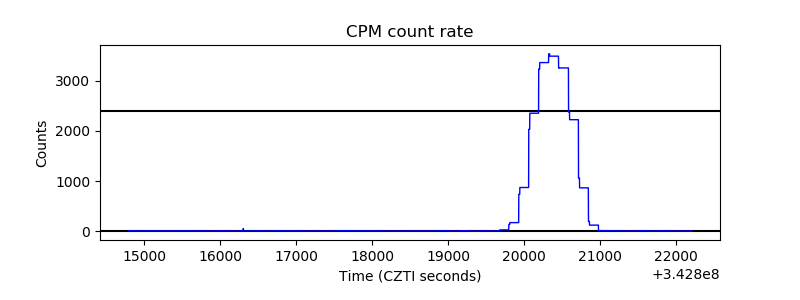 |
| CZT Counter | 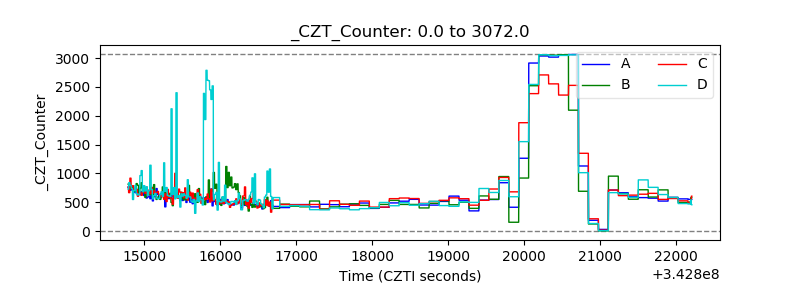 |
| +2.5 Volts monitor | 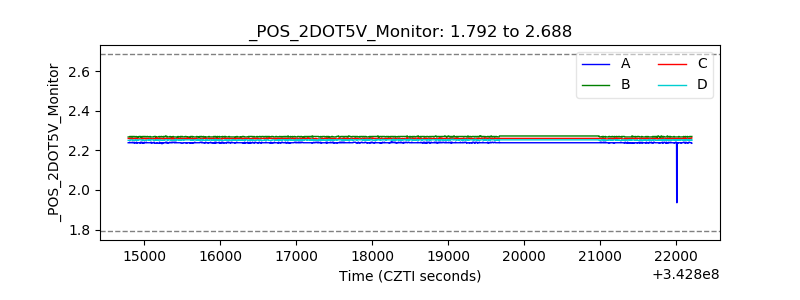 |
| +5 Volts monitor | 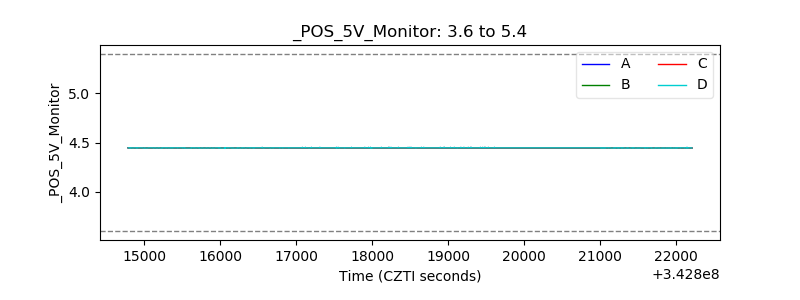 |
| _ROLL_ROT | 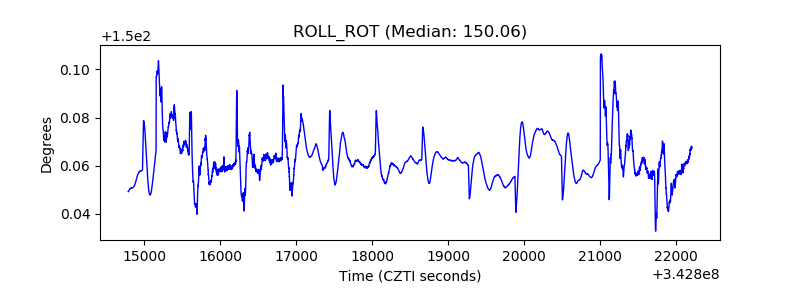 |
| _Roll_DEC | 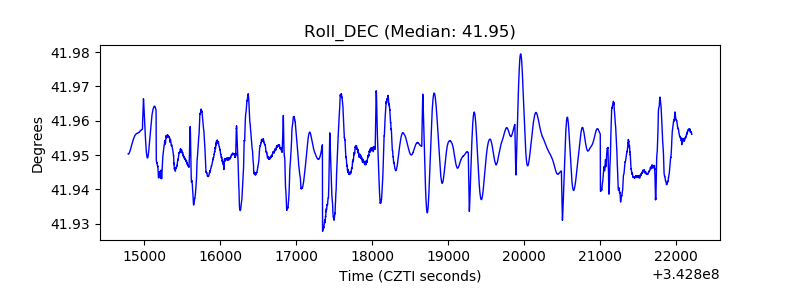 |
| _Roll_RA | 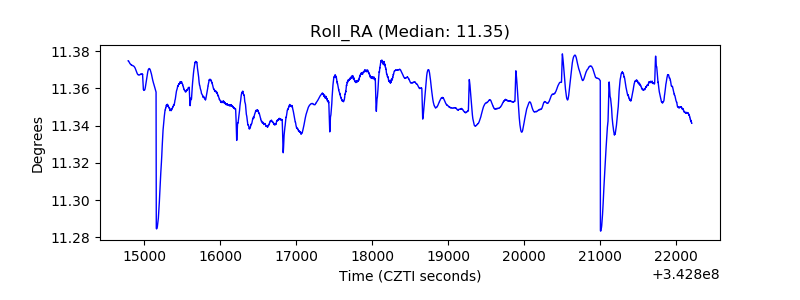 |
| Veto Counter | 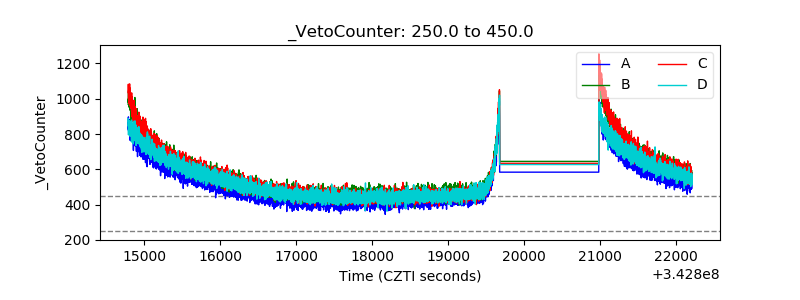 |