| Param | Original file | Final file |
|---|---|---|
| Filename | modeM0/AS1T03_262T01_9000003988_27705cztM0_level2.evt | modeM0/AS1T03_262T01_9000003988_27705cztM0_level2_quad_clean.evt |
| Size (bytes) | 459,377,280 | 100,984,320 |
| Size | 438.1 MB | 96.3 MB |
| Events in quadrant A | 3,158,603 | 667,610 |
| Events in quadrant B | 3,407,794 | 682,050 |
| Events in quadrant C | 3,365,996 | 654,376 |
| Events in quadrant D | 3,563,972 | 626,611 |
| Mode M0 | |||
|---|---|---|---|
| Quadrant | BADHDUFLAG | Total packets | Discarded packets |
| A | 0 | 13158 | 0 |
| B | 0 | 13960 | 0 |
| C | 0 | 13804 | 0 |
| D | 0 | 14684 | 0 |
| Mode M9 | |||
|---|---|---|---|
| Quadrant | BADHDUFLAG | Total packets | Discarded packets |
| A | 0 | 21 | 0 |
| B | 0 | 22 | 0 |
| C | 0 | 22 | 0 |
| D | 0 | 22 | 0 |
| Quadrant | Total seconds | Saturated seconds | Saturation percentage |
|---|---|---|---|
| A | 6129 | 36 | 0.587372% |
| B | 6128 | 48 | 0.783290% |
| C | 6128 | 95 | 1.550261% |
| D | 6128 | 96 | 1.566580% |
Noise dominated data is calculated using 1-second bins in cleaned event files. If a bin has >2000 counts, and if more than 50% of those come from <1% of pixels, then it is considered to be noise-dominated and hence unusable.
| Quadrant | # 1 sec bins | Bins with >0 counts | Bins with >2000 counts | High rate bins dominated by noise | Noise dominated (total time) | Noise dominated (detector-on time) | Marked lightcurve |
|---|---|---|---|---|---|---|---|
| A | 7519 | 6130 | 4 | 4 | 0.05% | 0.07% | 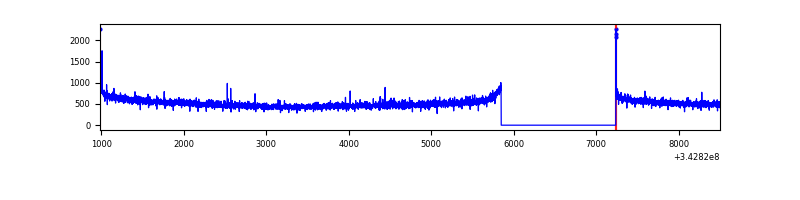 |
| B | 7518 | 6128 | 3 | 3 | 0.04% | 0.05% | 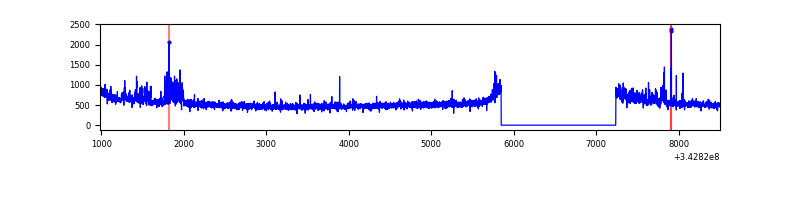 |
| C | 7518 | 6128 | 0 | 0 | 0.00% | 0.00% | 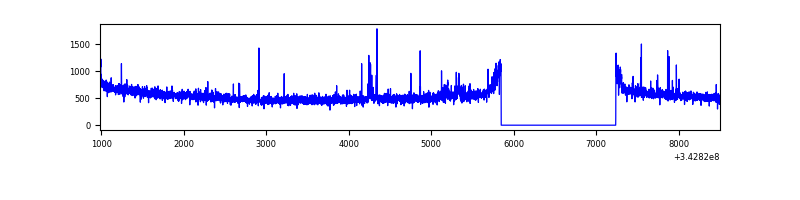 |
| D | 7518 | 6128 | 71 | 71 | 0.94% | 1.16% | 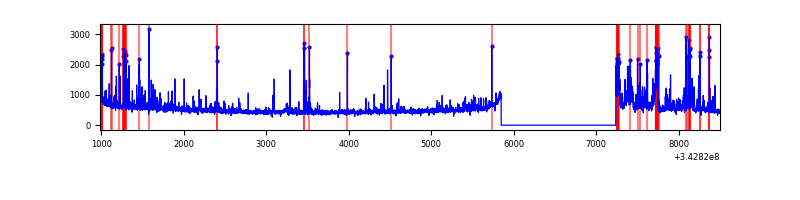 |
Top three noisy pixels from each quadrant. If the there are fewer than three noisy pixels in the level2.evt file, extra rows are filled as -1
| Pixel properties | Quadrant properties | ||||||
|---|---|---|---|---|---|---|---|
| Quadrant | DetID | PixID | Counts | Sigma | Mean | Median | Sigma |
| A | 8 | 192 | 14851 | 86.75 | 814 | 801 | 162.0 |
| A | 13 | 254 | 10368 | 59.07 | 814 | 801 | 162.0 |
| A | 3 | 137 | 7201 | 39.52 | 814 | 801 | 162.0 |
| B | 0 | 230 | 162473 | 1075.8 | 814 | 794 | 150.3 |
| B | 0 | 190 | 23534 | 151.31 | 814 | 794 | 150.3 |
| B | 12 | 111 | 17266 | 109.6 | 814 | 794 | 150.3 |
| C | 14 | 238 | 128130 | 697.11 | 795 | 803 | 182.6 |
| C | 3 | 233 | 90085 | 488.82 | 795 | 803 | 182.6 |
| C | 15 | 208 | 27533 | 146.35 | 795 | 803 | 182.6 |
| D | 1 | 52 | 227836 | 1230.33 | 787 | 769 | 184.6 |
| D | 11 | 176 | 149487 | 805.81 | 787 | 769 | 184.6 |
| D | 2 | 250 | 94359 | 507.11 | 787 | 769 | 184.6 |
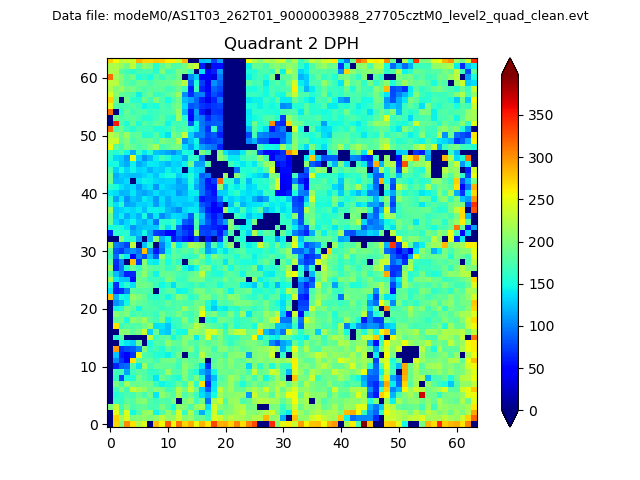
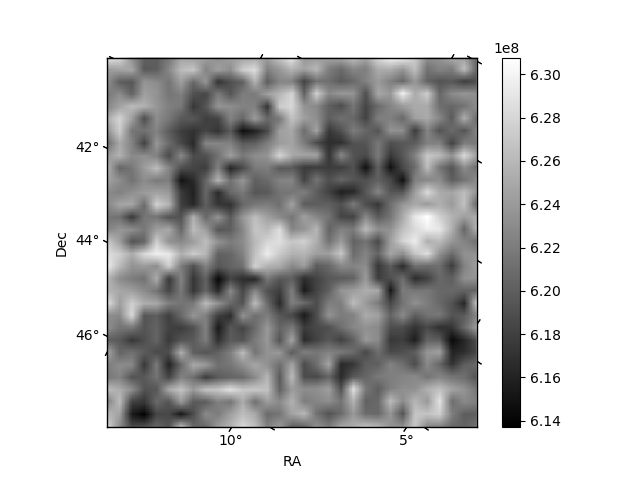
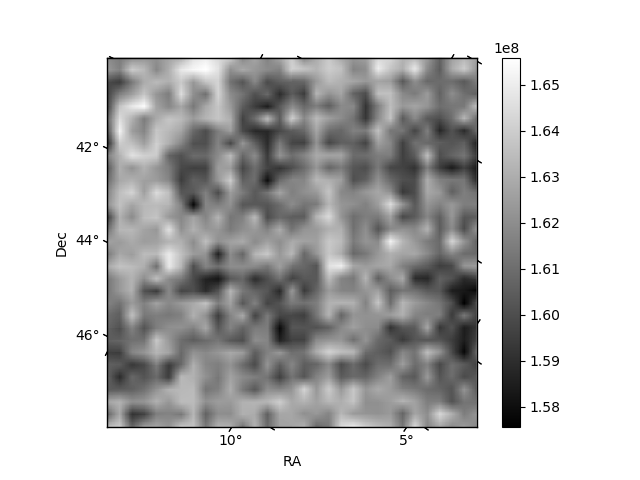
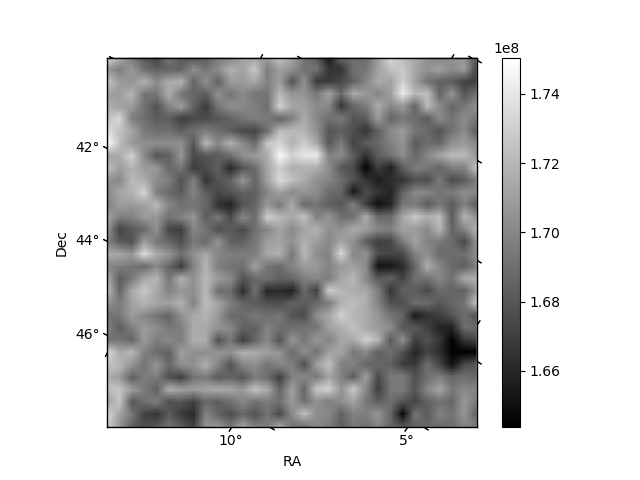
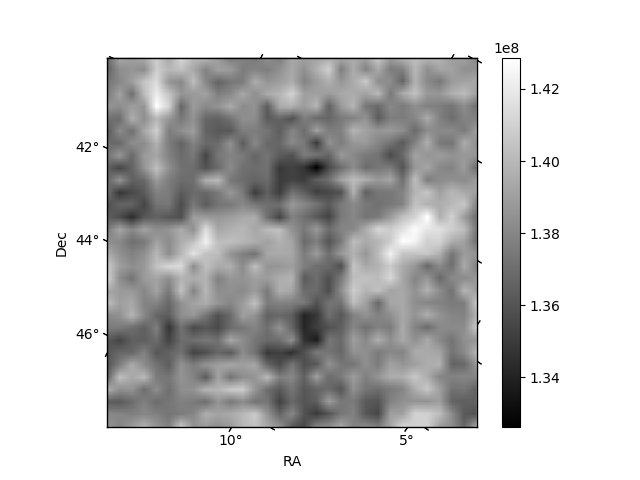
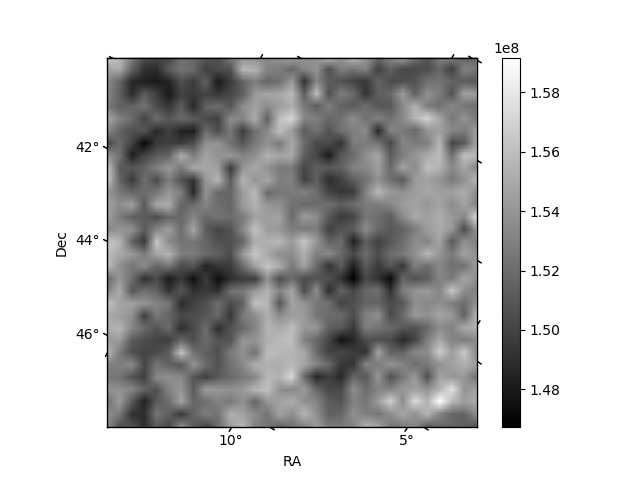
Histogram calculated using DETX and DETY for each event in the final _common_clean file
| Quadrant A | 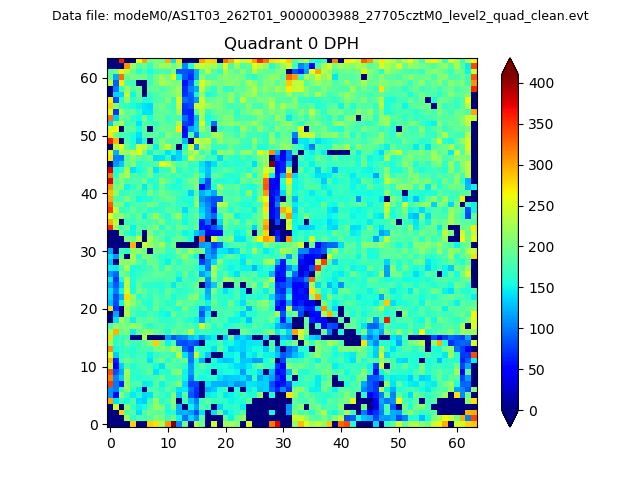 |
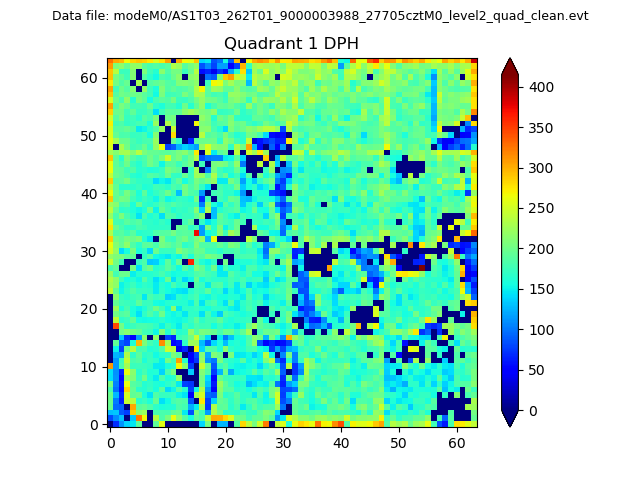 |
Quadrant B |
|---|---|---|---|
| Quadrant D | 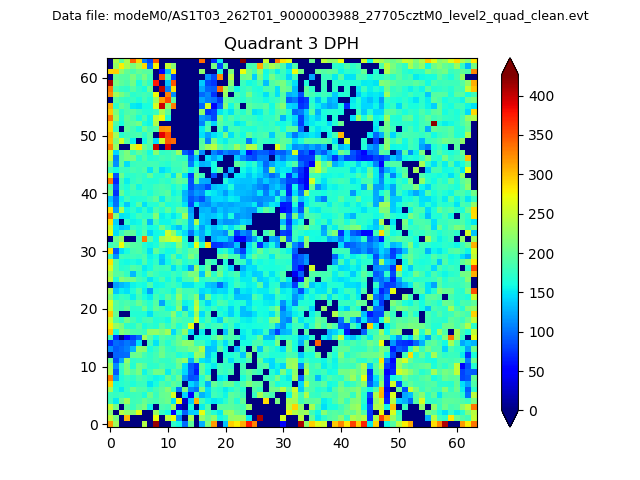 |
 |
Quadrant C |
| Plot type | Count rate plots | Images |
|---|---|---|
| Comparison with Poisson distribution Blue bars denote a histogram of data divided into 1 sec bins. Red curve is a Poisson curve with rate = median count rate of data. |
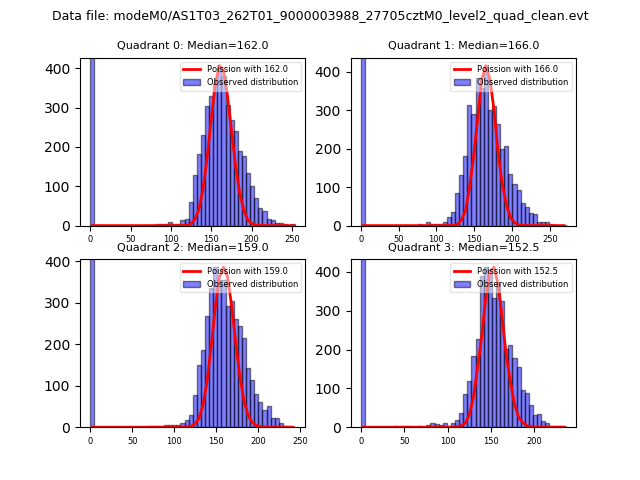 |
 |
| Quadrant-wise count rates Data is divided into 100 sec bins |
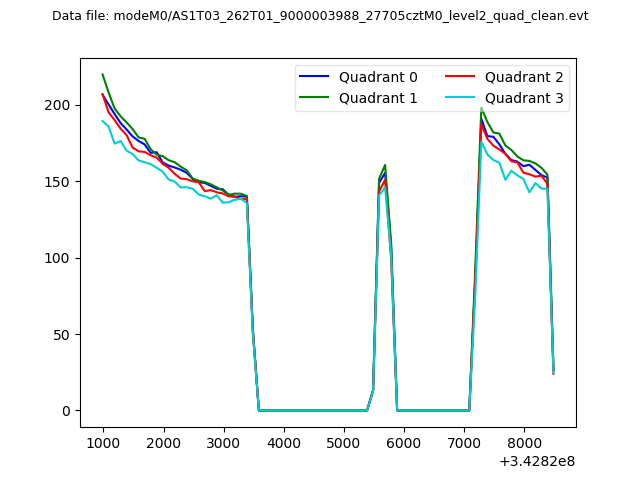 |
|
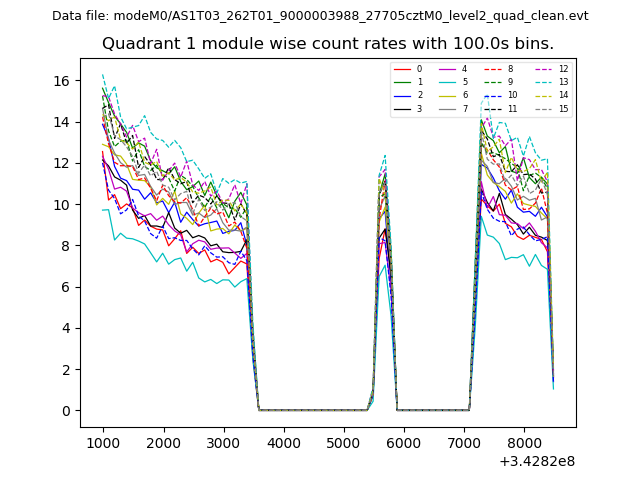
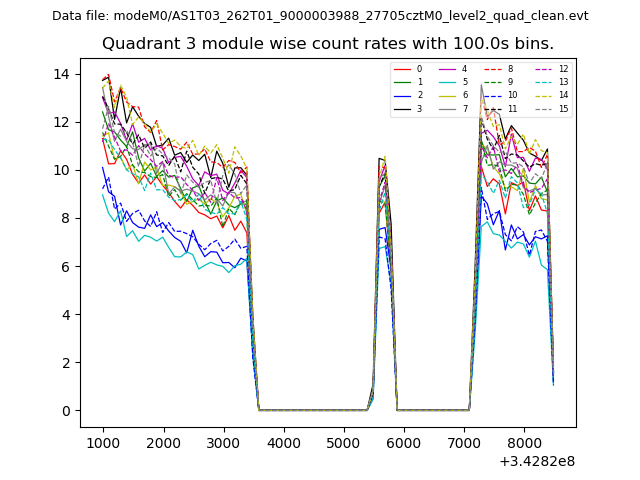
| Module-wise count rates for Quadrant A Data is divided into 100 sec bins |
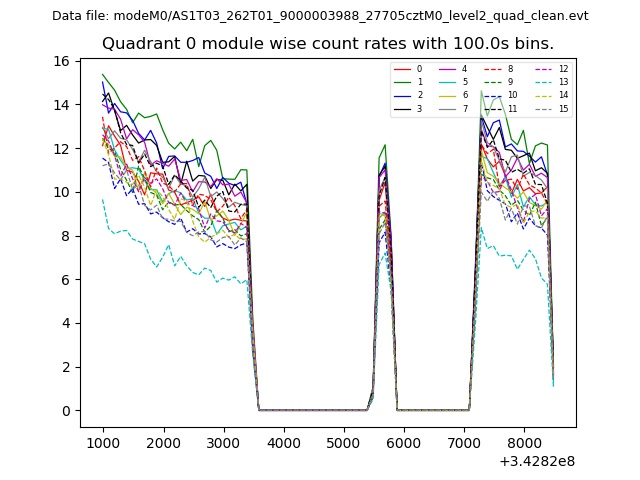 |
 |
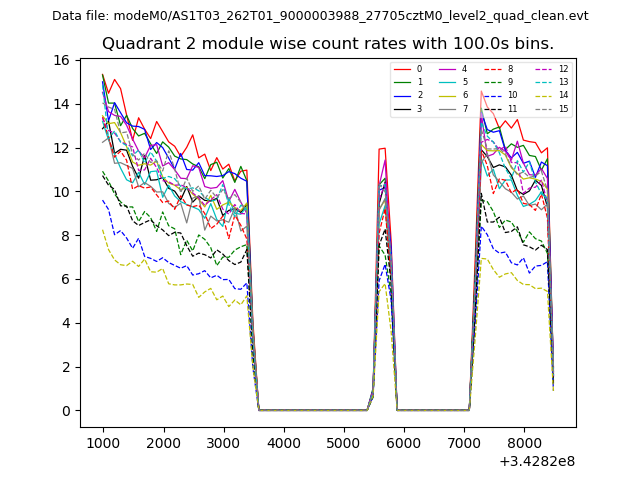
| Module-wise count rates for Quadrant B Data is divided into 100 sec bins |
 |
 |
| Module-wise count rates for Quadrant C Data is divided into 100 sec bins |
 |
 |
| Module-wise count rates for Quadrant D Data is divided into 100 sec bins |
 |
 |
| Parameter | Plot |
|---|---|
| CZT HV Monitor | 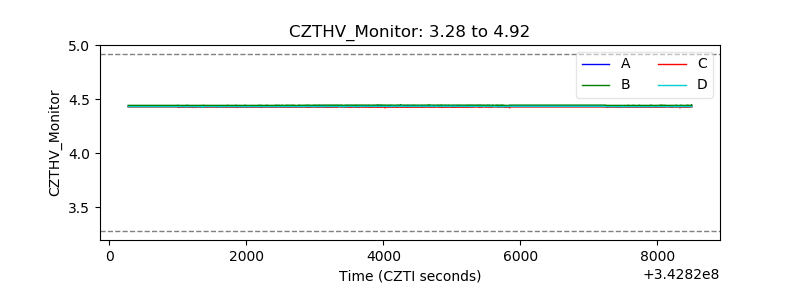 |
| D_VDD | 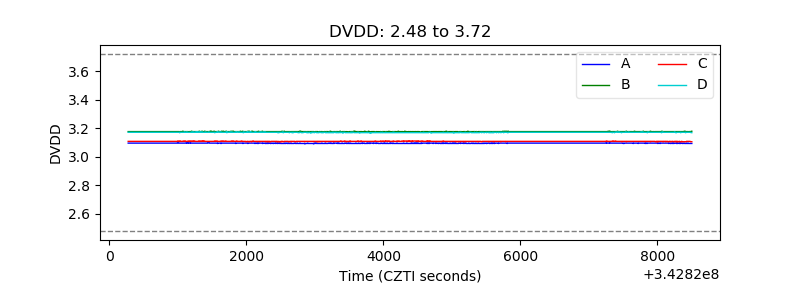 |
| Temperature 1 | 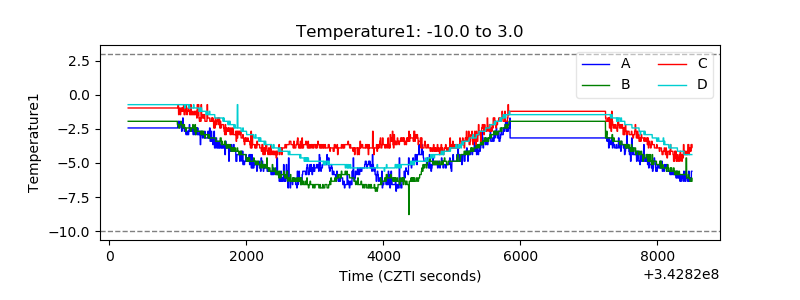 |
| Veto HV Monitor | 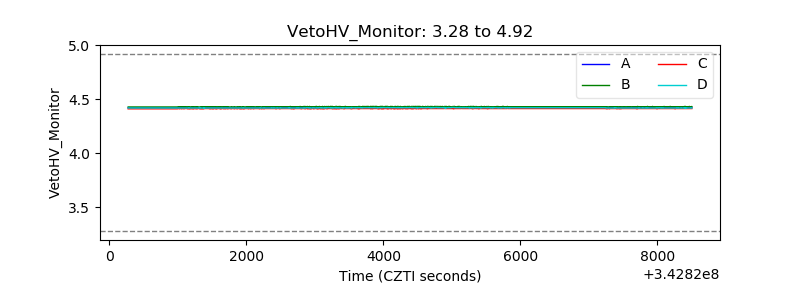 |
| Veto LLD | 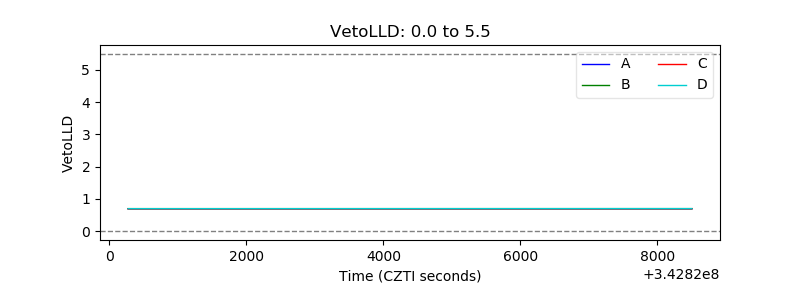 |
| Alpha Counter | 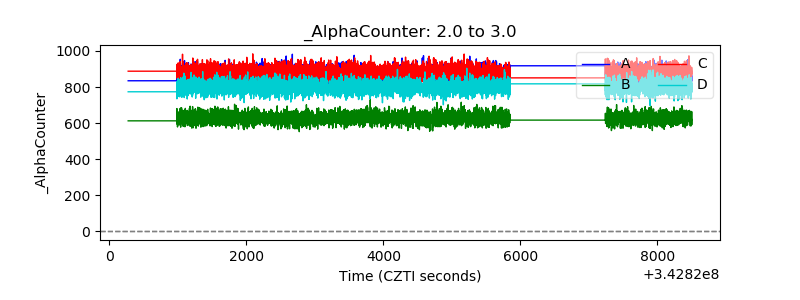 |
| _CPM_Rate | 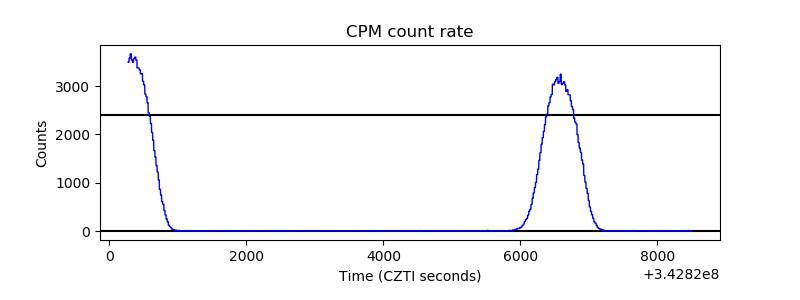 |
| CZT Counter | 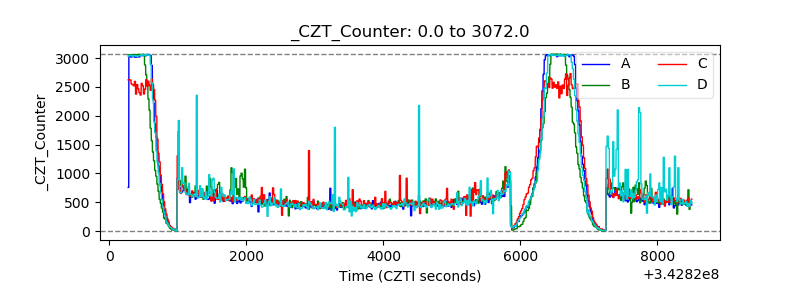 |
| +2.5 Volts monitor |  |
| +5 Volts monitor | 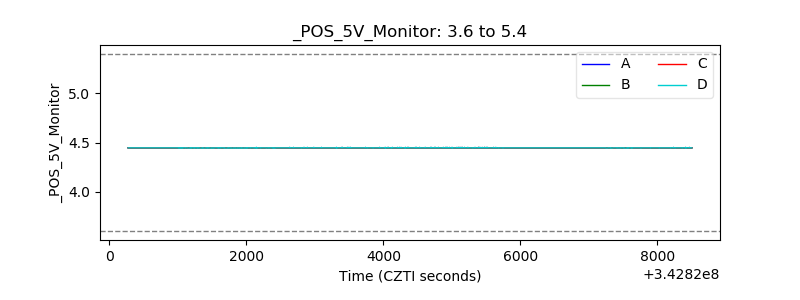 |
| _ROLL_ROT | 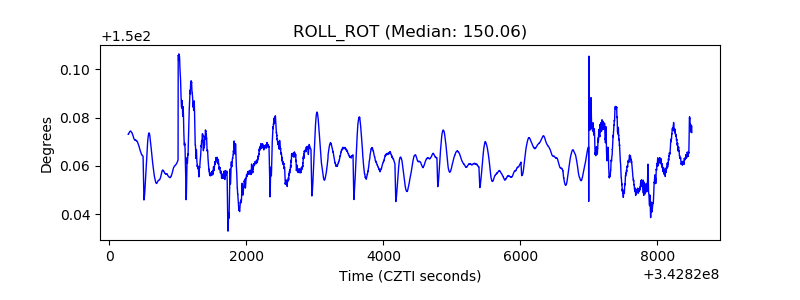 |
| _Roll_DEC | 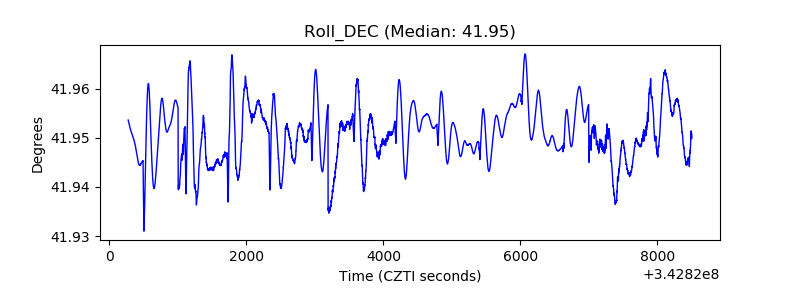 |
| _Roll_RA | 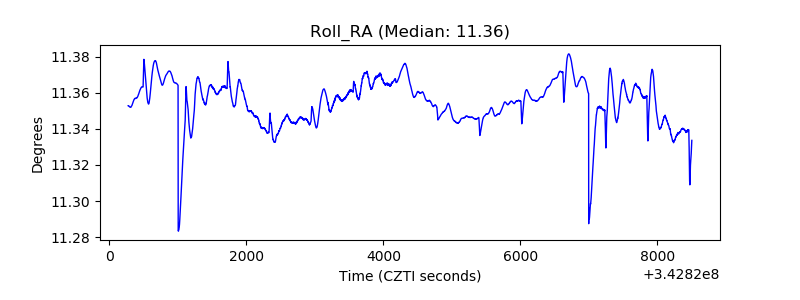 |
| Veto Counter | 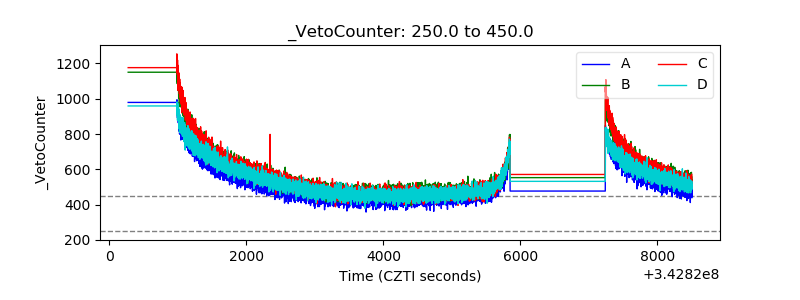 |