| Param | Original file | Final file |
|---|---|---|
| Filename | modeM0/AS1T03_262T01_9000003988_27706cztM0_level2.evt | modeM0/AS1T03_262T01_9000003988_27706cztM0_level2_quad_clean.evt |
| Size (bytes) | 459,774,720 | 97,796,160 |
| Size | 438.5 MB | 93.3 MB |
| Events in quadrant A | 3,102,880 | 641,825 |
| Events in quadrant B | 3,293,505 | 657,703 |
| Events in quadrant C | 3,304,205 | 630,059 |
| Events in quadrant D | 3,801,605 | 598,335 |
| Mode M0 | |||
|---|---|---|---|
| Quadrant | BADHDUFLAG | Total packets | Discarded packets |
| A | 0 | 13053 | 0 |
| B | 0 | 13661 | 0 |
| C | 0 | 13619 | 0 |
| D | 0 | 15484 | 0 |
| Mode M9 | |||
|---|---|---|---|
| Quadrant | BADHDUFLAG | Total packets | Discarded packets |
| A | 0 | 17 | 0 |
| B | 0 | 18 | 0 |
| C | 0 | 18 | 0 |
| D | 0 | 18 | 0 |
| Quadrant | Total seconds | Saturated seconds | Saturation percentage |
|---|---|---|---|
| A | 6216 | 43 | 0.691763% |
| B | 6216 | 62 | 0.997426% |
| C | 6216 | 94 | 1.512227% |
| D | 6216 | 155 | 2.493565% |
Noise dominated data is calculated using 1-second bins in cleaned event files. If a bin has >2000 counts, and if more than 50% of those come from <1% of pixels, then it is considered to be noise-dominated and hence unusable.
| Quadrant | # 1 sec bins | Bins with >0 counts | Bins with >2000 counts | High rate bins dominated by noise | Noise dominated (total time) | Noise dominated (detector-on time) | Marked lightcurve |
|---|---|---|---|---|---|---|---|
| A | 7521 | 6216 | 6 | 6 | 0.08% | 0.10% | 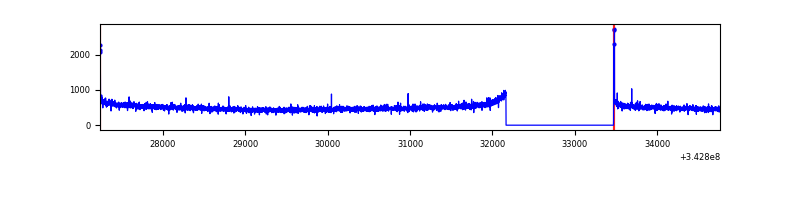 |
| B | 7521 | 6216 | 4 | 4 | 0.05% | 0.06% | 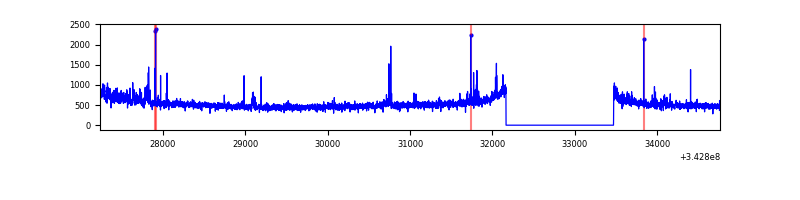 |
| C | 7521 | 6217 | 0 | 0 | 0.00% | 0.00% | 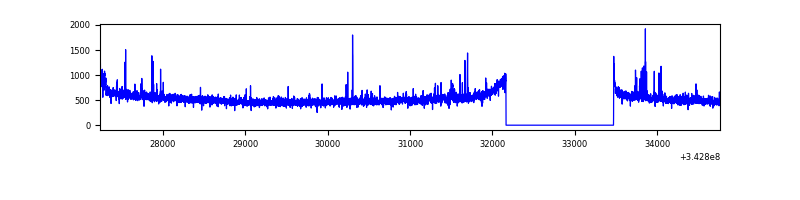 |
| D | 7521 | 6217 | 98 | 98 | 1.30% | 1.58% | 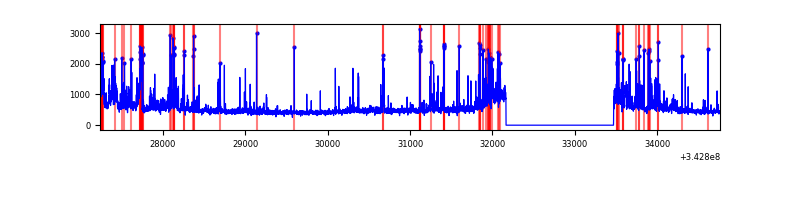 |
Top three noisy pixels from each quadrant. If the there are fewer than three noisy pixels in the level2.evt file, extra rows are filled as -1
| Pixel properties | Quadrant properties | ||||||
|---|---|---|---|---|---|---|---|
| Quadrant | DetID | PixID | Counts | Sigma | Mean | Median | Sigma |
| A | 8 | 192 | 15354 | 91.58 | 799 | 784 | 159.1 |
| A | 13 | 254 | 10673 | 62.16 | 799 | 784 | 159.1 |
| A | 3 | 137 | 7115 | 39.79 | 799 | 784 | 159.1 |
| B | 0 | 230 | 77378 | 515.81 | 802 | 785 | 148.5 |
| B | 0 | 190 | 19574 | 126.53 | 802 | 785 | 148.5 |
| B | 12 | 111 | 17649 | 113.57 | 802 | 785 | 148.5 |
| C | 14 | 238 | 126002 | 689.13 | 783 | 790 | 181.7 |
| C | 3 | 233 | 72905 | 396.9 | 783 | 790 | 181.7 |
| C | 15 | 208 | 38371 | 206.83 | 783 | 790 | 181.7 |
| D | 1 | 52 | 460908 | 2569.09 | 768 | 750 | 179.1 |
| D | 11 | 176 | 277548 | 1545.38 | 768 | 750 | 179.1 |
| D | 2 | 250 | 112569 | 624.29 | 768 | 750 | 179.1 |
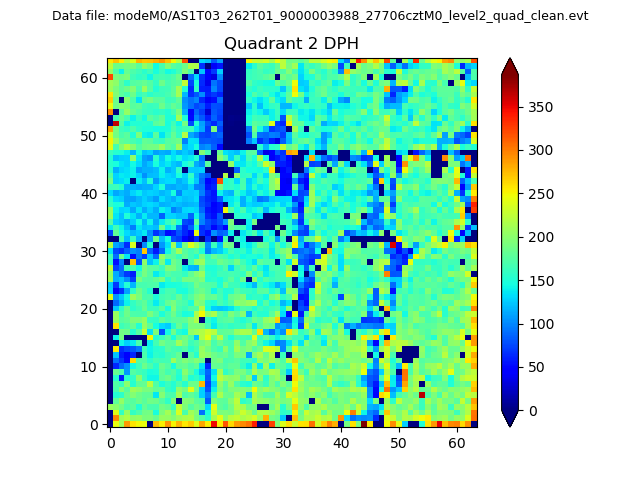
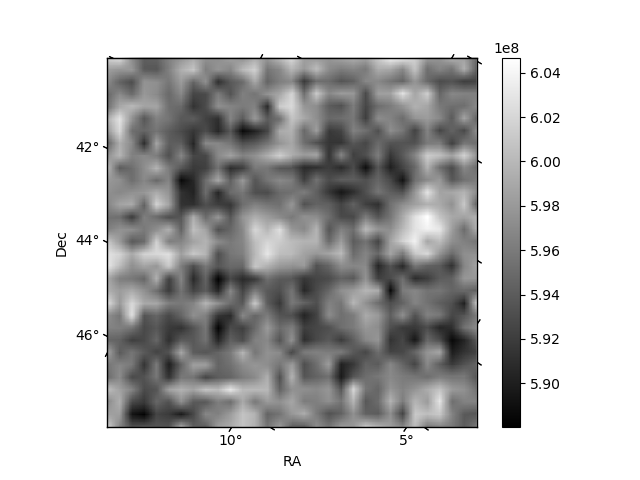
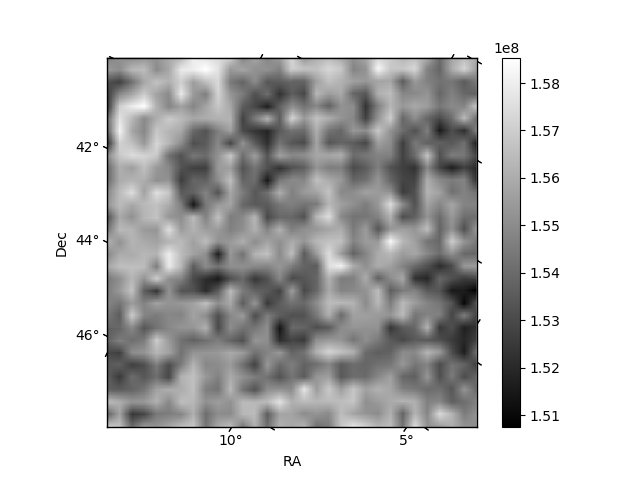
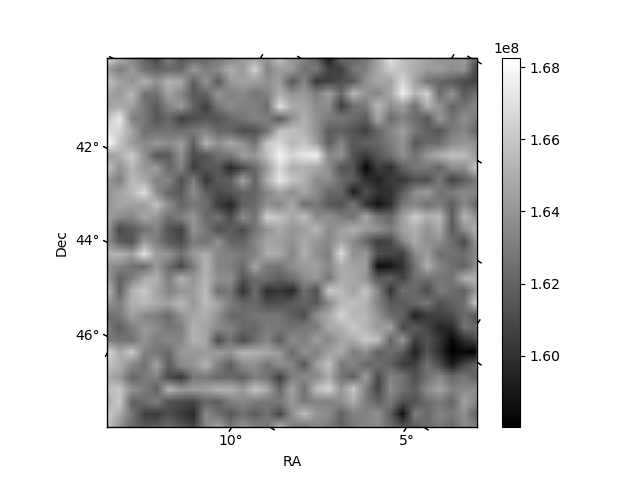
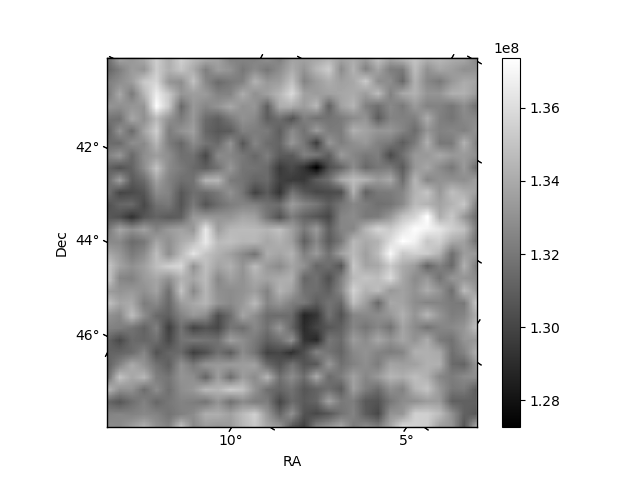
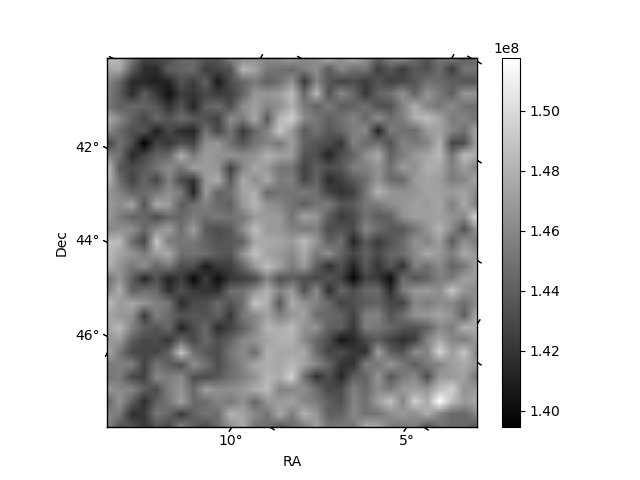
Histogram calculated using DETX and DETY for each event in the final _common_clean file
| Quadrant A | 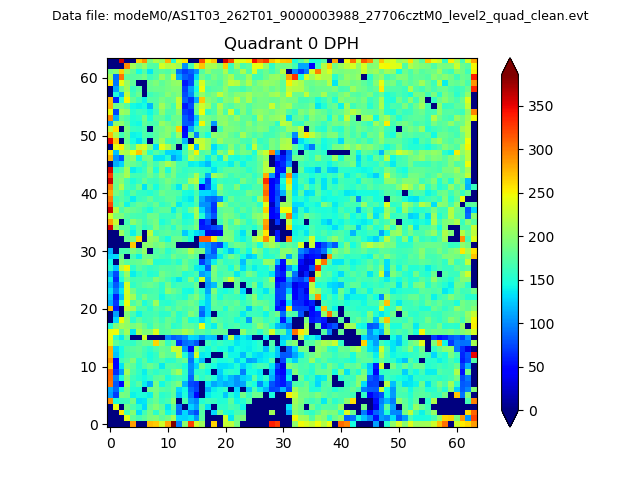 |
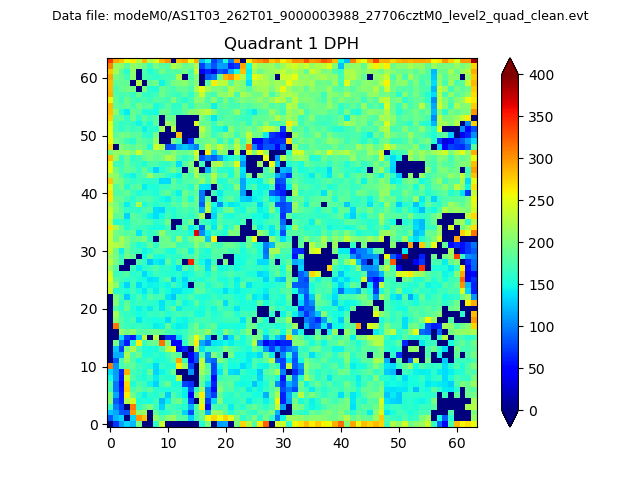 |
Quadrant B |
|---|---|---|---|
| Quadrant D | 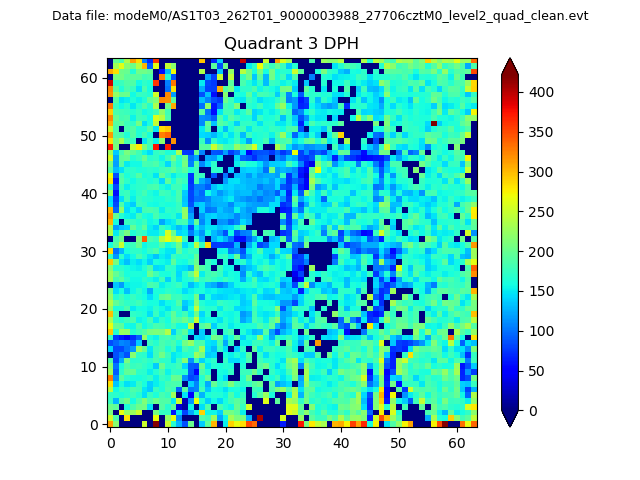 |
 |
Quadrant C |
| Plot type | Count rate plots | Images |
|---|---|---|
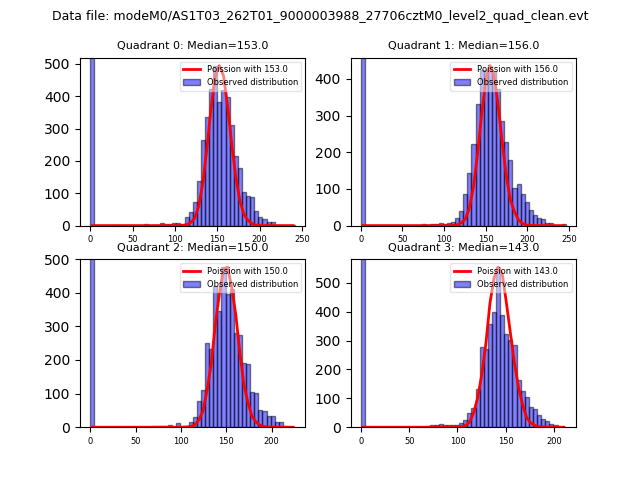
| Comparison with Poisson distribution Blue bars denote a histogram of data divided into 1 sec bins. Red curve is a Poisson curve with rate = median count rate of data. |
 |
 |
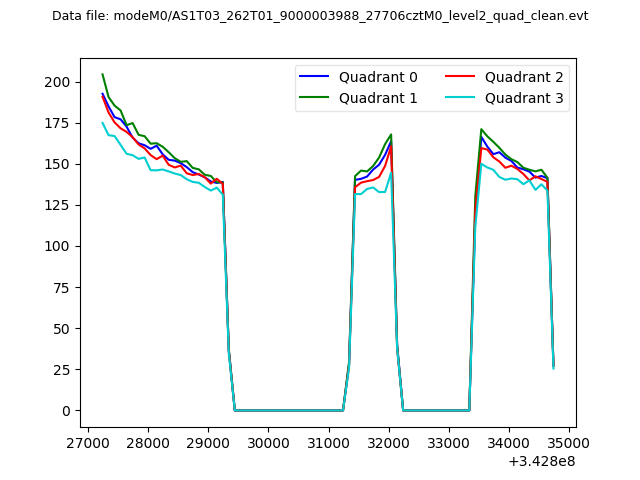
| Quadrant-wise count rates Data is divided into 100 sec bins |
 |
|
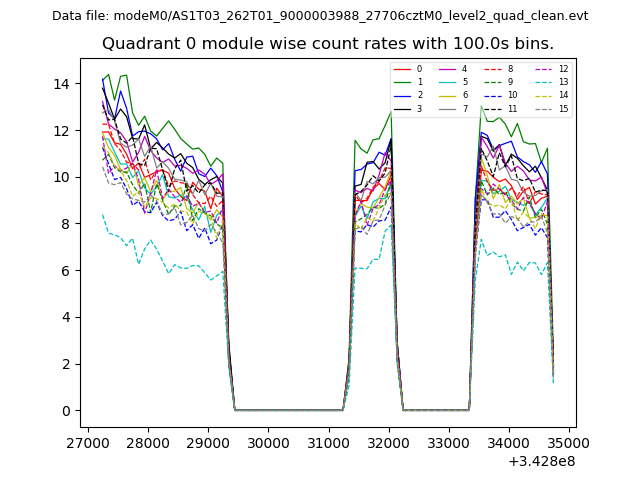
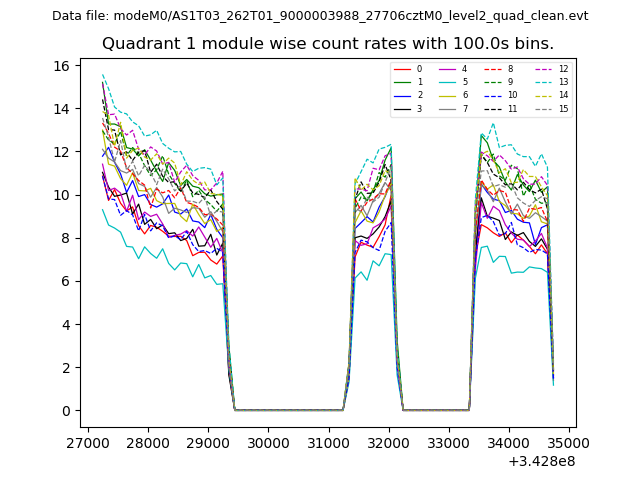
| Module-wise count rates for Quadrant A Data is divided into 100 sec bins |
 |
 |
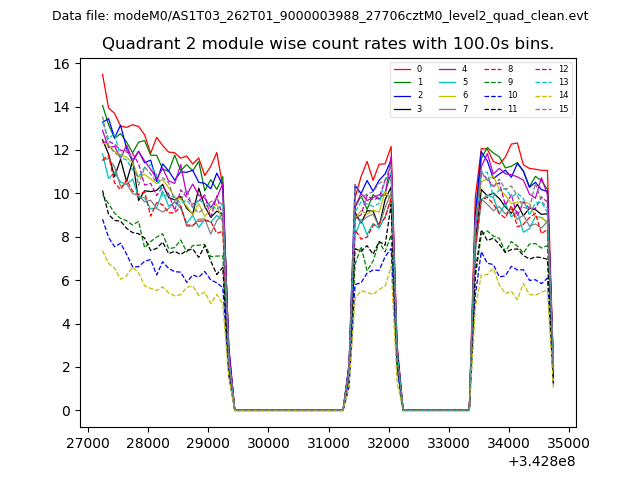
| Module-wise count rates for Quadrant B Data is divided into 100 sec bins |
 |
 |
| Module-wise count rates for Quadrant C Data is divided into 100 sec bins |
 |
 |
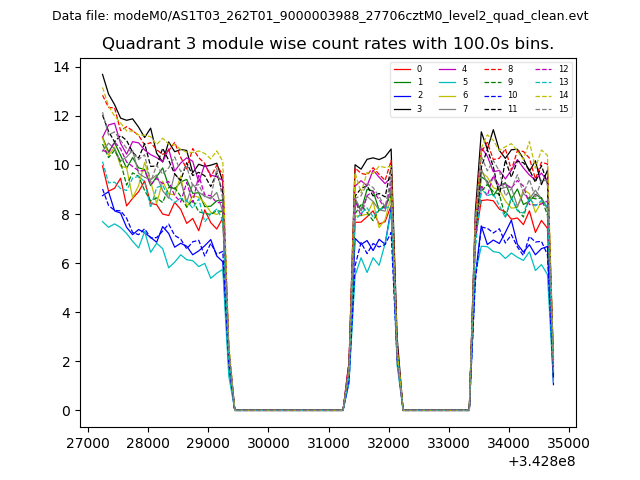
| Module-wise count rates for Quadrant D Data is divided into 100 sec bins |
 |
 |
| Parameter | Plot |
|---|---|
| CZT HV Monitor | 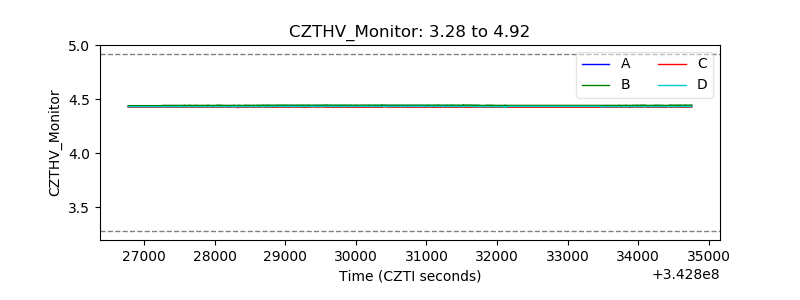 |
| D_VDD | 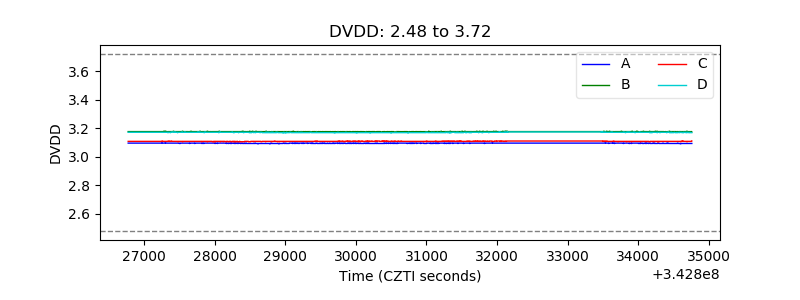 |
| Temperature 1 | 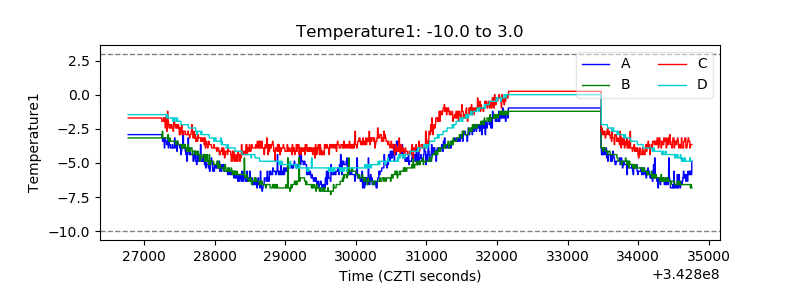 |
| Veto HV Monitor | 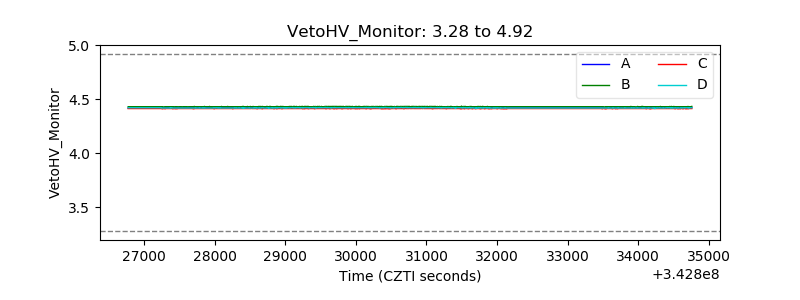 |
| Veto LLD | 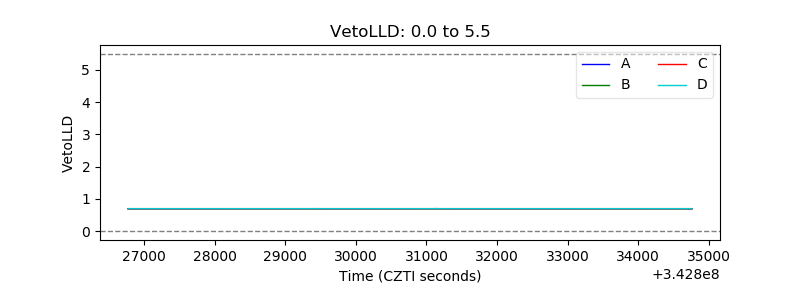 |
| Alpha Counter | 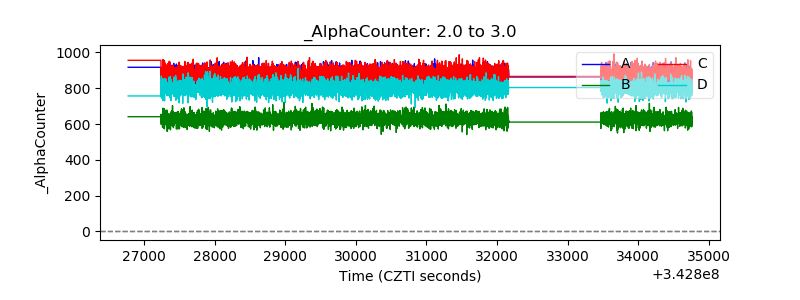 |
| _CPM_Rate |  |
| CZT Counter | 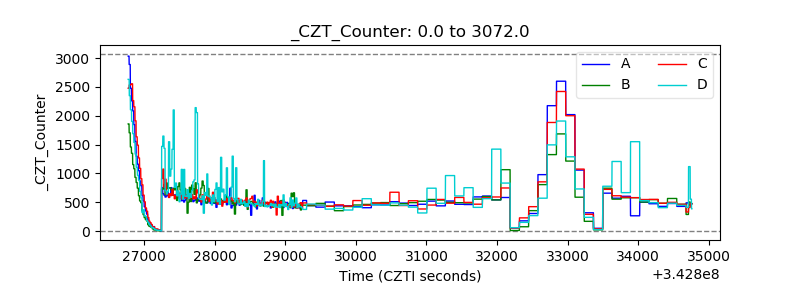 |
| +2.5 Volts monitor |  |
| +5 Volts monitor |  |
| _ROLL_ROT |  |
| _Roll_DEC | 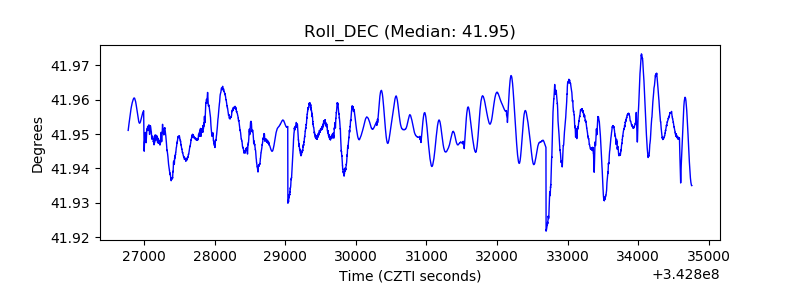 |
| _Roll_RA | 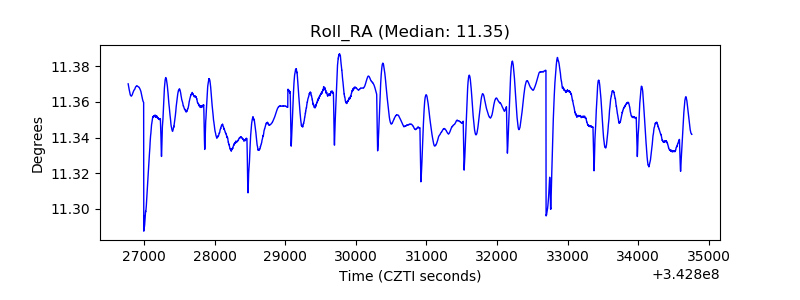 |
| Veto Counter | 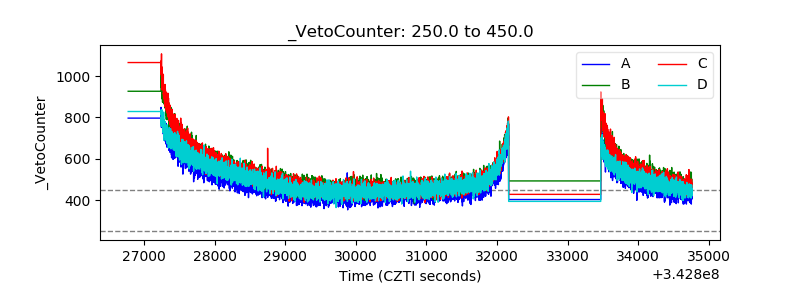 |