| Param | Original file | Final file |
|---|---|---|
| Filename | modeM0/AS1T03_262T01_9000003988_27707cztM0_level2.evt | modeM0/AS1T03_262T01_9000003988_27707cztM0_level2_quad_clean.evt |
| Size (bytes) | 456,353,280 | 98,219,520 |
| Size | 435.2 MB | 93.7 MB |
| Events in quadrant A | 3,159,631 | 639,355 |
| Events in quadrant B | 3,529,786 | 648,664 |
| Events in quadrant C | 3,350,699 | 624,043 |
| Events in quadrant D | 3,333,028 | 603,267 |
| Mode M0 | |||
|---|---|---|---|
| Quadrant | BADHDUFLAG | Total packets | Discarded packets |
| A | 0 | 13610 | 0 |
| B | 0 | 14677 | 0 |
| C | 0 | 13968 | 0 |
| D | 0 | 14488 | 0 |
| Mode M9 | |||
|---|---|---|---|
| Quadrant | BADHDUFLAG | Total packets | Discarded packets |
| A | 0 | 18 | 0 |
| B | 0 | 19 | 0 |
| C | 0 | 19 | 0 |
| D | 0 | 19 | 0 |
| Quadrant | Total seconds | Saturated seconds | Saturation percentage |
|---|---|---|---|
| A | 6586 | 28 | 0.425144% |
| B | 6586 | 92 | 1.396903% |
| C | 6586 | 79 | 1.199514% |
| D | 6586 | 45 | 0.683268% |
Noise dominated data is calculated using 1-second bins in cleaned event files. If a bin has >2000 counts, and if more than 50% of those come from <1% of pixels, then it is considered to be noise-dominated and hence unusable.
| Quadrant | # 1 sec bins | Bins with >0 counts | Bins with >2000 counts | High rate bins dominated by noise | Noise dominated (total time) | Noise dominated (detector-on time) | Marked lightcurve |
|---|---|---|---|---|---|---|---|
| A | 7651 | 6586 | 3 | 3 | 0.04% | 0.05% | 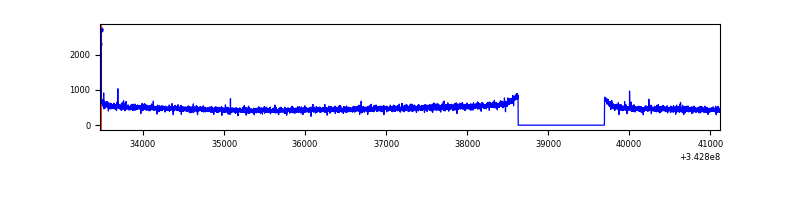 |
| B | 7651 | 6587 | 5 | 5 | 0.07% | 0.08% | 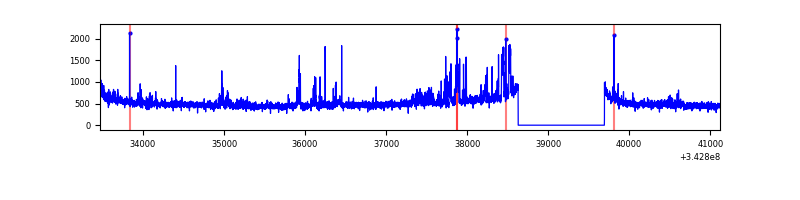 |
| C | 7651 | 6586 | 0 | 0 | 0.00% | 0.00% | 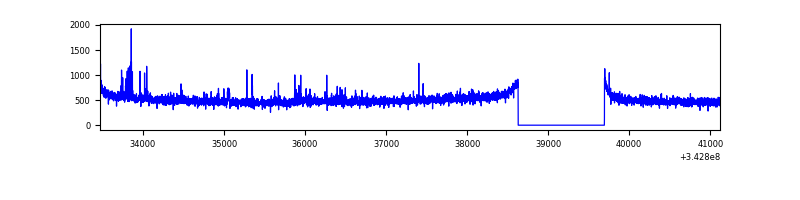 |
| D | 7651 | 6587 | 27 | 27 | 0.35% | 0.41% | 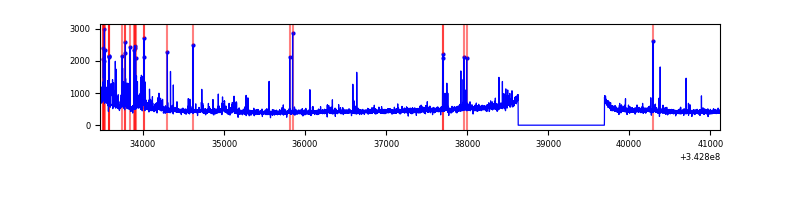 |
Top three noisy pixels from each quadrant. If the there are fewer than three noisy pixels in the level2.evt file, extra rows are filled as -1
| Pixel properties | Quadrant properties | ||||||
|---|---|---|---|---|---|---|---|
| Quadrant | DetID | PixID | Counts | Sigma | Mean | Median | Sigma |
| A | 13 | 254 | 11168 | 64.08 | 815 | 799 | 161.8 |
| A | 8 | 192 | 8394 | 46.94 | 815 | 799 | 161.8 |
| A | 3 | 137 | 7668 | 42.45 | 815 | 799 | 161.8 |
| B | 3 | 112 | 220100 | 1422.59 | 816 | 793 | 154.2 |
| B | 0 | 230 | 57395 | 367.16 | 816 | 793 | 154.2 |
| B | 0 | 190 | 27894 | 175.8 | 816 | 793 | 154.2 |
| C | 14 | 238 | 126630 | 682.45 | 793 | 800 | 184.4 |
| C | 3 | 233 | 106329 | 572.35 | 793 | 800 | 184.4 |
| C | 15 | 208 | 23287 | 121.96 | 793 | 800 | 184.4 |
| D | 1 | 52 | 142650 | 770.28 | 786 | 768 | 184.2 |
| D | 11 | 176 | 114622 | 618.12 | 786 | 768 | 184.2 |
| D | 2 | 250 | 62515 | 335.23 | 786 | 768 | 184.2 |
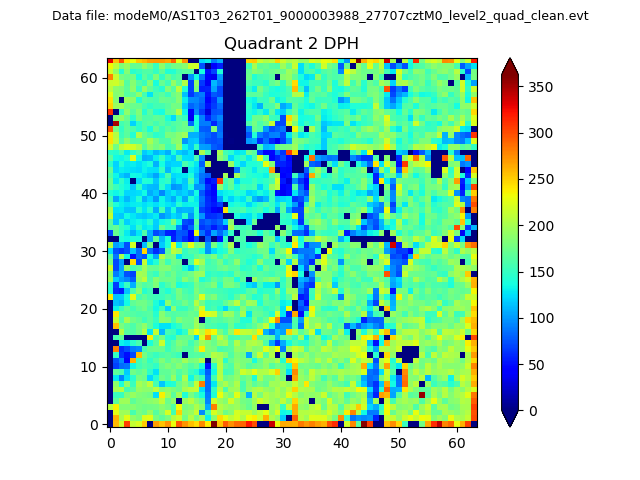
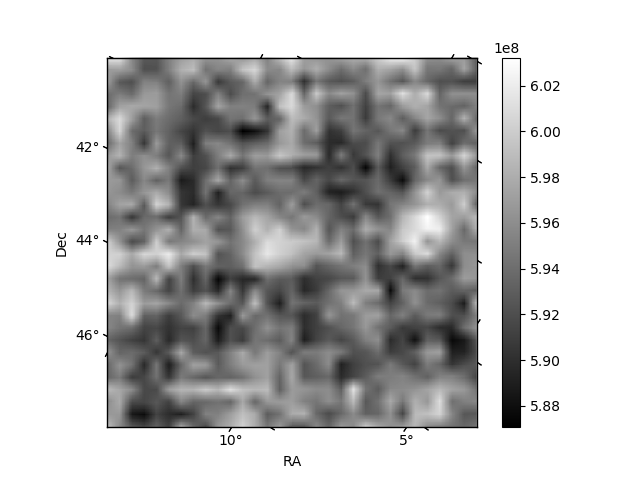
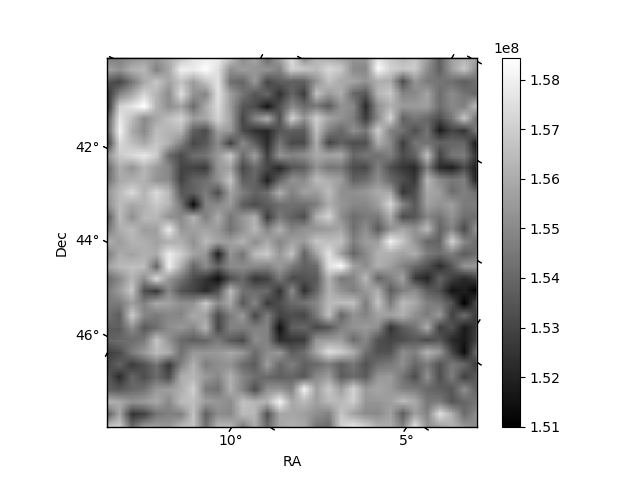
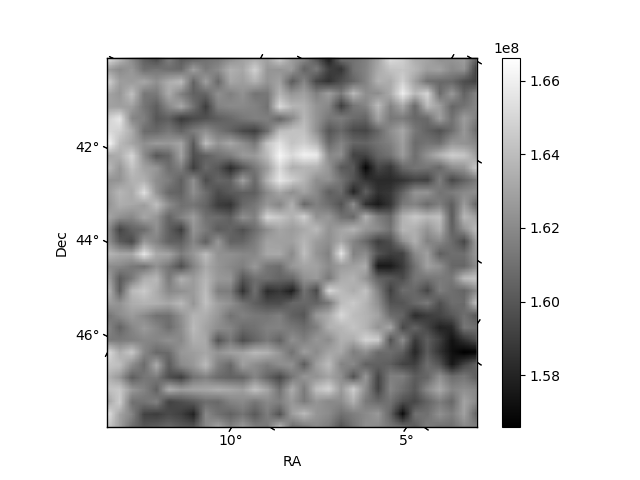
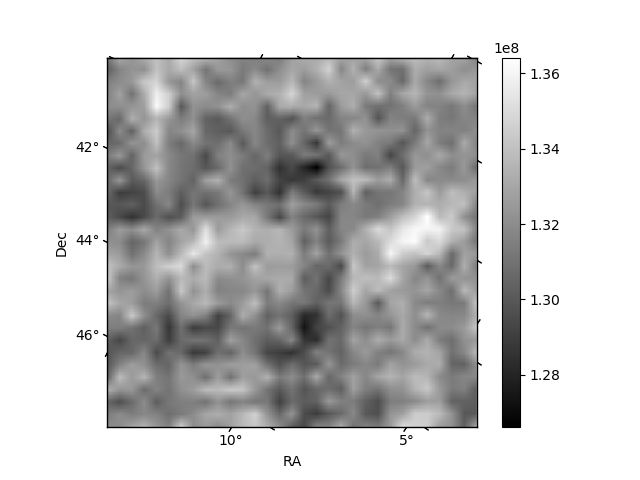
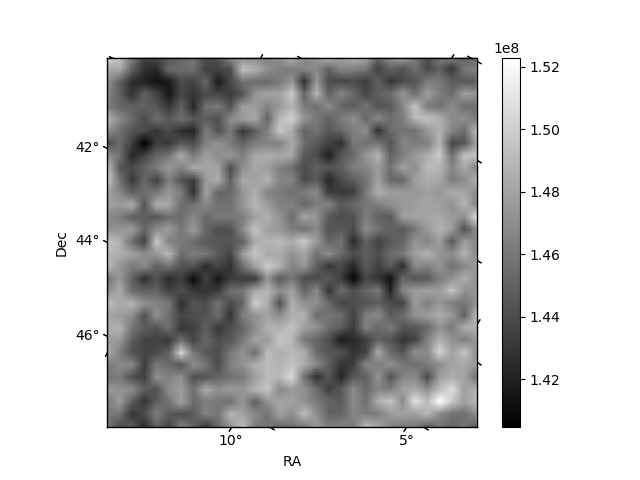
Histogram calculated using DETX and DETY for each event in the final _common_clean file
| Quadrant A | 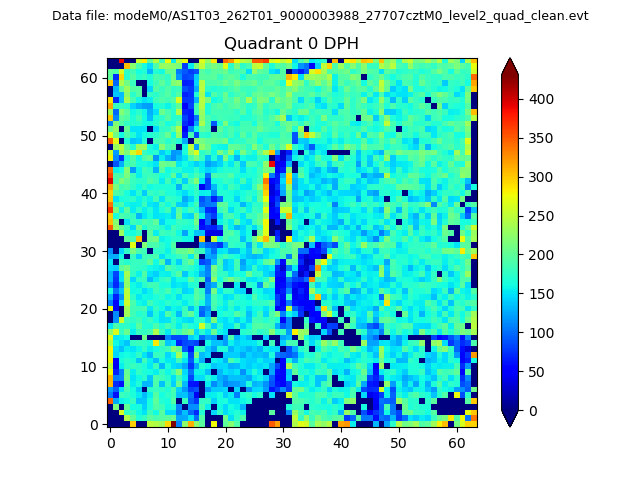 |
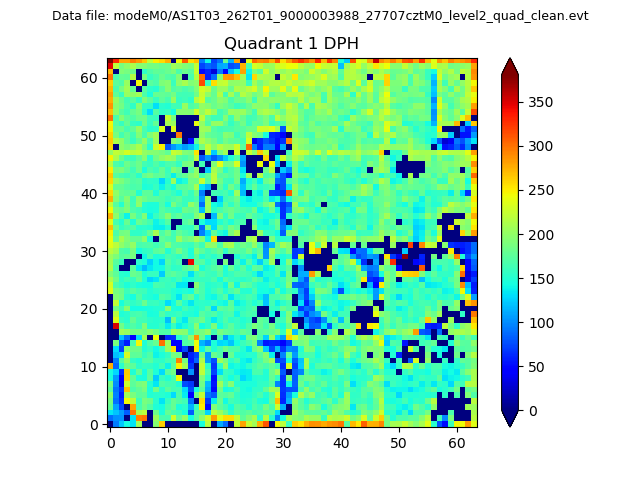 |
Quadrant B |
|---|---|---|---|
| Quadrant D | 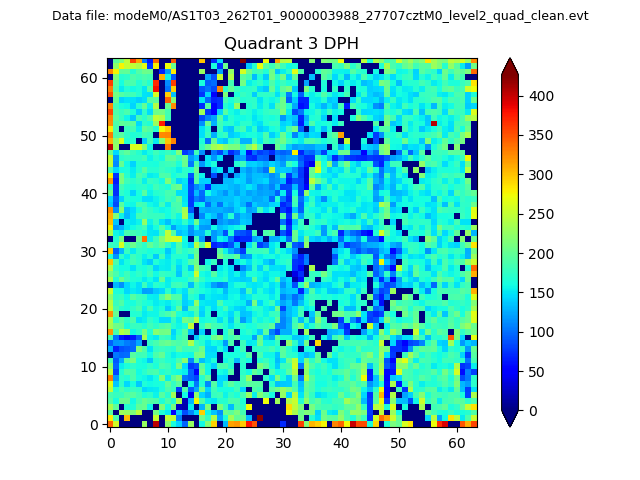 |
 |
Quadrant C |
| Plot type | Count rate plots | Images |
|---|---|---|
| Comparison with Poisson distribution Blue bars denote a histogram of data divided into 1 sec bins. Red curve is a Poisson curve with rate = median count rate of data. |
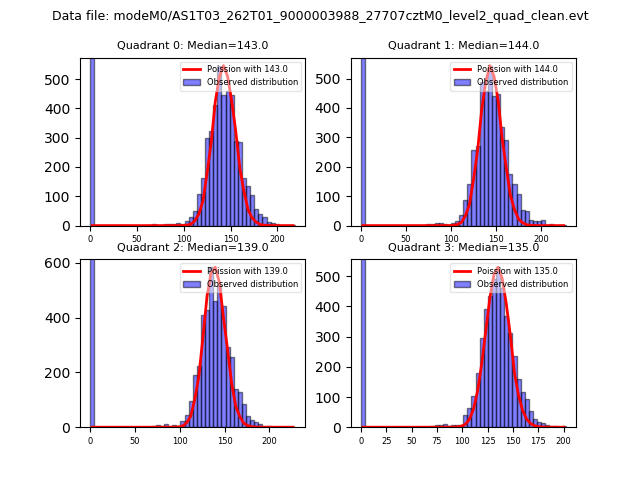 |
 |
| Quadrant-wise count rates Data is divided into 100 sec bins |
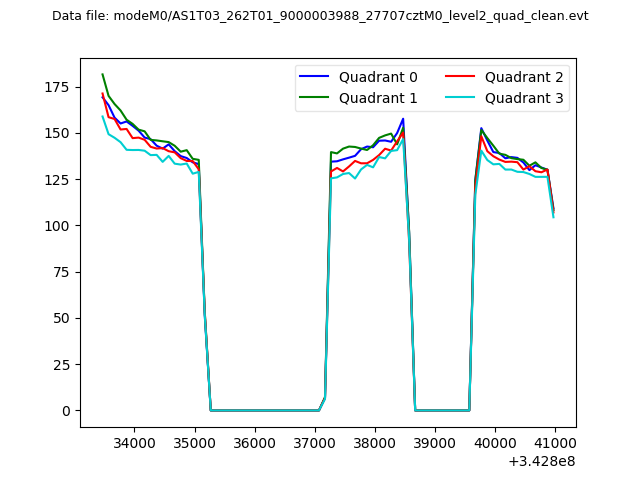 |
|
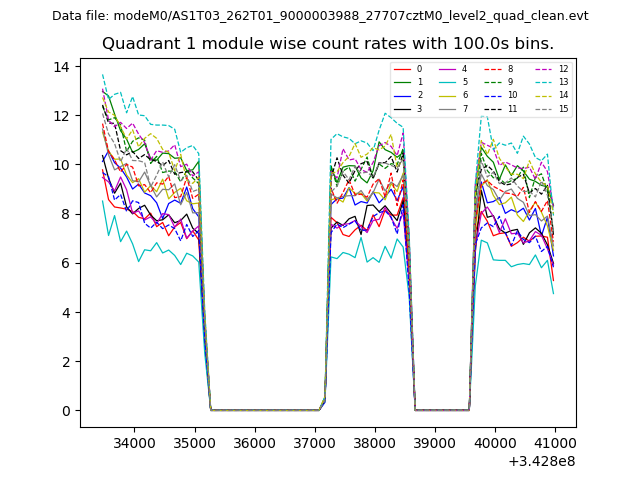
| Module-wise count rates for Quadrant A Data is divided into 100 sec bins |
 |
 |
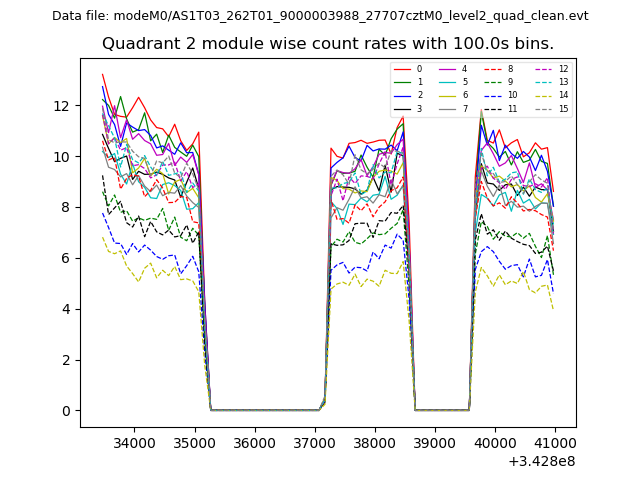
| Module-wise count rates for Quadrant B Data is divided into 100 sec bins |
 |
 |
| Module-wise count rates for Quadrant C Data is divided into 100 sec bins |
 |
 |
| Module-wise count rates for Quadrant D Data is divided into 100 sec bins |
 |
 |
| Parameter | Plot |
|---|---|
| CZT HV Monitor | 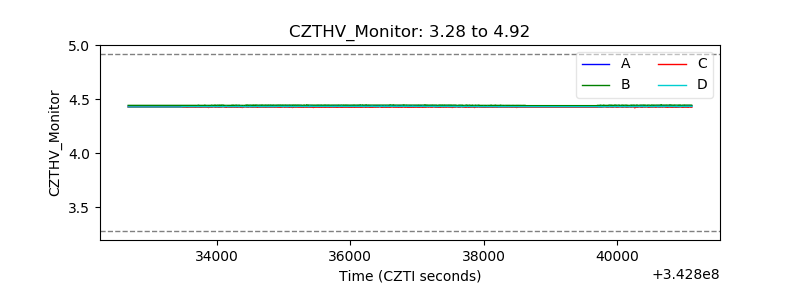 |
| D_VDD | 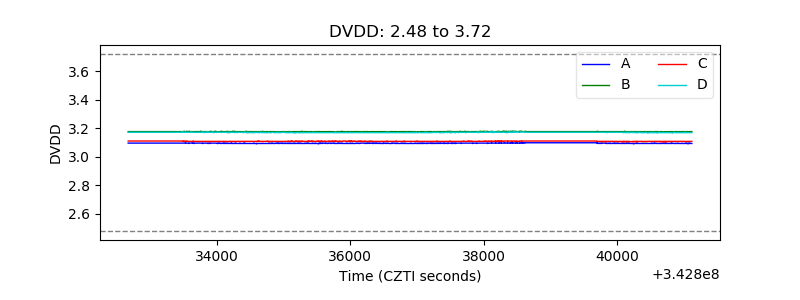 |
| Temperature 1 | 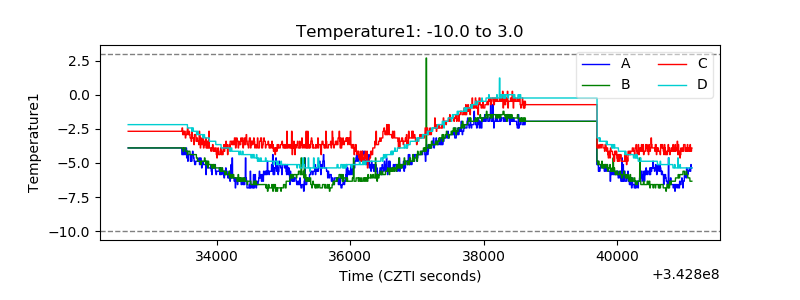 |
| Veto HV Monitor |  |
| Veto LLD | 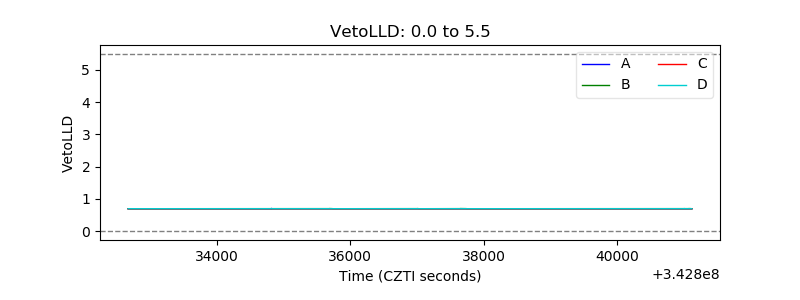 |
| Alpha Counter | 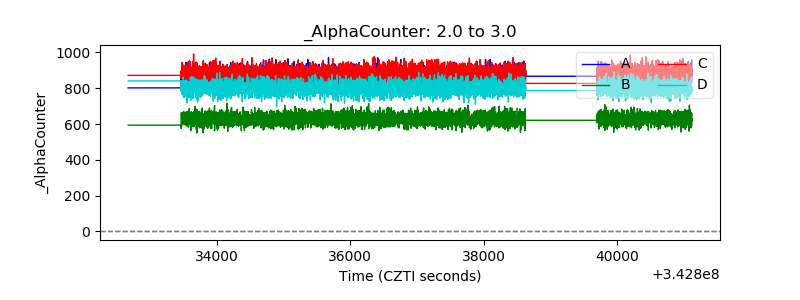 |
| _CPM_Rate |  |
| CZT Counter | 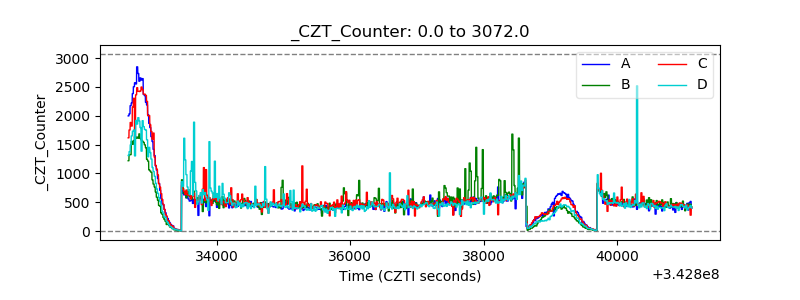 |
| +2.5 Volts monitor |  |
| +5 Volts monitor |  |
| _ROLL_ROT |  |
| _Roll_DEC | 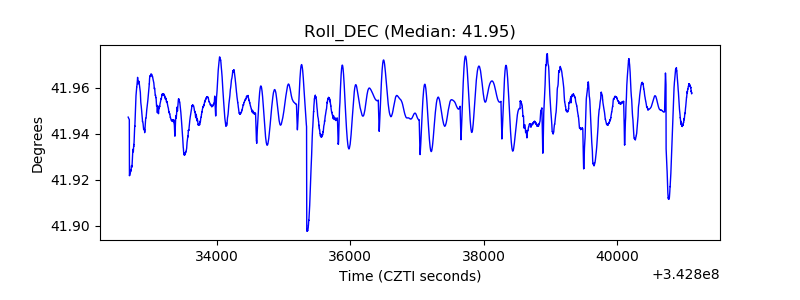 |
| _Roll_RA | 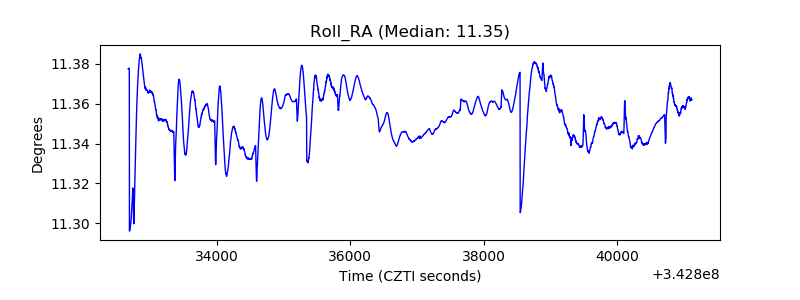 |
| Veto Counter |  |