| Param | Original file | Final file |
|---|---|---|
| Filename | modeM0/AS1T03_262T01_9000003988_27708cztM0_level2.evt | modeM0/AS1T03_262T01_9000003988_27708cztM0_level2_quad_clean.evt |
| Size (bytes) | 499,144,320 | 102,012,480 |
| Size | 476.0 MB | 97.3 MB |
| Events in quadrant A | 3,441,467 | 656,364 |
| Events in quadrant B | 4,044,067 | 659,088 |
| Events in quadrant C | 3,600,673 | 642,890 |
| Events in quadrant D | 3,537,530 | 625,899 |
| Mode M0 | |||
|---|---|---|---|
| Quadrant | BADHDUFLAG | Total packets | Discarded packets |
| A | 0 | 14990 | 0 |
| B | 0 | 16739 | 0 |
| C | 0 | 15356 | 0 |
| D | 0 | 15628 | 0 |
| Mode M9 | |||
|---|---|---|---|
| Quadrant | BADHDUFLAG | Total packets | Discarded packets |
| A | 0 | 18 | 0 |
| B | 0 | 18 | 0 |
| C | 0 | 18 | 0 |
| D | 0 | 18 | 0 |
| Quadrant | Total seconds | Saturated seconds | Saturation percentage |
|---|---|---|---|
| A | 7253 | 37 | 0.510134% |
| B | 7254 | 135 | 1.861042% |
| C | 7253 | 104 | 1.433889% |
| D | 7253 | 46 | 0.634220% |
Noise dominated data is calculated using 1-second bins in cleaned event files. If a bin has >2000 counts, and if more than 50% of those come from <1% of pixels, then it is considered to be noise-dominated and hence unusable.
| Quadrant | # 1 sec bins | Bins with >0 counts | Bins with >2000 counts | High rate bins dominated by noise | Noise dominated (total time) | Noise dominated (detector-on time) | Marked lightcurve |
|---|---|---|---|---|---|---|---|
| A | 9063 | 7254 | 1 | 1 | 0.01% | 0.01% | 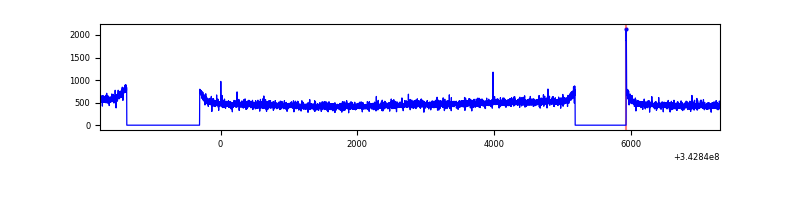 |
| B | 9064 | 7255 | 16 | 16 | 0.18% | 0.22% | 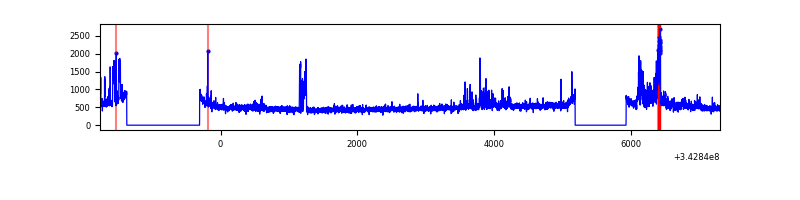 |
| C | 9063 | 7254 | 0 | 0 | 0.00% | 0.00% | 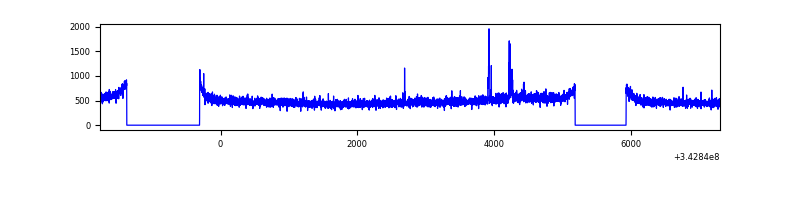 |
| D | 9063 | 7255 | 19 | 19 | 0.21% | 0.26% | 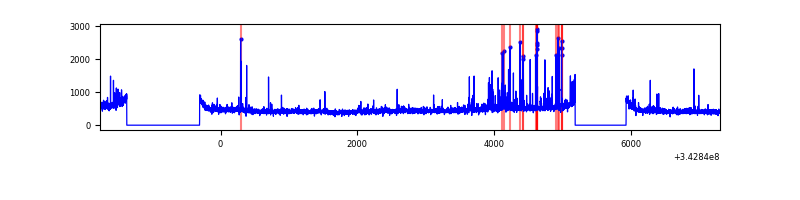 |
Top three noisy pixels from each quadrant. If the there are fewer than three noisy pixels in the level2.evt file, extra rows are filled as -1
| Pixel properties | Quadrant properties | ||||||
|---|---|---|---|---|---|---|---|
| Quadrant | DetID | PixID | Counts | Sigma | Mean | Median | Sigma |
| A | 13 | 254 | 12221 | 63.21 | 890 | 868 | 179.6 |
| A | 8 | 192 | 8737 | 43.81 | 890 | 868 | 179.6 |
| A | 3 | 137 | 8449 | 42.21 | 890 | 868 | 179.6 |
| B | 3 | 112 | 391457 | 2326.34 | 885 | 863 | 167.9 |
| B | 12 | 0 | 65627 | 385.73 | 885 | 863 | 167.9 |
| B | 0 | 230 | 54743 | 320.9 | 885 | 863 | 167.9 |
| C | 14 | 238 | 136974 | 677.87 | 863 | 869 | 200.8 |
| C | 3 | 233 | 76303 | 375.7 | 863 | 869 | 200.8 |
| C | 8 | 208 | 21305 | 101.78 | 863 | 869 | 200.8 |
| D | 1 | 52 | 174314 | 849.17 | 861 | 838 | 204.3 |
| D | 2 | 250 | 76612 | 370.92 | 861 | 838 | 204.3 |
| D | 2 | 234 | 25419 | 120.32 | 861 | 838 | 204.3 |
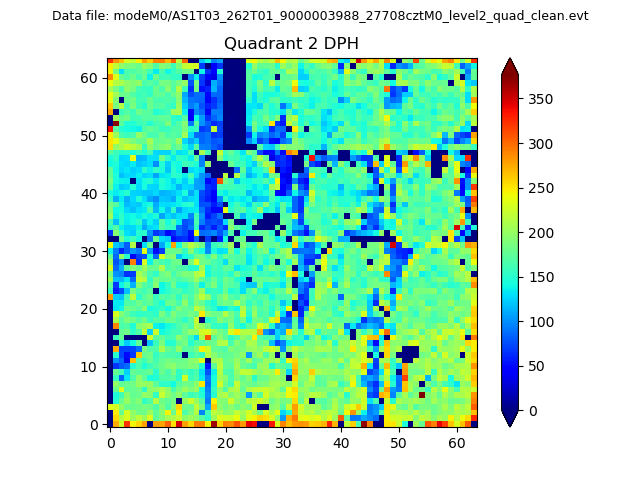
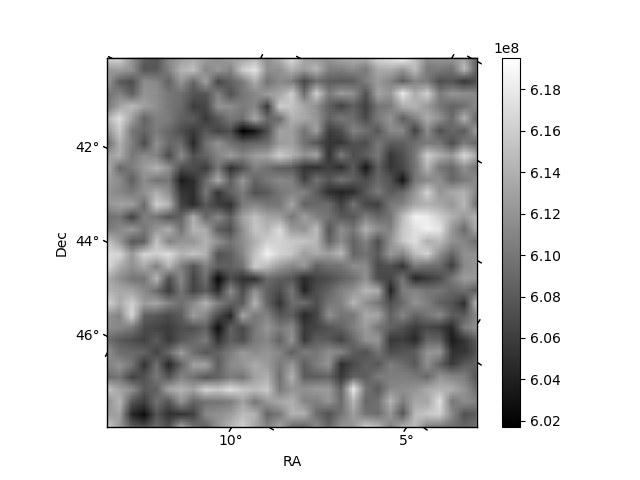
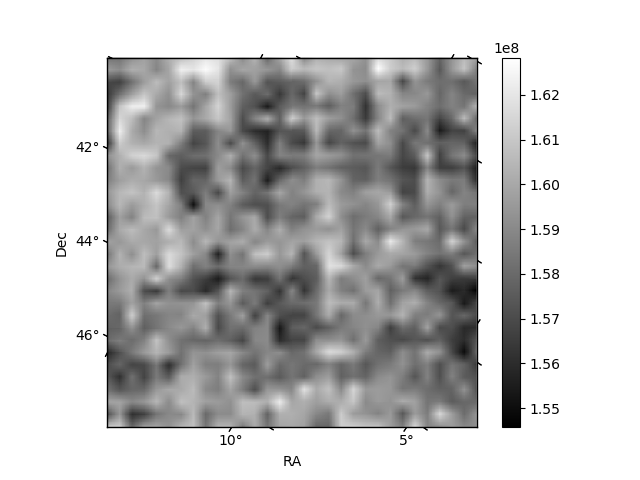
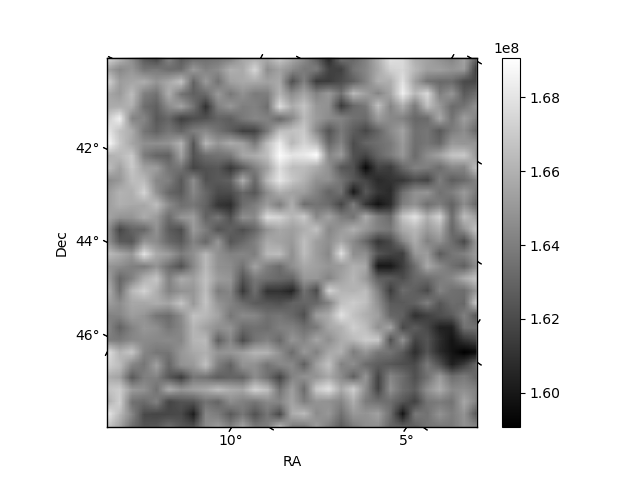
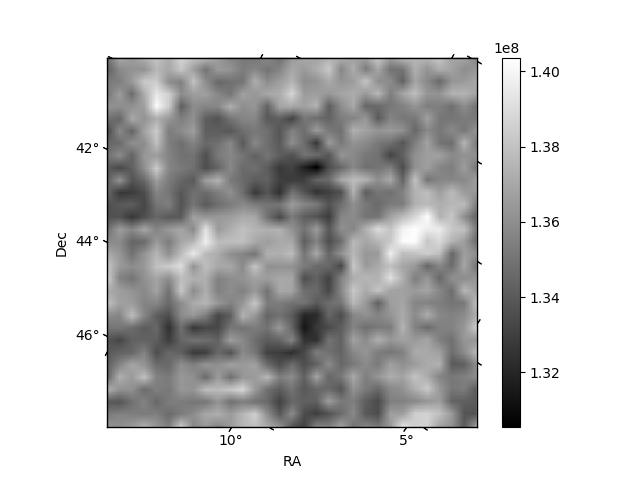
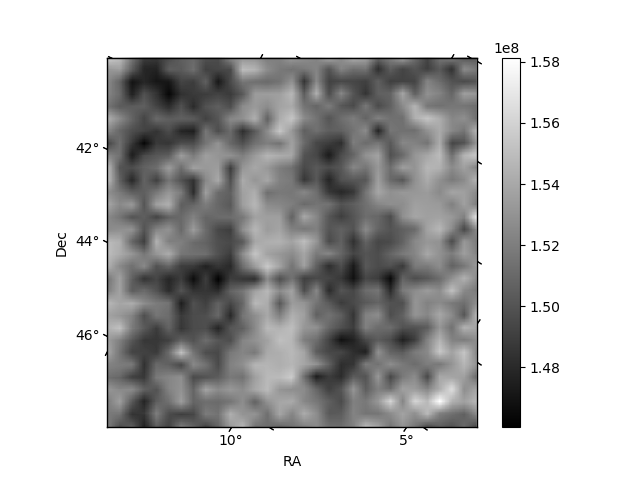
Histogram calculated using DETX and DETY for each event in the final _common_clean file
| Quadrant A | 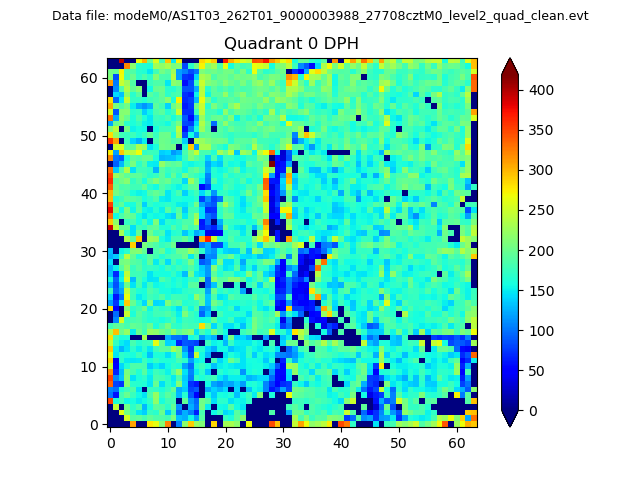 |
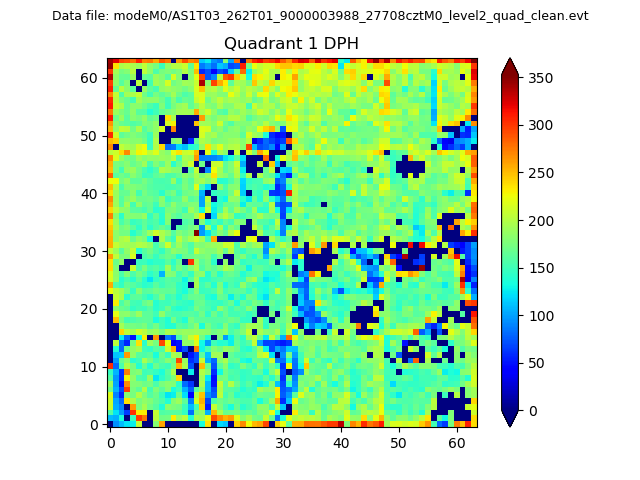 |
Quadrant B |
|---|---|---|---|
| Quadrant D | 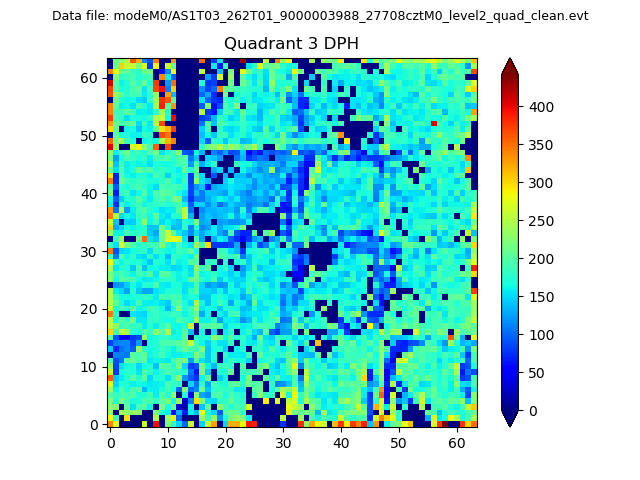 |
 |
Quadrant C |
| Plot type | Count rate plots | Images |
|---|---|---|
| Comparison with Poisson distribution Blue bars denote a histogram of data divided into 1 sec bins. Red curve is a Poisson curve with rate = median count rate of data. |
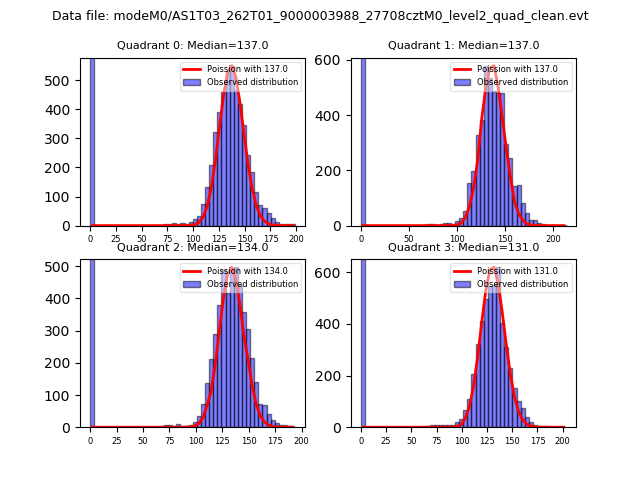 |
 |
| Quadrant-wise count rates Data is divided into 100 sec bins |
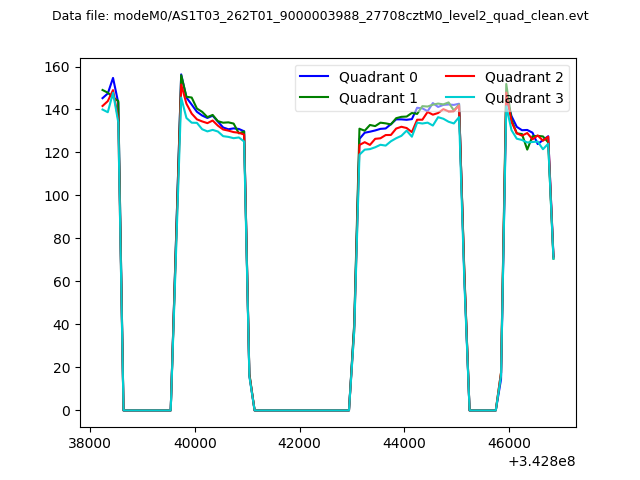 |
|
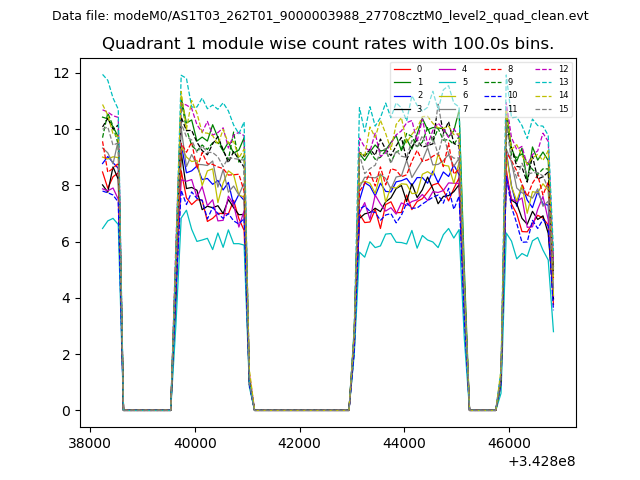
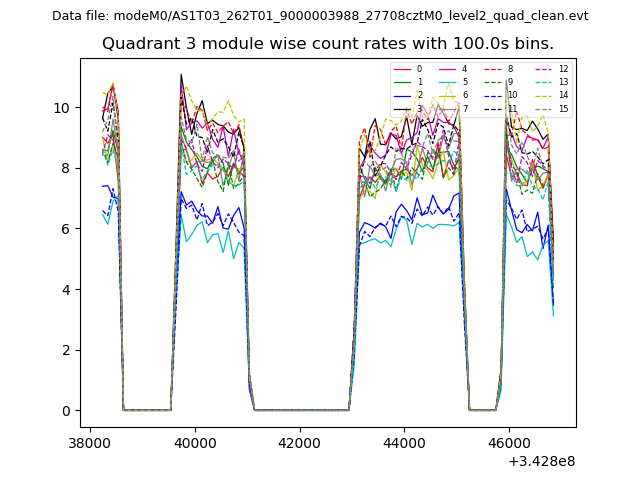
| Module-wise count rates for Quadrant A Data is divided into 100 sec bins |
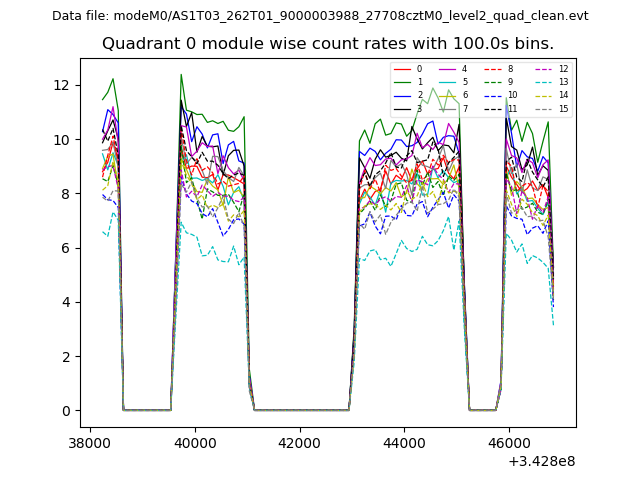 |
 |
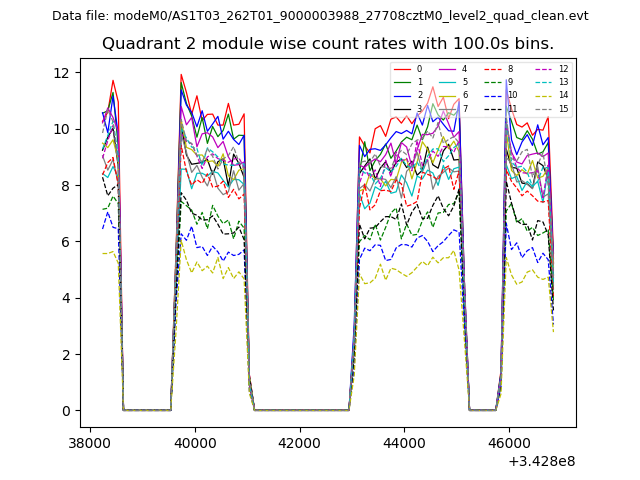
| Module-wise count rates for Quadrant B Data is divided into 100 sec bins |
 |
 |
| Module-wise count rates for Quadrant C Data is divided into 100 sec bins |
 |
 |
| Module-wise count rates for Quadrant D Data is divided into 100 sec bins |
 |
 |
| Parameter | Plot |
|---|---|
| CZT HV Monitor | 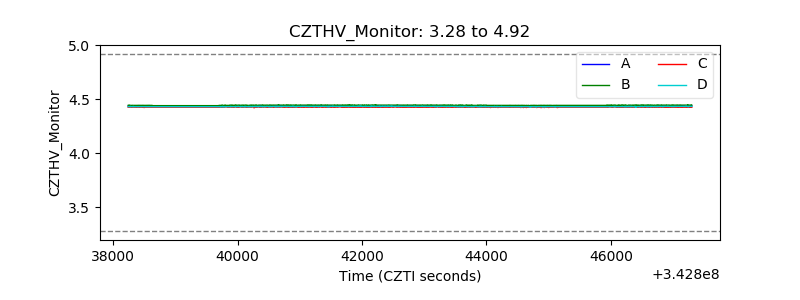 |
| D_VDD | 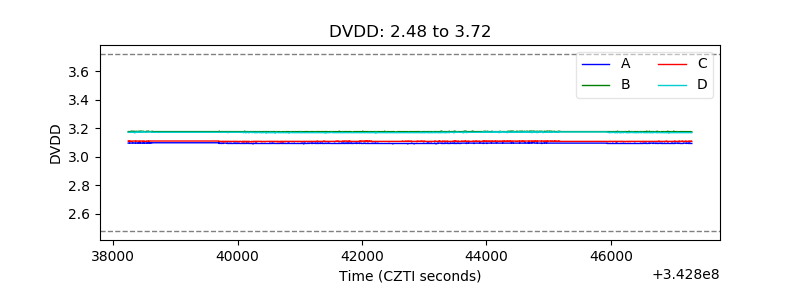 |
| Temperature 1 | 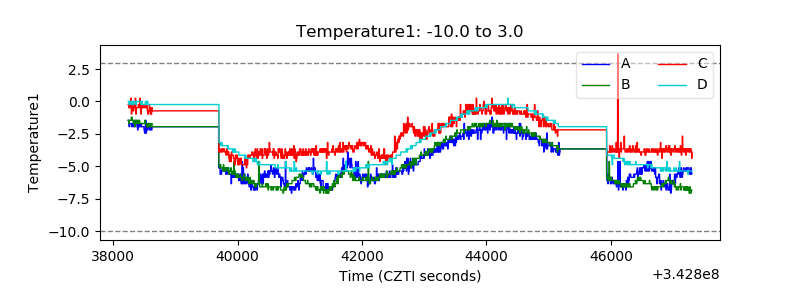 |
| Veto HV Monitor | 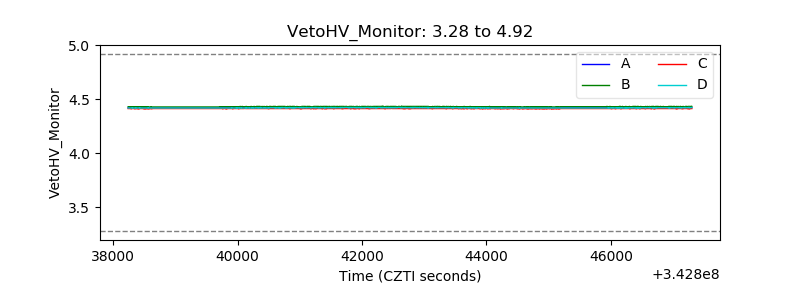 |
| Veto LLD | 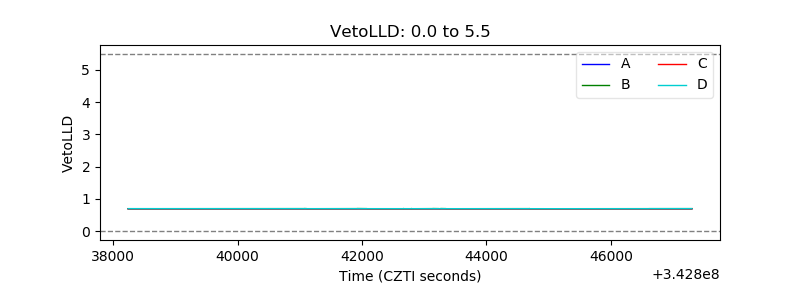 |
| Alpha Counter | 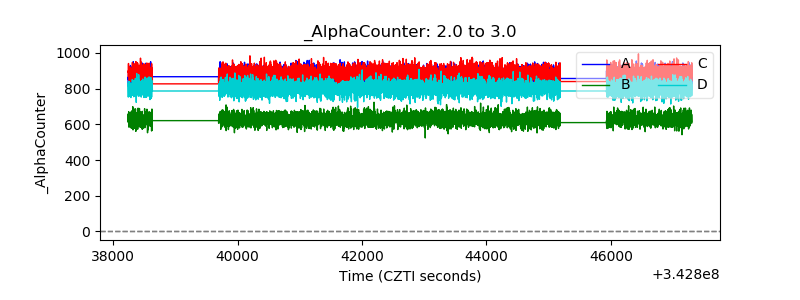 |
| _CPM_Rate | 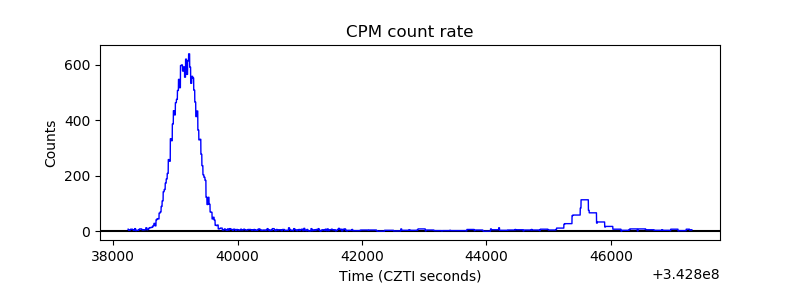 |
| CZT Counter | 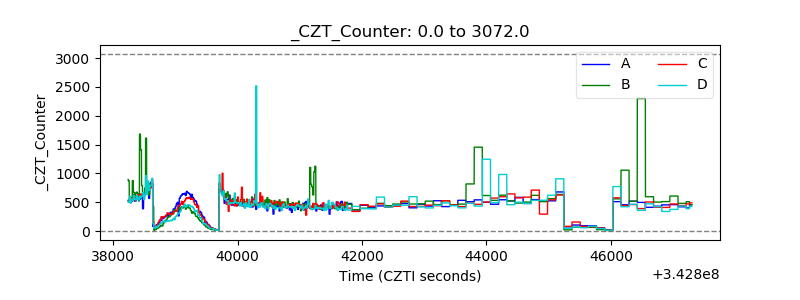 |
| +2.5 Volts monitor | 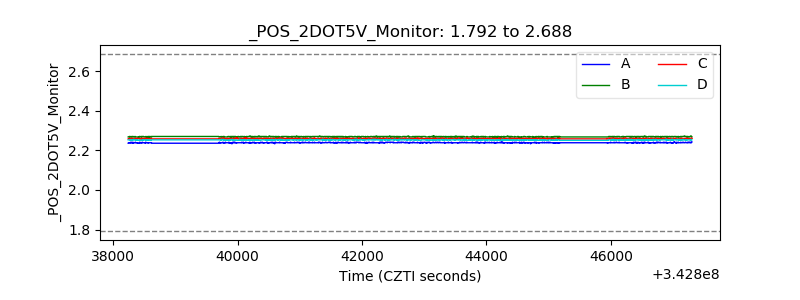 |
| +5 Volts monitor |  |
| _ROLL_ROT | 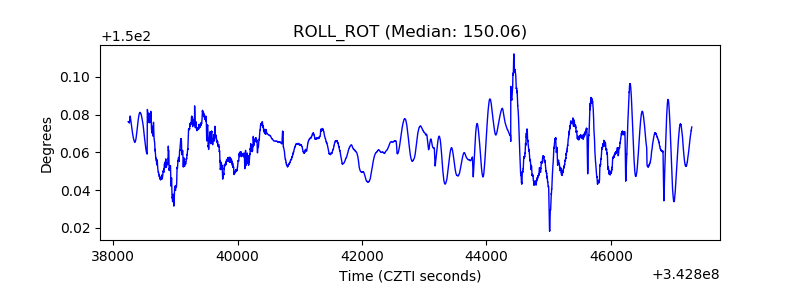 |
| _Roll_DEC | 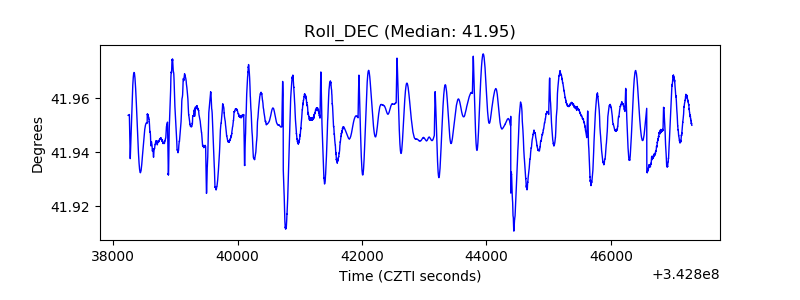 |
| _Roll_RA | 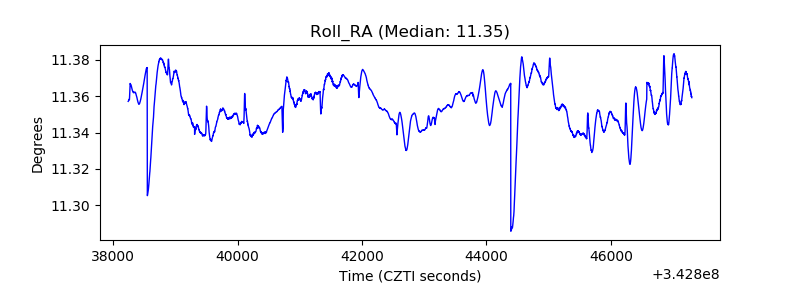 |
| Veto Counter | 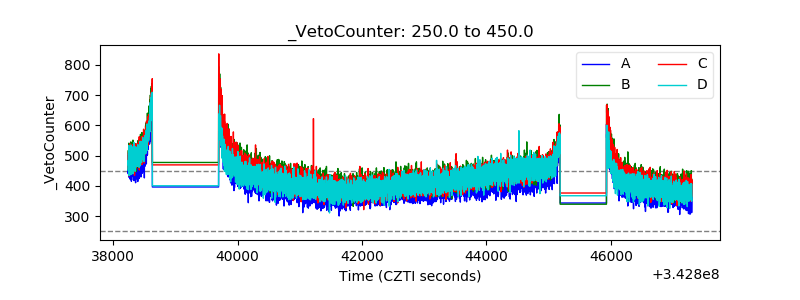 |